Sexually Transmitted Infections, the Epidemic That Persists After the COVID- 19 Pandemic: a Time-series Analysis of the Primary Care Electronic ...
←
→
Page content transcription
If your browser does not render page correctly, please read the page content below
Sexually Transmitted Infections, the Epidemic That Persists After the COVID-
19 Pandemic: a Time-series Analysis of the Primary Care Electronic Health
Records Covering About 5 Million People in Catalonia
Carolina Guiriguet
Institut Català de la Salut
Mireia Alberny
Institut Català de la Salut
Ermengol Coma ( ecomaredon@gencat.cat )
Institut Català de la Salut
Carme Roca
Institut Català de la Salut
Francesc Fina
Institut Català de la Salut
Mireia Fàbregas
Institut Català de la Salut
Mència Benítez
Institut Català de la Salut
Manuel Medina
Institut Català de la Salut
Mariam de la Poza
Institut Català de la Salut
Research Article
Keywords: Sexually Transmitted Diseases, covid-19, primary care, epidemiology
Posted Date: September 15th, 2021
DOI: https://doi.org/10.21203/rs.3.rs-871742/v1
License: This work is licensed under a Creative Commons Attribution 4.0 International License. Read Full License
Page 1/12Abstract
Background: The COVID-19 pandemic and related control measures have affected the diagnosis of other diseases, including sexually transmitted infections
(STI). Our aim is to analyse the impact of the COVID-19 pandemic on the incidence of STI diagnosed in primary care.
Methods: Time-series study of STI, using data from primary care electronic health records in Catalonia (Spain) from January 2016 to March 2021. We
obtained the monthly expected incidence of STI using a temporary regression, where the response variable was the incidence of STI from 2016 to 2019 and
the adjustment variables were the trend and seasonality of the time series. Excess or reduction of STI were defined as the number of observed minus the
expected cases, globally and stratified by age, sexe, type of STI and socioeconomic status.
Results: Between March 2020 and March 2021 we observed a reduction of 20.2% (95% CI: 13.0% to 25.8%) on STI diagnoses compared to the expected. This
reduction was greater during the lockdown period (-39%), in women (-26.5%), in people aged under 60 years (up to -22.4% in people aged 30-59 years), less
deprived areas (-24%) and some types of STI, specially chlamydia (-32%), gonorrhea (-30.7%) and HIV (-21.5%). Conversely, syphilis and non-specific STI were
those with lesser reductions with -3.6% and -7.2%, respectively,
Conclusions: The COVID-19 pandemic has impacted on STI incidence, reducing the number of diagnoses performed in primary care and raising concerns
about future evolution of STI trends. Those STI that are less symptomatic or diagnosed through screening will deserve special attention regarding potential
diagnostic delays.
Background
The coronavirus diseases 2019 (COVID-19) pandemic has become one of the greatest public health challenges in recent times. By 31 August 2021, SARS-CoV-
2 has caused more than 216 million confirmed cases and 4.5 million deaths worldwide [1]. The first cases in Europe were identified in France on 24 January
2020 [2] and the first official case in Catalonia (Spain) was reported a month later on 25 February. Many countries established a national lockdown in March
2020 to face the pandemic leading to a disruption of usual health care delivery systems [3, 4]. In Spain, the lockdown began on 14 March and ended on 21
June 2020 [5], encompassing a de-escalation strategy from 28 April, allowing limited social contact. Face-to-face visits were dramatically reduced during the
lockdown period with variability in its subsequent recovery. Therefore preventive care, such as screening, diagnosis and testing were also affected [6–8].
These activities involve common health problems like chronic diseases, malignant neoplasms or other infections such as sexually transmitted ones [9, 10]. In
October, in order to control the second wave of the COVID-19 pandemic, additional social restrictions were implemented in Spain, as in many European
countries, including a time limit in bars and restaurants schedules, restrictions in cultural and mass events, different levels of perimeter lockdowns and at
night curfew. All these measures may have reduced casual sexual encounters. National and international circulation and tourism have also been restricted.
Tourism has been related to more sexual contacts and sexually transmitted infections (STI) [11].
In the last few years, the incidence of STI has increased in Europe with more than half a million STI notifications in the European Union and the UK annually.
Chlamydia is the most frequently reported STI in Europe, followed by gonorrhoeae, with an increasing trend [12]. In Spain and Catalonia, the incidences of
these STI are one of the greatest incidences in Europe, as well as for syphilis[12]. In 2015, an Integrated System of Epidemiological Surveillance of AIDS/HIV
and Sexually Transmitted Infections of Catalonia was created. It integrates strategic sources of information such as the system of notifiable diseases and the
Microbiological Notification System of Catalonia. Syphilis, HIV, trichomoniasis, gonorrhoeae, chlamydia genital infection and lymphogranuloma venereum are
of mandatory and individualised notifications [13]. This notification system is integrated in the electronic health records (EHR) software implemented in
primary health care in Catalonia. The main non-complicated STI are managed in primary care practices (PCP), where laboratory tests for etiological diagnoses
are available. General practitioners are supported by sexually transmitted diseases consultants.
The COVID-19 pandemic has led to a reduction in new diagnoses of common diseases including notified infectious diseases like other respiratory transmitted
and sexually transmitted infections (14, 15). However, controversy exists in published data about the duration, the magnitude of this reduction -or even an
increase in some of them- and their underlying causes. This study aims to analyse the impact of the COVID-19 pandemic on the incidence of sexually
transmitted infections recorded in primary care EHR in Catalonia.
Methods
We performed a time-series study of sexually transmitted infections. Data were extracted from the primary care EHR of the Institut Català de la Salut (Catalan
Institute of Health, ICS, for its Catalan initials). ICS is the main primary care provider in Catalonia. It manages 3 out of 4 PCPs in the Catalan public health
system and covers about 5.8 million people.
We included all patients older than 14 years old with a STI diagnosis recorded in the EHR (see ICD-10 codes in supplementary material 1). The study period
included all months between January 2016 and March 2021. We divided this period into two for the time-series analysis: training (2016–2019) and analysis
(2020–2021). In addition, we separated the 2020–2021 available months into three periods for the calculation of the reductions of STI: “lockdown period”
from March to June 2020 coinciding with the state of alarm in Spain (including the lockdown and different phases of de-escalation), the “summer period”
from July to September 2020 with few restrictions in place; and the “autumn-winter period” from October 2020 to March 2021 which includes a second state
of alarm in Spain with some mobility restrictions and at night curfew.
Time-series analysis were performed globally, by sex, age groups (15–29 years old, 30–59 years old and older than 59 years old), type of infection, socio-
economic status and rurality. We assessed the socioeconomic status using the validated MEDEA deprivation index [16]. We categorised the MEDEA
Page 2/12deprivation index into quartiles where 1st and 4th quartiles are the least and most deprived areas, respectively. Rural areas were categorised separately and
were defined as areas with less than 10,000 inhabitants and a population density lower than 150 inhabitants/km2.
Statistical analysis
We calculated monthly STI incidence rates per 105 population as the number of new diagnoses divided by the number of alive population assigned to ICS
PCPs and multiplied by 100,000.
We obtained the expected incidence for the study period using a time series regression, where the response variable was the incidence rate per 105 inhabitants
from 2016 to 2019, and the adjustment variables were the trend and seasonality of the time series. Dataset was divided into two sets: training set (from 2016
to 2019) and analysis set (from 2020 to March 2021). We used the training set to adjust the model and we projected the estimated time series to our analysis
set.
The number of expected STI for each period was obtained by multiplying the projected incidence by the population and dividing by 100,000. Excess or
reduction of diagnosis were defined as the number of observed minus expected, estimated monthly and only for the periods where the observed incidence was
outside the 95% confidence interval (95% CI) of the time-series. We also calculated the percentage of excess or reduction as follows: (number of observed
diagnoses - number of expected diagnoses) / number of expected diagnoses.
We calculated 95% CI for each estimate.
All analyses have been conducted using R, version 3.5.1 [17].
Results
The population structure assigned to ICS’ PCPs is depicted in Table 1.
Table 1
Baseline characteristics of the study population by set: training set (2016–2019) and analysis set
(2020–2021).
Variable 2016–2019 2020–2021
Population older than 14 years 4,846,503 4,938,445
% of women 51.19 51.11
% of population between 15 and 29 years old 18.01 18.46
% of population between 30 and 59 years old 52.94 52.17
% of population older than 59 years 29.05 29.37
Socioeconomic status: % of people in the first quartile (least deprived) 21.71 21.62
Socioeconomic status: % of people in 2nd quartile 14.23 15.26
Socioeconomic status: % of people in 3rd quartile 20.91 20.68
Socioeconomic status: % of people in the 4th quartile (most deprived) 18.24 18.4
% of people in rural areas 23.91 24.03
From January 2016 to March 2021, 68,192 new STI were registered in the Catalan primary care EHR. This represents a monthly average incidence per 105
population of 22.6 during the 2016–2019 period and 21.8 during the 2020–2021 period. From January 2020 to March 2021, 16,143 new STI were recorded, of
which 76.1% were men, 51.8% were between 30 and 59 years old, 43% younger than 30 years old and only 5.2% were older than 59 years, with similar
distribution to previous years.
Figure 1 shows the observed and estimated rates of monthly new STI diagnoses (with 95% CI) since January 2020. Since March 2020 we observed that
incidence was lesser than expected for all age groups.
We estimated that the difference between expected and observed diagnoses accounted for 3,499 less STI (95% CI: 1,956 to 5,043) from March 2020 to March
2021. This represents a reduction of 20.2% of the diagnosis of STI compared to the expected. This reduction was greater during the lockdown period with 39%
reduction (95% CI: 30.1–45.9%) compared to the expected versus 14% reduction (95% CI 6.2–20%) during the summer period and 10.7% reduction (95% CI
4.8–15.2%) during the autumn-winter period (Table 2).
The estimated number of underdiagnosed STI and the percentage of underdiagnoses compared to the expected is presented stratified by age, sex, type of STI,
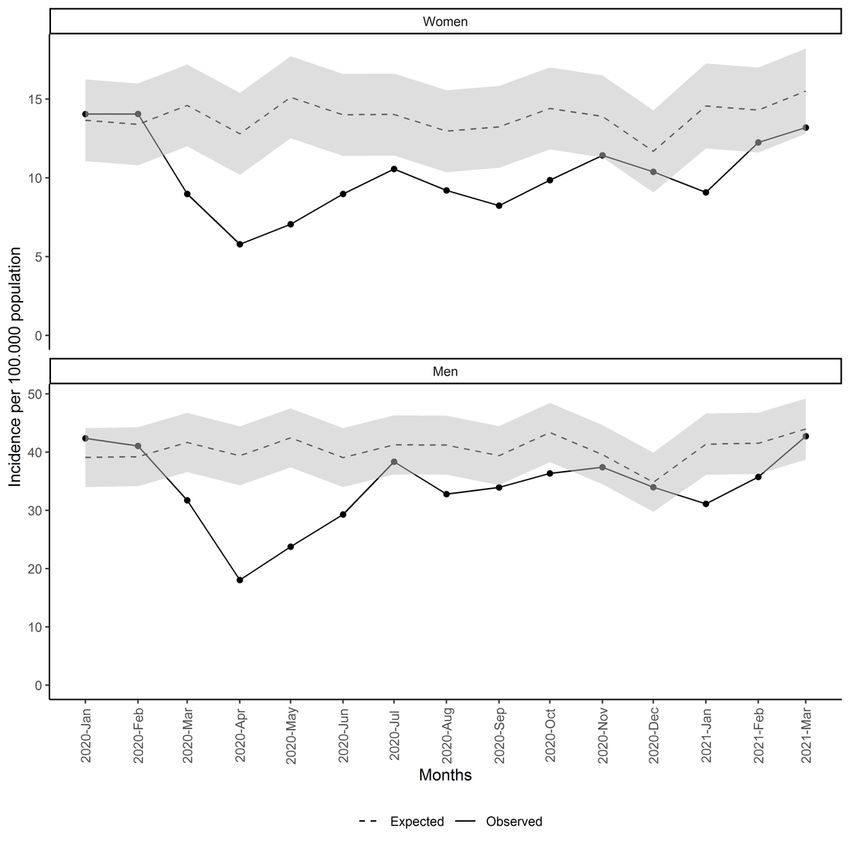
socio-economic status and rurality in Table 2. Women accounted for a larger percentage of reduction (26.5% vs 18.3% in men), especially during the summer
period: 30.4% reduction in women versus 11.4% in men (Table 2 and Fig. 2). Regarding age, reductions were similar between 15 and 59 years and lesser in
older than 59 years.
Page 3/12Table 2
Estimated number (N) of underdiagnosed STI and percentage (%) of reduction compared to the expected, overall and by periods
Total Lockdown period (March 2020 - Summer period Autumn-winter period (October 2020 -
June 2020) March 2021)
(July 2020- September
2020)
N % N % N % N %
(95% CI) (95% CI) (95% CI) (95% CI) (95% CI) (95% CI) (95% CI) (95% CI)
Total 3499 20.2 2086 39 554 14 859 10.7
(1956– (13– (1406–2766) (30.1–45.9) (214– (6.2–20) (336–1382) (4.8–15.2)
5043) 25.8) 894)
Between 15 and 1456 19.6 942 41.1 232 13.9 282 8.2
29
(848– (13.2– (640–1245) (32.2–48) (81–383) (5.6– (127–436) (4.2–11.1)
2064) 24.6) 20.2)
Between 30 and 2035 22.4 1078 38.5 453 21.6 505 12
59
(963– (12.5– (651–1504) (27.4–46.6) (134– (7.5– (178–831) (5–17.1)
3106) 29.6) 771) 31.9)
Older than 59 73 8.5 54 20.1 0 0 19 4.7
(18–128) (2.9– (17–91) 8.7–26.6) (1–37) (0.3–7.2)
11.6)
Women 1211 26.5 649 45.5 308 30.4 254 11.9
(618– (16.7– (386–911) (33.2–54) (112– (13.7– (120–388) (6.9–15.3)
1804) 33.2) 505) 41.7)
Men 2331 18.3 1440 36.7 334 11.4 556 9.4
(1221– (10.9– (951–1929) (27.7–43.7) (90–579) (3.5– (180–933) (3.5–14)
3441) 23.9) 17.5)
1st Q (least 1076 24 594 42.7 269 26.2 213 10.3
deprived)
(502– (13.7– (340–849) (29.9–51.6) (79–460) (9.4– (83–342) (4.9–13.9)
1651) 31) 37.8)
2nd Q 575 23.5 260 34.7 87 16.3 228 19.6
(290– (13.9– (147–373) (23.1–43.2) (30–143) (6.7– (112–344) (11.3–25.7)
861) 30.5) 23.1)
3rd Q 693 19.9 481 43.5 60 7.5 152 9.6
(289– (10.6– (251–710) (28.6–53.1) (3–118) (0.5– (35–269) (2.9–13.9)
1097) 25.9) 12.2)
4th Q (most 592 15 427 35.7 102 11.3 64 3.5
deprived)
(302– (8.9– (262–592) (25.4–43.5) (19–184) (2.4–18) (21–107) (1.3–5.1)
882) 19.7)
Rural 283 9.6 283 31.3 0 0 0 0
(136– (5.9– (136–430) (19.2–39.2)
430) 11.9)
Genital warts 865 19.1 683 46 98 9.7 84 4.2
(417– (11.8– (385–982) (32.4–55) (24–173) (3–14) (9–158) (0.6–6.4)
1314) 23.9)
Syphilis 31 3.6 31 11.6 0 0 0 0
(5–56) (0.9– (5–56) (3–15.1)
4.7)
Gonorrhoea 487 30.7 205 45.9 94 25 187 24.5
(206– (17.4– (112–297) (34.6–52) (33–156) (11.7– (61–314) (10.6–33)
768) 38.6) 33.3)
Chlamydia 696 32 357 55.4 159 33.4 180 17.1
(361– (20.8– (224–490) (43.8–63.1) (59–258) (15.7– (77–282) (9.1–22.5)
1030) 39.5) 44.9)
Page 4/12Total Lockdown period (March 2020 - Summer period Autumn-winter period (October 2020 -
June 2020) March 2021)
(July 2020- September
2020)
HIV 143 21.5 82 38.1 0 0 61 20.3
(26–260) (7.2– (13–152) (10.7–49.5) (14–108) (8.9–24.4)
26.8)
Genital herpes 407 17.3 246 33.5 51 9.5 110 10.2
(136– (7.4– (92–400) (15.8–45) (13–89) (3.1– (32–188) (3.8–14.3)
678) 23.7) 13.6)
Non-specific STI 68 7.2 68 24.5 0 0 0 0
(23–113) (3.5– (23–113) (12.2–30.8)
9.1)
Non-specific 280 7.7 193 17.6 0 0 87 5.2
urethritis
(136– (4.5–10) (98–289) (10.8–22.5) (38–136) (2.7–6.9)
425)
Others 88 15.1 24 13.7 20 16.1 45 15.8
(14–161) (4.1– (5–42) (4.9–16.9) (1–38) (1.4– (8–82) (4.6–20.8)
19.6) 21.3)
Reductions were observed in all types of STI although were greater in gonorrhoea and chlamydia (Table 2 and Fig. 3) with 30.7% overall reduction (95% CI
17.4–38.6%) and 32% (95% CI 20.8–39.5%) respectively. In addition, we observed only a small excess at the end of 2020 in non-specific urethritis.
Regarding socio-economic status and rurality, rural areas had less reduction than urban areas (9.6% overall reduction in rural versus 24% in less deprived
areas) and this reduction only accounted for the lockdown period. In general, less deprived areas had greater reductions than most deprived areas, especially
during the summer and autumn-winter periods (Table 2 and Fig. 4).
Discussion
Summary
This time-series study encompassing EHR’s reported cases of STI in primary care in Catalonia found a global decrease of 20.2% of the expected monthly
incidence of STI in the 2020–2021 analysis period compared to the expected. This reduction was greater during the lockdown period (up to 39%). The most
affected groups were women, people under the age of 60 years, less deprived urban areas and some types of STI (chlamydia, gonorrhoea and HIV).
Comparison with existing literature
Several studies reported a decline in new STI diagnosis during the lockdown period probably related to the impact of social distancing measures [9, 10, 14, 15,
18–20]. In addition, some studies described a reduction in the number of casual sex encounters [21, 22], although others showed a stable number or even an
increase in some high-risk sexually active populations [23]. On the other hand, many countries in the WHO European Region reported severe disruptions in test
provision (up to more than 50% decline in testing volume) due in part to testing site closure, reduced attendance, laboratories overburdened, etc [24].
Overall, Chlamydia genital infection was the STI with the greatest reduction in our study. This finding was higher than the under 20% reported in literature [9,
15, 20]. In Spain, a multitest including gonococcal, chlamydia, mycoplasma genitalium and trichomonas infection is available in primary care centres. This
may explain the concordance of reduction in chlamydia and gonococcal infections, with a higher decline in the first one due to a higher number of
asymptomatic cases detected by screening measures that were halted during the lockdown period. However, some European countries did not find relevant
changes in incidence [15] or attendance [6] for chlamydia or gonococcal infections, maybe due to lesser restricted social and travel measures [25]. Gonococcal
genital infection showed disparities in previous studies with a wide range from increased incidence [9, 14, 20, 26] (up to 56% in Taiwan [14]) to reduced new
diagnoses[9, 15, 18] (up to 36,9% reduction in Greece [18]).
In Melbourne, despite keeping usual care in sexual centres, a reduction of 40% in attendees, 65% in screening or 40% in non-gonococcal urethritis was found
during the lockdown period (23 March to 10 may 2020) compared with the previous months of the year. However, non-significant differences were observed in
such STI with marked symptoms, like syphilis or pelvic inflammatory disease. In our study, the STI with lesser reduction was syphilis. This result is consistent
with other data reported elsewhere, showing little increased figures and reductions of less than 10% in syphilis trends [9, 14, 18, 20]. This may suggest that
people presenting more severe clinical conditions seek medical attendance, leading to a specific STI diagnosis [10]. Another reason could be that extragenital
or skin transmissible lesions of syphilis escape from the use of barrier methods to prevent STI, compared with urethral discharge characteristic of gonorrhea,
which had shown greater reductions than syphilis in the context of the COVID-19 pandemic [19, 20]. In addition, non-specific STI and urethritis were the only
STI that rose above the expected during the post lockdown period; except in January 2021 for urethritis, coinciding with a third wave of coronavirus disease in
Catalonia. Probably, restrictions affecting both laboratory and PCP’s accessibility could lead to an increase of non-specific diagnoses at the expense of an
underreporting of etiologic STIs.
Page 5/12HIV was underdiagnosed in consonance with published data [14, 15, 20] or persistently allocated in the low expected confidence interval during the three
periods analysed in 2020–2021. Regardless of the small number of HIV cases, it deserves special attention due to the burden of the disease. In the near future,
special efforts should focus on monitoring whether there will be a rebound or greater diagnostic delay in new HIV cases, hindering the achievement of the 90-
90-90 WHO goals for HIV infection [27, 28].
Limitations and strengths
We are aware of some limitations of the study. First, we performed a time-series study with ecological data thus not allowing to ensure a causal correlation
between reduction of incidence and COVID-19 pandemic. As our analysis is based on crude rate, major changes in population structure could limit the results
although population age and gender distribution has remained relatively stable in the study period. In addition, sex is categorized as a binary variable in the
EHR, without taking into account the gender perspective or sexual orientation.
The study also has strengths to be considered. Several studies have used the Catalan primary care EHR data to perform useful research in real-world
conditions including other analysis with diagnosis during the pandemic [29, 30]. Our analysis extends the first wave of COVID-19-short-term effects and lasts
for more than one year in contrast to other studies focused on the lockdown period only or a few months afterwards. We assessed the socioeconomic
differences of special interest for STI and vulnerable populations. Moreover, most published studies focused on some mandatory notifiable STI; in contrast,
this study provides a broad overview of the most common STIs managed in primary health care. In addition, data on non-specific STIs were included. This is
of great importance given the possible under-registration of new specific diagnoses due to lack of access to laboratory tests. Finally, as ICS manages about
75% of primary care practices in Catalonia, our results are generalizable and our method could be introduced in other settings using EHR.
Conclusions
Despite government social restrictions some populations maintained high-risk sexual behaviour, maybe due to previous sexual behaviour or because of
feeling at lower risk for complications in case of acquiring SARS-CoV-2 infection during close contact. We must be aware that after this year of social
restrictions there could be an increase in high-risk sexual behaviors and consequently a rebound in STI or delayed HIV diagnoses. Among the lessons learnt
from COVID-19 pandemic, it highlights the importance of maintaining medical access to STI-related consultations, and promoting self-testing and home-
based screening strategies [31] for the vulnerable and those at the most increased sexual behaviour risk.
Abbreviations
95%CI: 95% Confidence interval
COVID-19: Coronavirus disease 2019
EHR: Electronic health records
ICS: Catalan Institute of Health (for its Catalan initials)
ICD-10: International Classification of Diseases 10th revision
STI: Sexually transmitted infections
Declarations
Ethical Approval and Consent to Participate
All analysis and methods of this study have been performed in accordance with the Declaration of Helsinki (last update, Fortaleza, Brazil 2013) and existing
relevant guidelines and regulations in Spain. This work was also approved by the Clinical Research Ethics Committee of the IDIAPJGol (project code: 20/172-
PCV), including a waiver for the informed consent of patients taking part in the study, and the data extracted from the EHR were fully anonymised. There was
no patient or public involvement in this study.
Consent for publication:
Not applicable
Availability of data and materials
Competing interests
None declared.
Funding
The authors have not declared a specific grant for this research from any funding agency in the public, commercial or not-for-profit sectors.
Authors’ contributions:
Page 6/12All authors contributed to the design of the study, the interpretation of the results, and reviewed the manuscript. CG, EC and FF had access to the data and
acted as guarantors. EC performed the statistical analysis. CG and EC wrote the first draft of the manuscript. All authors critically revised the manuscript. The
corresponding author attests that all listed authors meet authorship criteria and that no others meeting the criteria have been omitted.
Acknowledgements:
The authors of this paper would like to thank all primary care professionals and STI consultants in Catalonia for their work and resilience providing care to the
catalan population during these difficult times. We also would like to acknowledge the efforts of all members of the SISAP team during the last months.
References
1. World Health Organization.WHOCoronavirusdisease(COVID-19)dashboard.2021.https://covid19.who.int/.
2. Bernard StoecklinS,RollandP,SilueY,etal.First cases of coronavirus disease 2019 (COVID-19) in France: surveillance, investigations and control measures,
January 2020.Euro Surveill.2020;25:2000094.
3. SantiL,GolinelliD,TampieriA,FarinaG,GrecoM,RosaS,BeleffiM,BiavatiB,CampinotiF,GuerriniS,FerrariR,RucciP,FantiniMP,GiostraF.Non-COVID-
19patientsintimesofpandemic:Emergencydepartmentvisits,hospitalizationsandcause-
specificmortalityinNorthernItaly.PLoSOne.2021Mar22;16(3):e0248995.doi:10.1371/journal.pone.0248995.PMID:33750990;PMCID:PMC7984614.
4. LeveneLS,SeiduS,GreenhalghT,KhuntiK.Pandemicthreatensprimarycareforlongtermconditions.BMJ.2020Oct5;371:m3793.doi:10.1136/bmj.m3793.PMID:3
5. Boletín oficial del estado
(BOE).RealDecreto463/2020,de14marzo,porelquesedeclaraelestadodealarmaparalagestióndelasituacióndecrisissanitariaocasionadaporelCOVID-19:
https://www.boe.es/diario_boe/txt.php?id=BOE-A-2020-3692
6. SacchelliL,VivianiF,OrioniG,etal.Sexually transmitted infections during the COVID-19 outbreak: comparison of patients referring to the service of sexually
transmitted diseases during the sanitary emergency with those referring during the common practice.J Eur Acad Dermatol Venereol.2020;34(10):e553-
e556.doi:10.1111/jdv.16694
7. SimõesD,StengaardAR,CombsL,RabenD;EuroTESTCOVID-19 impact assessment consortium of partners. Impact of the COVID-19 pandemic on testing
services for HIV, viral hepatitis and sexually transmitted infections in the WHO European Region, March to August 2020.Euro Surveill.2020;25(47):2001943.doi:10.2807/1560-
7917.ES.2020.25.47.2001943
8. HammoudMA,GrulichA,HoltM,etal.Substantial Decline in Use of HIV Preexposure Prophylaxis Following Introduction of COVID-19 Physical Distancing
Restrictions in Australia: Results From a Prospective Observational Study of Gay and Bisexual Men.J Acquir
Immune Defic Syndr.2021;86(1):22–30.doi:10.1097/QAI.0000000000002514
9. CraneMA,PopovicA,StolbachAI,GhanemKG.Reporting of sexually transmitted infections during the COVID-19 pandemic.Sex Transm
Infect.2021;97(2):101–102.doi:10.1136/sextrans-2020-054805
10. ChowEPF,HockingJS,OngJJ,PhillipsTR,FairleyCK.Sexually Transmitted Infection Diagnoses and Access to a Sexual Health Service Before and After the
National Lockdown for COVID-19 in Melbourne, Australia.Open Forum Infect Dis.2020;8(1):ofaa536.Published 2020 Nov 2.doi:10.1093/ofid/ofaa536
11. RogstadKE.Sexually transmitted infections and travel.Curr Opin Infect Dis.2019;32(1):56–62.doi:10.1097/QCO.0000000000000513
12. EuropeanCentreforDiseasePreventionandControl.Gonorrhoea.In:ECDC. Annualepidemiological report for 2018.Stockholm:ECDC;2019.
13. Centre d’Estudis Epidemiològics sobres les Infeccions de
TransmissióSexualiSidadeCatalunya(CEEISCAT).VigilànciaepidemiològicadelesInfeccionsdeTransmissióSexual(ITS)aCatalunya.Informeanual2019.Badal
color:#FF3300;udirection:rtl;>https://canalsalut.gencat.cat/web/.content/_A-Z/S/sida/enllasos/anual_ITS.pdf
14. LaiCC,ChenSY,YenMY,LeePI,KoWC,HsuehPR.The impact of the coronavirus disease 2019 epidemic on notifiable infectious diseases in Taiwan: A database
analysis.Travel Med Infect Dis.2021;40:101997.doi:10.1016/j.tmaid.2021.101997
15. SteffenR,LautenschlagerS,FehrJ.Travel restrictions and lockdown during the COVID-19 pandemic-impact on notified infectious diseases in Switzerland.J
Travel Med.2020;27(8):taaa180.doi:10.1093/jtm/taaa180
16. Garcia-GilM,ElorzaJM,BanqueM,etal.Linking of primary care records to census data to study the association between socioeconomic status and cancer
incidence in Southern Europe: a nation-wide ecological study.PLoS One.2014;9(10):e109706.
17. R Core Team.R software: Version 3.5.1. R Found Stat Comput Published Online First: 2018.doi:10.1007/978-3-540-74686-7
18. ApallaZ,LallasA,MastraftsiS,etal.Impact of COVID-19 pandemic on STIs in Greece [published online ahead of print, 2021 Mar 2].Sex Transm Infect.2021;
sextrans-2021-054965
.doi:10.1136/sextrans-2021-054965
19. RodríguezI,HernándezY.Sexually Transmitted Diseases during the COVID-19 pandemic: a focus on syphilis and gonorrhoea in Cuba [published online
ahead of print, 2020 Dec 17].Public Health Pract (Oxf).2020;2:100072.doi:10.1016/j.puhip.2020.100072
20. CusiniM,BenardonS,VidoniG,BrignoloL,VeraldiS,MandoliniPL.Trend of main STIs during COVID-19 pandemic in Milan, Italy.Sex Transm Infect.2021;97(2):99.doi:10.1136/sextrans-2020-054608
21. VanBilsenWPH,ZimmermannHML,BoydA,etal.Sexual Behavior and Its Determinants During COVID-19 Restrictions Among Men Who Have Sex With Men in
Amsterdam.J Acquir Immune Defic Syndr.2021;86(3):288–296.doi:10.1097/QAI.0000000000002581
Page 7/1222. HammoudMA,MaherL,HoltM,etal.Physical Distancing Due to COVID-19 Disrupts Sexual Behaviors Among Gay and Bisexual Men in Australia:
Implications for Trends in HIV and Other Sexually Transmissible Infections.J Acquir Immune Defic Syndr.2020;85(3):309–
315.doi:10.1097/QAI.0000000000002462
23. StephensonR,ChavandukaTMD,RossoMT,etal.Sex in the time of COVID-19: results of an online survey of gay, bisexual and other men who have sex with
men’s experience of sex and HIV prevention during the US COVID-19 epidemic.AIDS Behav.2020:1–9.doi:10.1007/ s10461-020-03024-8.
24. SimõesD,StengaardAR,CombsL,RabenD;EuroTESTCOVID-19 impact assessment consortium of partners. Impact of the COVID-19 pandemic on testing
services for HIV, viral hepatitis and sexually transmitted infections in the WHO European Region, March to August 2020.Euro
Surveill.2020;25(47):2001943.doi:10.2807/1560-7917.ES.2020.25.47.2001943
25. KuitunenI,PonkilainenV.COVID-19-related nationwide lockdown did not reduce the reported diagnoses of Chlamydia trachomatisand Neisseria
gonorrhoeae in Finland [published online ahead of print, 2021 Jan 4].Sex Transm Infect.2021;
sextrans-2020-054881
.doi:10.1136/sextrans-2020-054881
26. HeerfordtIM.STIs during the first and second wave of COVID-19 in Denmark [published online ahead of print, 2021 Mar 18].Sex Transm Infect.2021;
sextrans-2021-055021
.doi:10.1136/sextrans-2021-055021
27. OgunbodedeOT,Zablotska-ManosI,LewisDA.Potential and demonstrated impacts of the COVID-19 pandemic on sexually transmissible infections:
Republication.Curr Opin HIV AIDS.2021;16(2):115–120.doi:10.1097/COH.0000000000000672
28. JennessSM,LeGuillouA,ChandraC,etal.Projected HIV and Bacterial Sexually Transmitted Infection Incidence Following COVID-19-Related Sexual
Distancing and Clinical Service Interruption.J Infect Dis.2021;223(6):1019–1028.doi:10.1093/infdis/jiab051
29. ComaE,GuiriguetC,MoraN,etal.Impact of the COVID-19 pandemic and related control measures on cancer diagnosis in Catalonia: a time-series analysis of
primary care electronic health records covering about five million people.BMJ Open.2021;11(5):e047567.Published 2021 May 18.doi:10.1136/bmjopen-
2020-047567
30. ComaE,Méndez-BooL,MoraN,etal.DivergencesonexpectedpneumoniacasesduringtheCOVID-19epidemicinCatalonia:atime-
seriesanalysisofprimarycareelectronichealthrecordscoveringabout6
millionpeople.BMCInfectDis.2021;21(1):283.Published2021Mar20.doi:10.1186/s12879-021-05985-0
31. ShihSL,GraseckAS,SecuraGM,PeipertJF.Screening for sexually transmitted infections at home or in the clinic?.Curr Opin Infect Dis.2011;24(1):78–
84.doi:10.1097/QCO.0b013e32834204a8
Figures
Page 8/12Figure 1
Monthly incidence of STI since January 20202. Total and by age group
Page 9/12Figure 2
Monthly incidence of STI since January 2020 by sex
Page 10/12Figure 3
Monthly incidence of STI since January 2020 by type.
Page 11/12Figure 4
Monthly incidence of STI since January 2020 by socio-economic status and rurality
Supplementary Files
This is a list of supplementary files associated with this preprint. Click to download.
Supplementarymaterial1.docx
Page 12/12You can also read