Comparing different approaches for operationalizing subjective cognitive decline: impact on syndromic and biomarker profiles - Nature
←
→
Page content transcription
If your browser does not render page correctly, please read the page content below
www.nature.com/scientificreports
OPEN Comparing different approaches
for operationalizing subjective
cognitive decline: impact
on syndromic and biomarker
profiles
Patricia Diaz‑Galvan1,2, Daniel Ferreira1,2*, Nira Cedres2, Farshad Falahati2,
Juan Andrés Hernández‑Cabrera1, David Ames3,4, Jose Barroso1 & Eric Westman2,5
Subjective cognitive decline (SCD) has been proposed as a risk factor for future cognitive decline
and dementia. Given the heterogeneity of SCD and the lack of consensus about how to classify this
condition, different operationalization approaches still need to be compared. In this study, we used
the same sample of individuals to compare different SCD operationalization approaches. We included
399 cognitively healthy individuals from a community-based cohort. SCD was assessed through
nine questions about memory and non-memory subjective complaints. We applied four approaches
to operationalize SCD: two hypothesis-driven approaches and two data-driven approaches. We
characterized the resulting groups from each operationalization approach using multivariate methods
on comprehensive demographic, clinical, cognitive, and neuroimaging data. We identified two main
phenotypes: an amnestic phenotype characterized by an Alzheimer’s Disease (AD) signature pattern
of brain atrophy; and an anomic phenotype, which was mainly related to cerebrovascular pathology.
Furthermore, language complaints other than naming helped to identify a subgroup with subclinical
cognitive impairment and difficulties in activities of daily living. This subgroup also showed an AD
signature pattern of atrophy. The identification of SCD phenotypes, characterized by different
syndromic and biomarker profiles, varies depending on the operationalization approach used. In this
study we discuss how these findings may be used in clinical practice and research.
In 2014, the subjective cognitive decline initiative (SCD-I) published a research framework for SCD as a risk
factor for mild cognitive impairment (MCI) and Alzheimer’s disease (AD)1. However, SCD is an heterogene-
isease2. Despite intense
ous clinical condition that can be related to other pathologies such as cerebrovascular d
research, the field still lacks data on which is the best way to operationalize SCD, and the SCD-I has recently
called for studies that compare different operationalization approaches of S CD3.
Since SCD is postulated as the pre-MCI stage4, hypothesis-driven approaches based on well-established MCI
criteria could be useful to operationalize SCD. Alternatively, data-driven approaches may also be of interest. An
option is operationalizing SCD subtypes based on the frequency and distribution of cognitive complaints. For
instance, memory and word-finding complaints are frequently r eported5–7. Other options are methodologically
more complex. An example is the study by Amariglio et al.8, in which the authors applied regression models to
identify the specific complaints associated with lower cognitive performance on cross-sectional data.
Reaching a consensus on how to operationalize SCD is important because different operationalization
approaches may provide groups with different syndromic and biomarker profiles9. To our knowledge, there are
1
Department of Clinical Psychology, Psychobiology, and Methodology, Faculty of Psychology and Speech Therapy,
University of La Laguna, La Laguna, Tenerife, Spain. 2Division of Clinical Geriatrics, Center for Alzheimer Research,
Department of Neurobiology, Care Sciences and Society, Karolinska Institutet, Stockholm, Sweden. 3Academic
Unit for Psychiatry of Old Age (St. Vincent’s Health), University of Melbourne, Kew, VIC, Australia. 4National
Ageing Research Institute, Parkville, VIC, Australia. 5Department of Neuroimaging, Center for Neuroimaging
Sciences, Institute of Psychiatry, Psychology and Neuroscience, King’s College London, London, UK. *email:
daniel.ferreira.padilla@ki.se
Scientific Reports | (2021) 11:4356 | https://doi.org/10.1038/s41598-021-83428-1 1
Vol.:(0123456789)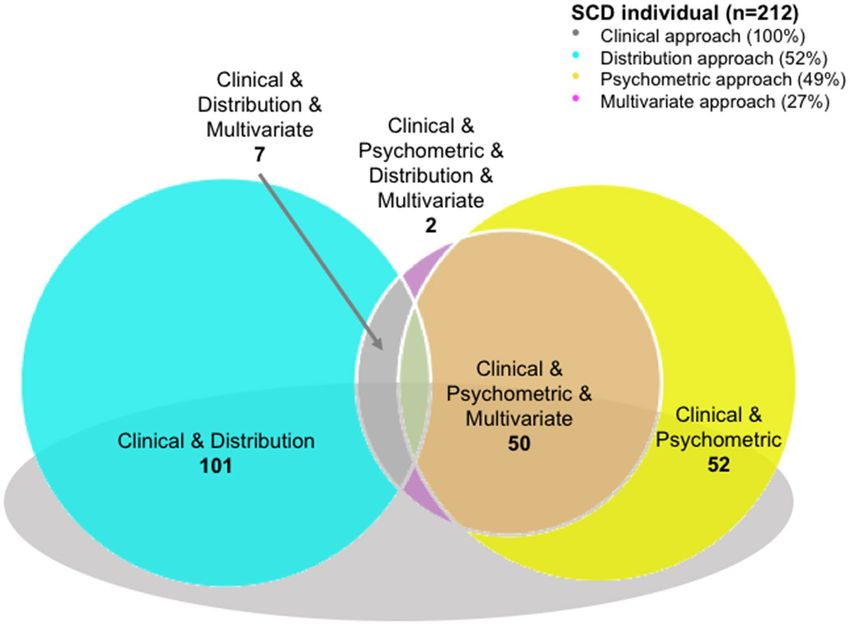
www.nature.com/scientificreports/
Cognitive domain Question
Orientation 1. Do you find it harder to orient yourself in time or space?
Memory 2. Do you have memory problems?
Visuoperception 3. Do you find it harder to recognize familiar faces or people you do not see often?
Executive functions 4. Do you find it harder to manage money or do mental arithmetic?
5. Do you find it hard to find words?
6. Do you have any problems with reading?
Language 7. Do you have any problems with writing?
8. Have you noticed whether you speak less or worse lately?
9. Do you find it harder to follow a conversation? Do you find it harder to understand what people say to you?
Table 1. Questions to assess subjective cognitive complaints in the GENIC cohort. The questions refer to
changes in approximately the last six months and are coded as 0 (absence of complaint) or 1 (presence of
complaint). We calculated the total amount of complaints by adding the scores for each question, ranging from
0 (no complaints) to 9 (maximum number of complaints).
no studies comparing different operationalization approaches in the same sample of SCD individuals. Hence, our
aims were to: (1) apply four different SCD operationalization approaches in the same sample; (2) describe the
frequency of subtypes resulting from the different operationalization approaches; (3) compare the approaches
and subtypes in terms of cognitive, clinical, and structural magnetic resonance imaging (sMRI) biomarker pro-
files. We hypothesized that memory and word-finding complaints would be frequently reported, hence subtypes
based on memory and word-finding complaints would have a high frequency. Although objective cognitive
impairment was not expected, congruent with the definition of SCD, we anticipated lower cognition (subclini-
cal impairment) and abnormal sMRI biomarkers in SCD individuals, with different profiles depending on the
operationalization approach. Reaching a definitive answer on which is the best operationalization of SCD may
only be achieved by large multi-center studies investigating different cohorts and using various instruments for
measuring subjective complaints. We thus consider our current study as a first step towards providing preliminary
data and methodological examples that may guide and encourage future studies in this area.
Methods
Participants. A total of 399 individuals from the GENIC-database10, 11 were included in this study. The
GENIC is a prospective community-based study from the Canary Islands, Spain. Details on this cohort are
provided in previous publications11. Briefly, recruitment was carried out through primary care health centers,
advertisements in local schools, and relatives and acquaintances of the research staff. For the current study,
individuals were selected according to the basic criteria from the research framework for SCD1: (a) normal age-,
gender-, and education-adjusted performance on extensive neuropsychological testing according to clinical nor-
mative data; (b) normal performance in activities of daily living and global cognition defined in this study by a
score ≤ 4 on the Blessed Dementia Rating Scale (BDRS)12, a score ≤ 5 on the Functional Activity Questionnaire
(FAQ)13, and a score ≥ 26 on the Mini-Mental State Examination (MMSE)14; (c) absence of MCI or dementia; (d)
and absence of past or present psychiatric or neurologic diseases, medical disorders, substance abuse, or use of
medications that might explain the presence of subjective cognitive complaints.
This study was approved by the Ethical Committee on Research and Animal Welfare from the University
of La Laguna, Spain. Each participant provided written informed consent and completed the same experiment
protocol in accordance to the Declaration of Helsinki.
Subjective cognitive complaints. Subjective complaints were assessed through nine yes/no-type ques-
tions covering the following cognitive domains: memory, orientation, executive functions, face recognition, lan-
guage production, language comprehension, word-finding, reading, and writing (Table 1).
In a simplified manner, these nine questions cover the five cognitive domains included in validated scales
such as Everyday Cognition (ECog)15 . Furthermore, these nine questions also extend the domains covered by
the only questionnaire validated in Spanish, i.e., Subjective Cognitive Decline-Questionnaire (SCD-Q)16. Item-
by-item correspondence among these three methods can be seen in Table 2. Of note, both ECog and SCD-Q
are endorsed by the SCD-I, and ECog is the most commonly used scale among the participating studies of the
world-leading SCD i nitiative5. Answers were referred to cognitive changes observed during approximately the
last six months. Each answer was scored as one (presence) or zero (absence). A total score was computed by
adding up all the scores for each complaint, giving a continuous variable ranging from 0 to 9, where higher scores
indicate greater number of complaints.
SCD operationalization approaches. Individuals were classified as healthy controls (HC) if they did not
endorse any subjective cognitive complaint, or as SCD if they endorsed one or more complaints. We applied four
operationalization approaches on the SCD individuals as follows:
1. A hypothesis-driven approach based on Winblad’s criteria for MCI (from here, Clinical approach)17. The
so-called Winblad’s criteria rely on a clinical judgment for determining cognitive impairment in MCI and
include four subtypes: amnestic single or multiple domain and non-amnestic single or multiple d omain17.
Scientific Reports | (2021) 11:4356 | https://doi.org/10.1038/s41598-021-83428-1 2
Vol:.(1234567890)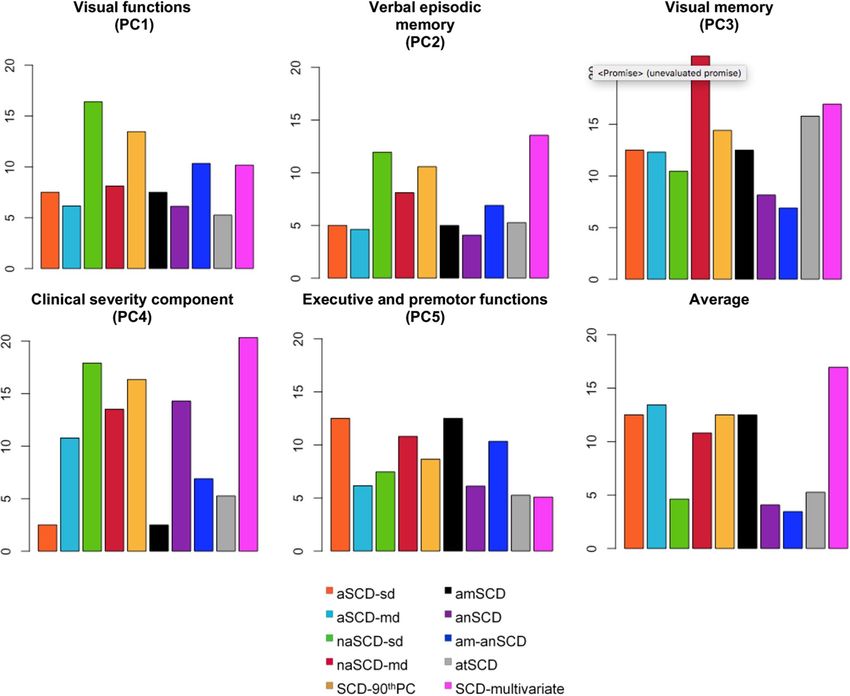
www.nature.com/scientificreports/
GENIC Ecog SCD-Q (MyCog)
Orientation
Following a map to find a new location
Reading a map and helping with directions when someone
else is driving
Finding his/her car in a parking lot
1. Do you find it harder to orient yourself in time or space? Finding the way back to a meeting spot in the shopping NON ASSESED
mall or other location
Finding his/her way around a familiar neighborhood
Finding his/her way around a familiar store
Finding his/her way around a house visited many times
Memory
I’m worse at recalling the details of a recent family event
I find it harder to remember the result of a recent sporting
Remembering a few shopping items without a list
event
Remembering things that happened recently (such as
I find it harder to remember the details of a conversation
recent outings, events in the news)
2. Do you have any memory problems (do you find it I find it harder to remember things without using strategies
Recalling conversations a few days later
harder to remember what you have read, where you have (lists, diary, etc.)
Remembering where she/he has placed objects
placed objects, important appointments, what you wanted I find it harder to remember the details of recent new
Repeating stories and/or questions
to do, what you did yesterday)? I find it harder to remember famous people’s names
Remembering the current date or day of the week
I find it harder to remember the names of people I’ve met
Remembering he/she has already told someone something
recently
Remembering appointments, meetings, or engagements
I find it harder to remember street and city names
- I find it harder to describe the plots of films
Visuoperception
3. Do you find it harder to recognize familiar faces or
NON ASSESED NON ASSESED
people you do not see often?
Attention / Executive Functions
The ability to do two things at once
I find it harder to learn new telephone numbers
Returning to a task after being interrupted
I find it harder to find personal possessions (keys, tel-
The ability to concentrate on a task without being dis-
ephone, utensils, etc.)
tracted by external things in the environment
I find it harder to remember doctor’s appointments
Cooking or working and talking at the same time
I find it harder to concentrate on what I am doing
Planning the sequence of stops on a shopping trip
I find it harder to remember the names of places I’ve visited
The ability to anticipate weather changes and plan accord-
recently
ingly
I’m worse at planning things that aren’t part of my daily
4. Do you find it harder to manage money or do mental Developing a schedule in advance of anticipated events
routine (travel, excursions, etc.)
arithmetic? Thinking ahead
I find it harder to use electronic devices
Thinking things through before acting
I find it harder to start new or different things
Keeping living and work space organized
Finds it harder to start conversations
Balancing the checkbook without error
I find it harder to do mental arithmetic
Keeping financial records organized
I find it harder to do more than one thing at once without
Prioritizing tasks by importance
getting agitated
Using an organized strategy to manage a medication
I find it harder to remember sums of money (payments or
schedule
debts)
Keeping mail and papers organized
Language
Verbally giving instructions to others
Following a story in a book
5. Do you find it harder to find words? Understanding the point of what other people are trying
I find it harder to follow the plot of a book
6. Do you have any problems with reading? to say
I’m worse at finding the word I want to use in a conversa-
7. Do you have any problems with writing? Describing a program he/she has watched on television
tion
8. Have you noticed whether you speak less or worse lately? Understanding spoken directions or instructions
I find it harder to understand things the first time someone
9. Do you find it harder to follow a conversation? Do you Forgetting the names of objects
says them
find it harder to understand what people say to you? Finding the right words to use in a conversation
Remembering the meaning of common words
Communicating thoughts in a conversation
Table 2. Item-by-item cognitive domain correspondence among GENIC, eCog, and MyCog Questionnaires
for SCD.
We identified the same cognitive subtypes on SCD individuals based on the type of subjective complaint
instead of on actual objective impairment. This approach gave four SCD subtypes depending on whether
individuals reported a complaint in memory alone (amnestic single-domain SCD, aSCD-sd); in memory and
other cognitive domains (amnestic multiple-domains SCD, aSCD-md); in a cognitive domain alone other
than memory (non-amnestic single-domain SCD, naSCD-sd); or more than one cognitive domain other than
memory (non-amnestic multiple-domains SCD, naSCD-md).
2. A hypothesis-driven approach based on the MCI criteria from Mayo Clinic (US), which puts greater emphasis
on the -1.5 SD criterion to define cognitive impairment (from here, Psychometric approach)18. These criteria
were adjusted to SCD by requiring a total number of complaints. Since the total number of complaints vari-
able was not normally distributed (Fig. 1A), we chose the 90th percentile instead of the -1.5 SD to determine
the cut-off for SCD, as suggested e lsewhere19.
3. A data-driven approach based on the frequency and distribution of subjective cognitive complaints observed
in the sample (from here, Distribution approach). We explored the frequencies of the different cognitive
complaints when they were reported alone or in combination with the other complaints. For that, we divided
the variable ‘number of complaints’ into quartiles; then, we investigated the distribution of the different
Scientific Reports | (2021) 11:4356 | https://doi.org/10.1038/s41598-021-83428-1 3
Vol.:(0123456789)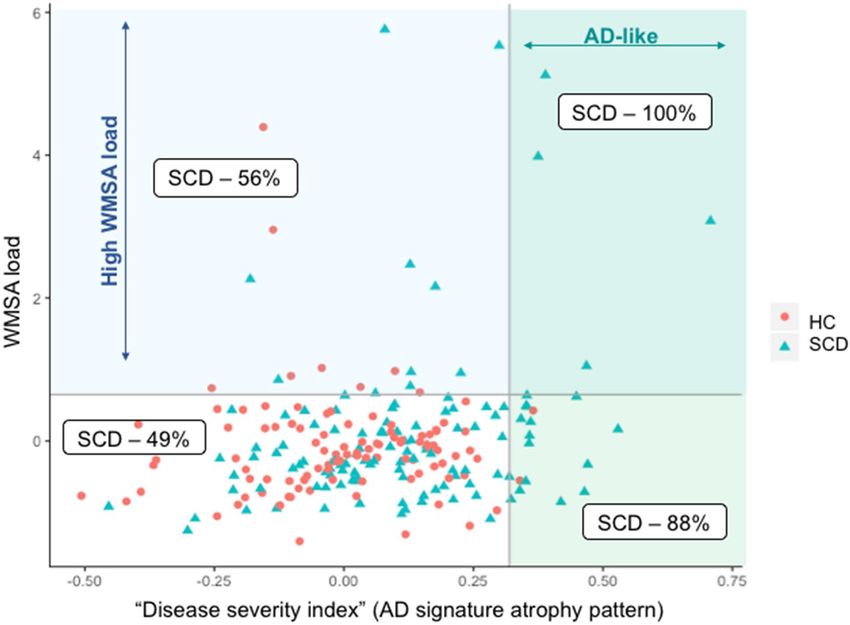
www.nature.com/scientificreports/
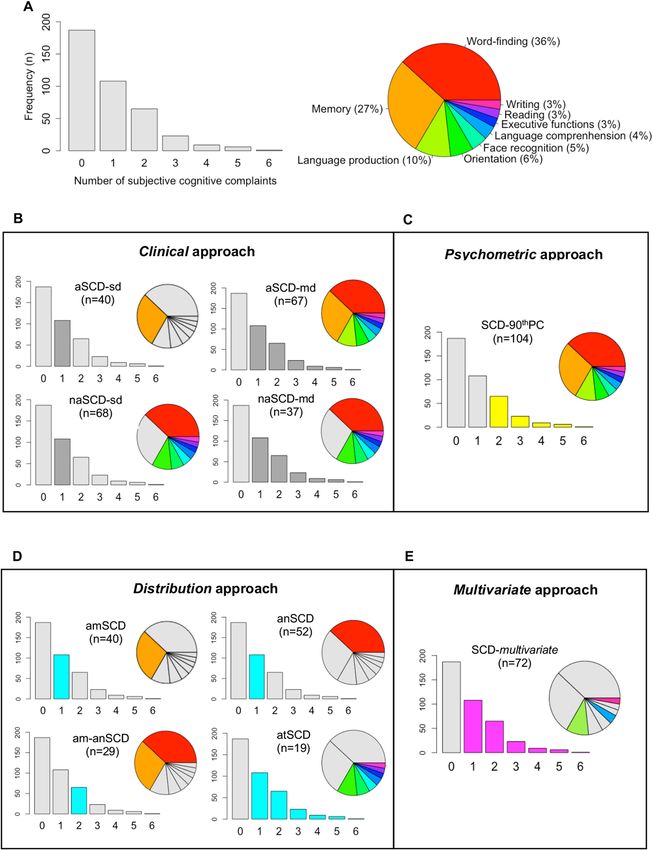
Figure 1. Overview of subjective cognitive complaints and SCD groups in the GENIC cohort. (a) Frequency of
subjective cognitive complaints. (b–e) Overview of the SCD groups according to the four operationalization approaches.
All the bar charts show number of subjective cognitive complaints in the x-axis and the frequency (n) in the y-axis. HC,
healthy controls; aSCD-sd = amnestic Subjective Cognitive Decline—single domain; aSCD-md, amnestic Subjective
Cognitive Decline—multiple domain; naSCD-sd, non-amnestic Subjective Cognitive Decline—single domain;
naSCD-md, non-amnestic Subjective Cognitive Decline—multiple domain; SCD-90thPC, Subjective Cognitive Decline
defined by the presence of two or more cognitive complaints, corresponding to the 90thPC of the total number of
complaints variables; anSCD, anomic Subjective Cognitive Decline; amSCD, amnestic Subjective Cognitive Decline;
am-anSCD, amnestic and anomic Subjective Cognitive Decline; atSCD, atypical Subjective Cognitive Decline; SCD-
multivariate, Subjective Cognitive Decline defined by the presence of language production, language comprehension
and/or writing complaint alone or in combination with other complaints.
Scientific Reports | (2021) 11:4356 | https://doi.org/10.1038/s41598-021-83428-1 4
Vol:.(1234567890)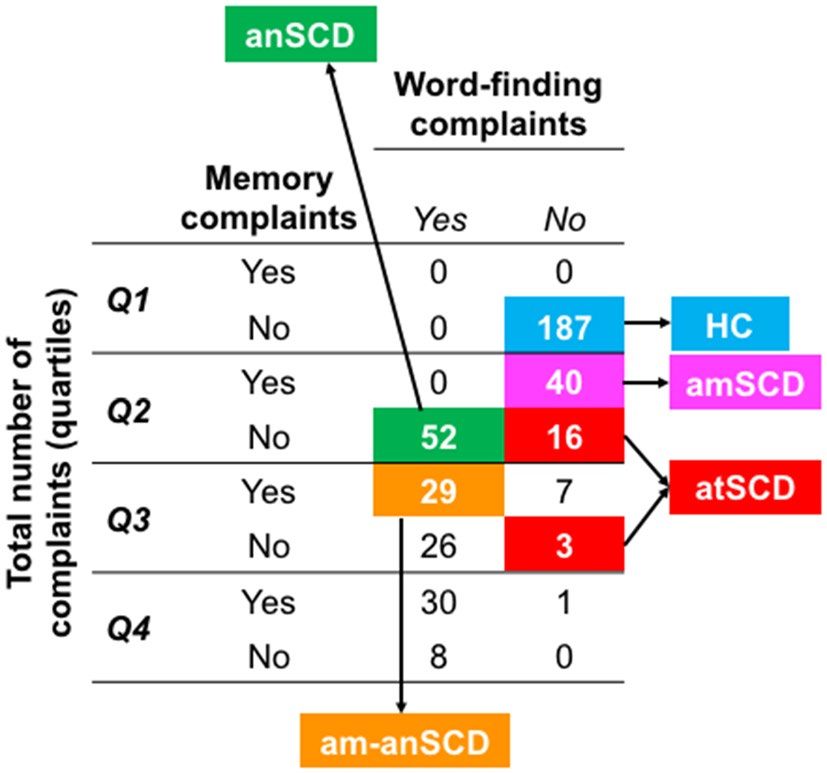
www.nature.com/scientificreports/
complaints within each quartile in order to identify the SCD groups. We elaborate more on this approach in
the results section: we describe the procedure that uncovered which specific complaints define the different
SCD subtypes in our cohort; we also explain how individuals were assigned to the resulting subgroups.
4. A data-driven approach using multivariate data analysis (from here, Multivariate approach). Amariglio et al.8
applied predictive models to identify which complaints were associated with lower cognitive performance in
cross-sectional data from a large community-based cohort. The authors reported that the complaint of “get-
ting lost” was strongly associated with lower cognitive performance. Inspired by this study, we also applied
a predictive model to identify which complaints were associated with lower cognitive performance in our
cross-sectional data. To increase the sensitivity of this approach towards early stages of neurodegenera-
tive diseases, we aimed to identify complaints predicting lower performance in cognitive variables that are
strongly associated with measures of activities of daily living (ADL). The reason behind this decision was
to capture subclinical levels of impairment in cognition and ADL, which often prelude progression to MCI
and dementia (stage III of preclinical AD)1. We applied a principal component analysis (PCA) on 67 cogni-
tive variables and 4 ADL measures. The dimension that clustered cognitive measures together with the ADL
measures was defined as our dimension of interest. We then conducted a predictive model (random forest
regression model) to identify which complaints predicted such clinical-cognitive dimension of interest. We
finally created the corresponding SCD group based on the identified complaints. Complementary, the PCA
also reduced the dimensionality of the cognitive and clinical data (71 variables). The resulting components
were used for further representation of certain results.
Demographic, clinical, and cognitive variables. Age and sex were included as demographic variables.
We used the Information subtest from the Wechsler Adult Intelligence Scale—Third edition (WAIS-III) as an
estimation of crystallized intelligence/education11,20. Clinical measures included information on ADL from both
FAQ13 and BDRS12 (total score as well as scores from the three BDRS subscales: 1) changes in performance on
everyday activities, 2) habits, and 3) personality, interest, and drive). Depressive symptomatology was assessed
with the Beck Depression Scale (BDI)21 in individuals below 63 years of age, and the Geriatric Depression Scale
(GDS)22 in individuals 63 years old or older. Z-scores from both scales were calculated and combined together in
order to have a single measure of depressive symptomatology23. We highlight that none of the participants in this
study had a clinical diagnosis of depression or were taking antidepressant medication, and scores in these scales
were within the normal range. We applied a comprehensive neuropsychological protocol including tests for
processing speed, attention, executive functions, premotor functions, memory, visuoconstructive, visuopercep-
tive, and visuospatial functions, and language functions. The neuropsychological protocol includes 67 cognitive
variables and is fully detailed in previous publications24.
Magnetic resonance imaging (MRI) data acquisition and processing. Participants were scanned
using a 3.0 T General Electric imaging system (Milwaukee, United States). A three-dimensional T1-weighted
fast spoiled gradient echo (FSPGR) sequence was acquired in sagittal plane (repetition time/echo time/inver-
sion time = 8.73/1.74/650 ms, field of view = 250 × 250 mm, matrix = 250 × 250 mm, flip angle = 12°, slice thick-
ness = 1 mm).
The T1-weighted images were processed with FreeSurfer 5.1.0 (http://surfer.nmr.mgh.harvard.edu/) through
our database system (theHiveDB)25 as detailed elsewhere26. Careful visual quality control was performed on both
the original and the processed data, and manual edits were done when appropriate to ensure optimal output.
Measures of thickness were calculated for 34 cortical regions from both hemispheres27, and measures of volume
for 21 subcortical regions28. A measurement of total intracranial volume (ICV) was also estimated with FreeSurfer
in order to account for individual differences in brain size on all the volumetric measures29.
MRI biomarkers of AD and cerebrovascular disease. Previous research has linked SCD with AD
and cerebrovascular disease1,2,30,31. AD-related neurodegeneration and cerebrovascular disease can be assessed
in vivo with structural MRI. In the current study, we investigated how different SCD operationalization
approaches may relate to sMRI biomarkers of AD-related neurodegeneration and cerebrovascular disease. A
novel sMRI biomarker of AD is the “disease severity index”, which captures the AD signature atrophy pattern
in SCD individuals30. This index is strongly associated with increased amyloid burden and higher risk of pro-
gression to MCI or d ementia31. A common sMRI biomarker of cerebrovascular disease is white matter signal
abnormalities (WMSA)32,33. Both methods are explained below.
The AD signature atrophy pattern (“disease severity index”) was calculated as in a previous p ublication31.
Briefly, a classification model was trained on an external database to discriminate between 69 healthy controls
and 39 AD dementia patients from the AIBL cohort (Australian Imaging Biomarkers and Lifestyle flagship study
of ageing)34. The 34 measures of cortical thickness from both hemispheres and the 21 subcortical volumes from
FreeSurfer were used as input data. These data were previously corrected for age and ICV, since both variables
are known to influence brain m orphology29,35. The variance in the sMRI measures related to age and ICV was
estimated and removed from the original data using multiple linear regression. After correcting the data, the
classification model was built using the orthogonal partial least square (OPLS) method included in the software
package SIMCA (Sartorius Stedim AB, Umeå, Sweden). The OPLS method separates the systematic variation in
the data into two blocks: predictive and orthogonal. The first component of the model is predictive and includes
information related to class separation (e.g. AD vs. HC). The orthogonal components in the model, if any, are
related to other variation in the data not related to the actual problem, such as within class variation. Each model
receives an R 2(X), an R
2(Y), and a Q
2(Y) value. R2(X) represents the explained variance between the criterion
variable (Y) and predictor variables (X), for the predicted and the orthogonal components. R2(Y) represents
Scientific Reports | (2021) 11:4356 | https://doi.org/10.1038/s41598-021-83428-1 5
Vol.:(0123456789)www.nature.com/scientificreports/
the goodness of fit of the model and refers to the fraction of the criterion variable (Y) variation modeled in the
component, using the predicted model. Q2(Y) defines how well the model predicts new data. The significance of
a model is based on the Q 2(Y) parameter and is reported as acceptable ( Q2 > 0.1), good (Q2 > 0.5), and optimal
(Q2 > 0.9)36. In the current study, the sevenfold validation method to separate AD patients from HC achieved
an R2(X) value of 0.171, an R 2(Y) value of 0.848, and a Q
2(Y) value of 0.700, indicating a high performance to
discriminate between the HC and AD groups. The brain regions that contributed the most to this model were
the hippocampal volume, the precuneus, the right supramarginal gyrus, and the inferior parietal gyrus, all of
them displaying reduced values in the AD group. The inferior part of the lateral ventricles was also important,
displaying larger volume in the AD group, as in previous p ublications31. Afterwards, age- and ICV-corrected
values of the same cortical and subcortical sMRI variables from the GENIC individuals were projected onto
this classification model as unseen data. By doing this, all the GENIC individuals receive a score for the “disease
severity index”. This score reflects the AD signature atrophy pattern and ranges from 0 to 1. Values close to 0 are
indicative of a HC-like pattern, and values close to 1 reflect an AD-like pattern of brain atrophy. This index can
be used either as a continuous variable, or as a dichotomous variable by applying a threshold.
The WMSA volume was calculated on T1-weighted images using FreeSurfer, subsequently extended to label
white matter lesions28. WMSA is an indicator of underlying cerebrovascular disease. This procedure has dem-
onstrated sensitivity in measuring white matter damage in both healthy and SCD individuals, as well as in
patients with AD23,37,38. The T1-weighted WMSA volume from FreeSurfer is correlated with hyperintensity
volume measured on T2/FLAIR, as well as with microstructural white matter changes as measured on diffusion
tensor imaging d ata10,38,39.
Statistical analysis. Two per cent of the values were missing across all cognitive variables and were thus
imputed for subsequent analyses. Random forest analyses (5000 trees) were conducted to characterize the SCD
groups against the HC across multiple variables (classification models) or to investigate the association between
multiple predictors and an outcome variable (regression models), while avoiding multiple testing. In random
forest models, the contribution of the predictors in the models is reported as Imp (importance), which reflects
the relative error in prediction when a predictor is excluded from the model. Pearson, point-biserial, and par-
tial correlations were performed to study relationships between variables. ANOVA/ANCOVA, Mann–Whitney,
and Kruskal Wallis tests were conducted to investigate between-group differences in continuous variables and
the Chi-square test was used for categorical variables. Posthoc analyses were conducted in ANOVA/ANCOVA
for the sMRI variables using the Hochberg correction for multiple c omparisons40. Principal component analy-
sis (PCA) was conducted on the 67 cognitive variables and 4 ADL variables for reducing data dimensionality
and identifying a clinical-cognitive dimension of interest as explained above in the “SCD operationalization
approaches” section. The components from this PCA were also used for investigating borderline cognitive per-
formance in a reduced set of cognitive variables. Borderline cognitive performance was defined as a score below
the 10th percentile on the cognitive components after adjusting for age, sex, and crystallized intelligence/educa-
tion (WAIS-III Information subtest) using multiple linear regression analysis. A p value ≤ 0.05 (two-tailed) was
deemed significant in all these analyses.
Results
Frequency of subjective cognitive complaints and SCD groups. Overall, 53.1% of the individuals
(n = 212) reported at least one complaint. Word-finding (36%, n = 145) and memory (27%, n = 107) were the
most frequent complaints (Fig. 1A). Table 3 shows the main demographic and clinical characteristics of the
different SCD groups by operationalization approach. Additionally, the association of each cognitive complaint
with demographic, clinical, cognitive, and MRI data are displayed on the supplementary Table S1.
1. Clinical approach (Table 3, Fig. 1B): the naSCD-sd (17%) and aSCD-md (17%) subtypes were significantly
larger than the aSCD-sd (10%) and naSCD-md (9%) subtypes (p = 0.001).
2. Psychometric approach (Table 3, Fig. 1C): since the total number of complaints variable was not normally
distributed, the 90th percentile was chosen instead of the -1.5 SD to determine the cut-off for SCD, as sug-
gested elsewhere19.
3. Distribution approach (Table 3, Fig. 1D): Firstly, the variable ‘number of complaints’ was divided into quar-
tiles. We observed that each quartile corresponded to zero (Q1), one (Q2), two (Q3), and three or more (Q4)
cognitive complaints. Secondly, we scrutinized the distribution of complaints within each quartile. Since
memory and word-finding complaints were the most frequently reported complaints, both dominated Q2,
Q3, and Q4, either alone or in combination with other complaints. Therefore, for simplicity, we only illus-
trated the distribution of these two most common complaints. Based on this finding, four subtypes could be
ascertained: amnestic SCD (amSCD; individuals with a complaint limited to memory); anomic SCD (anSCD;
individuals with a complaint limited to word-finding); amnestic and anomic SCD (am-anSCD; individuals
with two complaints limited to memory and word-finding); and atypical SCD (atSCD; individuals with
one or more complaints in any cognitive domain other than memory or word-finding). Figure 2 shows the
quartiles and the distribution of memory and word-finding complaints. The anSCD (16%) and amSCD (12%)
subtypes were significantly larger than the atSCD (6%) subtype. The anSCD subtype was also larger than the
am-anSCD subtype (9%) (p < 0.001).
4. Multivariate approach (Table 3, Fig. 1E): The PCA gave 5 components ( R2 = 0.49). Components #1, #2, and
#5 each explained 12% of the variance, and included variables related to visual functions, verbal episodic
memory, and executive and premotor functions, respectively. Component #3 explained 8% of the variance
and included variables related to visual memory. Component #4 explained 5% of the variance and clustered
Scientific Reports | (2021) 11:4356 | https://doi.org/10.1038/s41598-021-83428-1 6
Vol:.(1234567890)www.nature.com/scientificreports/
Psychometric Multivariate
Clinical approach approach Distribution approach approach
SCD- SCD-
HC aSCD-sd aSCD-md naSCD-sd naSCD-md p 90thPC p amSCD anSCD am-anSCD atSCD p multivariate p
Count, 187 40 67 68 37 104 40 52 29 19 59
< 0.001 − < 0.001 -
n (%)a (47) (10) (17) (17) (9) (26) (12) (16) (9) (6) (14)
55.66 57.38 61.63 59.28 63.73 62.37 57.38 60.02 58.59 57.05 61.93
Age, y < 0.001 < 0.001 0.087 < 0.001
(11.3) (11.5) (11.9) (10.7)b (9.8) (11.2) (11.5) (10.4) (10.6) (12.0) (11.9)
Sex, %
47 60 60 60 70 < 0.001 63 < 0.001 60 60 55 63 < 0.001 67 < 0.001
females
WAIS-
III
16.27 14.73 14.76 14.92 15.54 15.04 14.73 15.14 16.35 13.84 14.49
Infor- 0.296 0.111 0.294 0.060
(6.3) (6.1) (6.3) (5.9) (6.3) (6.3) (6.1) (5.7) (6.3) (12.0) (6.3)
mation
subtest
28.73 28.95 28.40 28.68 28.57 28.46 28.95 28.61 26.90 28.89 28.43
MMSE 0.227 0.030 0.686 0.011
(1.3) (1.2) (1.2) (1.2) (1.2) (1.2) (1.2) (1.2) (0.9) (1.2) (1.3)
0.28 0.30 0.58 0.31 0.30 0.28 0.30 0.32 0.14 0.42 0.54
FAQ 0.068 0.092 0.849 0.024
(0.7) (0.6) (1.1) (0.7) (0.7) (1.0) (0.6) (0.7) (0.4) (0.1) (1.0)
0.43 0.51 1.03 0.65 0.92 0.99 0.51 0.66 0.62 0.84 1.09
BDRS < 0.001 < 0.001 0.098 < 0.001
(0.8) (0.8) (1.1)b (0.9) (1.1)b (1.1) (0.8) (0.9) (1.0) (1.0) (1.1)
Depres- −0.54 −0.10 0.34 0.34 −0.10 -0.10 -0.10
−0.10 0.34 0.34 0.34
sive (−1.3– (−1.3– (−1.0– < 0.001 (−1.0– < 0.001 (−1.3– (-1.3– (-1.0– < 0.001 < 0.001
(−1.3–3.0)b (−1.0–3.9)b (-0.8–2.1)b (-1.0–3.9)
sympt 3.0) 2.1)b 3.9)b 3.9) 2.1)b 3.0)b 3.5)b
AD sig-
nature −0.01 0.14 0.06 0.14 0.11 0.07 0.14 0.11 0.04 0.23 0.12
< 0.001 0.016 < 0.001 < 0.001
atrophy, (0.2) (0.2)b (0.2)b (0.2) (0.2)b (0.2) (0.2)b (0.2) (0.2) (0.2)b (0.2)
(0–1)c,d
AD sig-
nature
atrophy, 2 33 13 6 21 − 12 − 33 9 6 23 - 15 -
% AD-
likec,d
2621.3 2820.8 3005.2 3185.1 2852.8 2949.5 2820.8 3070.6 3023.0 3498.6 2874.2
WMSAc 0.486 0.354 0.289 0.456
(1207.0) (982.9) (2083.1)b (2011.1) (2151.9) (2088.7) (982.9) (1913.5)e (2353.9) (2220.6) (1580.9)
Table 3. Characteristics of the SCD groups and healthy controls. Values are reported as mean (SD) except
for depressive symptomatology, where median (minimum and maximum values) are reported. All the
analyses in this table were conducted to compare SCD groups versus HC, except for Chi-squared analyses
in Count and Sex variables. aThe χ2 test was used for investigating between-group differences among the
SCD subtypes within the Clinical and Distribution approaches (HC not included in these analyses. Post-hoc
contrasts—naSCD-sd vs. aSCD-sd: χ2(1) = 7.26, p = 0.007; naSCD-sd vs. naSCD-md: χ2(1) = 9.15, p = 0.002;
aSCD-md vs. aSCD-sd: χ2(1) = 6.81, p = 0.009; aSCD-md vs. naSCD-md: χ2(1) = 8.65, p = 0.003; anSCD vs.
am-anSCD: χ2(1) = 6.53, p = 0.011; anSCD vs. atSCD: χ2(1) = 15.34, p < 0.001; amSCD vs- at SCD: χ2(1) = 7.47,
p = 0.006.bSignificant differences with HC cn = 220. dAD signature atrophy pattern determined by the predictive
OPLS index which range from 0 (HC-like pattern of atrophy) to 1 (AD-like pattern of atrophy). Individuals
were classified as AD-like when they obtained abnormal values in this index, corresponding to 0.32 according
to the 90thPC. eA trend for a significant WMSA increase was observed for the anSCD subtype (p = .074).
HC healthy controls, SCD Subjective Cognitive Decline, aSCD-sd amnestic Subjective Cognitive Decline-
single domain, aSCD-md amnestic Subjective Cognitive Decline-multiple domain, naSCD-sd non-amnestic
Subjective Cognitive Decline-single domain, naSCD-md non-amnestic Subjective Cognitive Decline-multiple
domain, SCD-90thPC Subjective Cognitive Decline defined by the presence of two or more cognitive
complaints, corresponding to the 90th PC of the total amount of cognitive complaints variable, anSCD anomic
Subjective Cognitive Decline, amSCD amnestic Subjective Cognitive Decline, am-anSCD amnestic and anomic
Subjective Cognitive Decline, atSCD atypical Subjective Cognitive Decline, SCD-multivariate Subjective
Cognitive Decline defined by the presence of language production, language comprehension and/or writing
complaints, alone or in combination with other complaints, WAIS-III Wechsler Adult Intelligence Scale-
3rd Edition, MMSE Mini Mental State Examination, FAQ Functional Activity Questionnaire, BDRS Blessed
Dementia Rating Scale, sMRI structural Magnetic Resonance Imaging, AD Alzheimer’s disease, WMSA white
matter signal abnormalities.
the ADL measures (i.e. FAQ and BDRS ‘changes in daily life activities’ subscale) together with several cogni-
tive variables, including episodic memory, semantic fluency, and visual discrimination. Thus, component
#4 was labeled as the ‘clinical severity component’ and it was considered as our component of interest for
subsequent analyses in this approach. Lower scores in this component #4 indicates worse clinical and cogni-
tive status. We then predicted component #4 by the nine different complaints as well as age, sex, WAIS-III
Information subtest, and depressive symptomatology in a random forest model (regression). Component #4
was mainly predicted ( R2 = 0.08) by the score on WAIS-III Information subtest (Imp = 0.13), the writing com-
plaint (Imp = 0.05), and sex (Imp = 0.04). The language production complaint and language comprehension
complaint marginally contributed to the prediction of component #4 (Imp < 0.01). Worse clinical-cognitive
Scientific Reports | (2021) 11:4356 | https://doi.org/10.1038/s41598-021-83428-1 7
Vol.:(0123456789)www.nature.com/scientificreports/
Figure 2. Identification of SCD subtypes in the Distribution approach. Cross-table of frequencies between
each quartile of the variable ‘total number of complaints’ and the variables of ‘memory’ and ‘word-finding’
complaints. anSCD, anomic Subjective Cognitive Decline; amSCD, amnestic Subjective Cognitive Decline;
am-anSCD, amnestic and anomic Subjective Cognitive Decline; atSCD, atypical Subjective Cognitive Decline.
status as reflected by component #4 was associated with a lower score in WAIS-III Information (r = 0.28),
the presence of complaints on writing (rpb = -0.23), language production (rpb = -0.03) and language compre-
Figure 3. Overlap between the four SCD operationalization approaches. Percentage values indicate the
frequency of individuals with subjective complaints classified as SCD by the different approaches and their
combination.
hension (rpb = -0.10), as well as female sex (rpb = -0.04). Based on these results, individuals with a complaint
either in writing, language comprehension, or language production, were classified as the SCD-multivariate
group (14%), independently of whether those individuals also endorsed complaints in other domains.
Scientific Reports | (2021) 11:4356 | https://doi.org/10.1038/s41598-021-83428-1 8
Vol:.(1234567890)www.nature.com/scientificreports/
(A) Classifications models for demographic, clinical and cognitive variables
Model 1 Model 3
Clinical Model 2 Distribution Model 4
approach Psychometric approach approach Multivariate approach
Depression
Depression VR Delayed recall Depression
VR Delayed Recall
VR Delayed Recall Depression Age
Age
PCV Motor reaction time PCV Motor recation time VR Delayed Recall
Stroop 2 sheet
Age Age Stroop 1 Sheet
Luria’s—Left alternative move-
Stroop 1 Sheet Stroop 1 sheet AVLT-Learning Trial
ment
N = 399 N = 291 N = 327 N = 246
Error by chance = 80% Error by chance = 50% Error by chance = 80% Error by chance = 50%
Classification error: Classification error:
HC (n = 187): 5.4% HC (n = 187): 0%
Classification error: Classification error:
aSCD-sd (n = 40): 100% amSCD (n = 40): 100%
HC (n = 187): 14.1% HC (n = 187): 2.2%
aSCD-md (n = 67): 77.6% anSCD (n = 52): 100%
SCD-90thPC (n = 104): 56.7% SCD-multivariate (n = 59): 71.2%
naSCD-sd (n = 68): 100% am-anSCD (n = 29): 100%
naSCD-md (n = 37): 100% atSCD (n = 19): 100%
(B) Regression models for the AD signature atrophy pattern and the WMSA load
Model 1 Model 2
AD signature atrophy (R2 = 0.1) WMSA load (R2 = 0.3)
Predictive variables Imp Predictive variables Imp
Sex 27.0 Age 26.0
Memory complaint 17.4 ICV 12.9
Word-finding complaint 15.3 Sex 6.3
Orientation complaint 12.2 Writing complaint 4.6
Reading complaint 5.7 Word–finding complaint 3.8
Facial recognition complaint – Reading complaint –
Language comprenhension
– Memory complaint –
complaint
Language comprenhension
Writing complaint – –
complaint
WAIS-III Information subtest – Orientation complaint –
Language production complaint – WAIS–III Information subtest –
Executive functions complaint – Facial recognition complaint –
Executive function complaint –
Table 4. Random forest results (classification and regression models). In random forest classification
models (A), the five most important variables and a summary of the classificatory performance is reported
for each operationalization approach. The classification error needs to be lower than the expected error by
chance for a model to be reliable. In random forest regression models (B), importance (Imp) is displayed for
those predictive variables that reached values above zero. Age and ICV were included to investigate their
contribution to the prediction of the WMSA load, but not to the prediction of the AD signature atrophy
pattern because this variable was adjusted by age and ICV during the creation of this index. HC healthy
controls, aSCD-sd amnestic Subjective Cognitive Decline-single domain, aSCD-md amnestic Subjective
Cognitive Decline amnestic-multiple domain, naSCD-sd non-amnestic Subjective Cognitive Decline-single
domain, naSCD-md non-amnestic Subjective Cognitive Decline-multiple domain, SCD-90thPC Subjective
Cognitive Decline defined by the presence of two or more cognitive complaints = corresponding to the 90th
PC of the total amount of cognitive complaints variable, anSCD anomic Subjective Cognitive Decline, amSCD
amnestic Subjective Cognitive Decline, am-anSCD amnestic and anomic Subjective Cognitive Decline,
atSCD atypical Subjective Cognitive Decline, SCD-multivariate Subjective Cognitive Decline defined by the
presence of language production = language comprehension and/or writing alone or in combination with
other complaints, AD Alzheimer’s disease, WMSA White Matter Signal Abnormalities, Imp Importance, ICV
intracranial volume, WAIS-III Wechsler Adult Intelligence Scale-3rd Edition.
Figure 3 illustrates the overlap between the four SCD operationalization approaches. The Clinical approach
included all the SCD individuals and overlapped with the other three. Two clusters can be identified going from
higher sensitivity (overlap with the Distribution approach) to higher specificity (overlap with the Psychometric
and Multivariate approaches).
In the Psychometric, Distribution, and Multivariate approaches, 51% (n = 108), 34% (n = 72), and 72% (n = 153)
of the individuals with subjective cognitive complaints were not classified as SCD (nonSCD), respectively. The
characteristics of those nonSCD individuals in each approach are displayed on the supplementary Table S3 and
Figure S1.
Clinical characterization of the SCD groups. The SCD groups were characterized by conducting ran-
dom forest classification models (SCD vs. HC). We included all the demographic, clinical, and cognitive meas-
Scientific Reports | (2021) 11:4356 | https://doi.org/10.1038/s41598-021-83428-1 9
Vol.:(0123456789)www.nature.com/scientificreports/
Figure 4. Cognitive profile of the SCD groups—Borderline performance. Percentage of SCD individuals with
cognitive performance below the 10th percentile is reported for each SCD operationalization approach and
subtype. The y-axis shows the percentage of SCD individuals below the 10th percentile. Higher percentage
indicates that more individuals in a given group have borderline performance. This analysis was conducted only
using SCD data. All the scores were previously adjusted for age, sex, and the WAIS-III Information subtest using
multiple linear regression. The five components obtained in the PCA (Principal Component Analysis) were
selected for this analysis. aSCD-sd, amnestic Subjective Cognitive Decline—single domain; aSCD-md, amnestic
Subjective Cognitive Decline—multiple domain; naSCD-sd, non-amnestic Subjective Cognitive Decline—single
domain; naSCD-md, non-amnestic Subjective Cognitive Decline—multiple domain; SCD-90thPC, Subjective
Cognitive Decline defined by the presence of two or more cognitive complaints, corresponding to the 90thPC
of the total number of complaints variable; anSCD, anomic Subjective Cognitive Decline; amSCD, amnestic
Subjective Cognitive Decline; am-anSCD, amnestic and anomic Subjective Cognitive Decline; atSCD, atypical
Subjective Cognitive Decline; SCD-multivariate, Subjective Cognitive Decline defined by the presence of
language production, language comprehension and/or writing complaints alone or in combination with other
complaints.
ures as predictive variables in the random forest models. The most important variables from each model and
the summary of the results are displayed in Table 4A. All the models provided a classification error greater than
chance, indicating that any combination of the variables was able to discriminate between the SCD subtypes and
HC. Therefore, SCD groups were comparable to the HC group in demographic, clinical, and cognitive variables,
as expected congruent with the definition of SCD (Table 4A). In addition, SCD groups in the Clinical and Distri-
bution approaches were also comparable.
Once demonstrated that there is no objective cognitive impairment in the SCD individuals, we then inves-
tigated borderline performance (SCD individuals falling below the 10th percentile of cognitive performance).
For simplicity, we investigated the five components of the PCA instead of the 67 cognitive variables (Fig. 4).
Visual inspection of Fig. 4 shows that the Multivariate approach identified individuals with worst performance in
verbal episodic memory (PCA2) and, as expected, in component #4 (PCA4). SCD subtypes endorsing memory
Scientific Reports | (2021) 11:4356 | https://doi.org/10.1038/s41598-021-83428-1 10
Vol:.(1234567890)www.nature.com/scientificreports/
Figure 5. AD signature atrophy pattern versus WMSA load. The AD signature atrophy pattern and the WMSA
load are treated as continuous variables in all the analyses in this study. Only for representation purposes in
this figure, both measures were dichotomized to reflect an AD-like pattern of brain atrophy and high load of
WMSA. This was done by using the 90th percentile cut-off as in previous s tudies41. The distribution of SCD
and HC individuals (color legend) was plotted and, for each quadrant, the percentage of SCD individuals is
reported. HC, healthy controls; SCD, subjective cognitive decline; WMSA, white matter signal abnormalities;
AD, Alzheimer’s disease.
complaints (i.e. aSCD-sd, aSCD-md, and amSCD) showed worst performance in executive and premotor func-
tions (PCA5). The naSCD-md subtype (Clinical approach) showed worst performance in visual memory abilities
(PCA3).
AD signature atrophy and WMSA. MRI data were available for 220 participants (55%). Compared with
the HC, all operationalization approaches displayed increased disease severity index, reflecting an AD signature
atrophy (Table 3). Regarding the WMSA (age and ICV included as covariates), the aSCD-md subtype (Clinical
approach) showed significantly increased WMSA as compared with the HC (Table 3). A trend for a significant
increase in WMSA (p = 0.074) was observed for the anSCD subtype (Distribution approach) (Table 3). Partial
correlations were performed within each separate SCD group, controlled by age and ICV. Correlations showed
no significant association between the AD signature atrophy and the WMSA load. Additionally, all individu-
als were classified as having normal/abnormal values in the AD signature atrophy pattern and the WMSA load
based on the 90th percentile (Fig. 5). Interestingly, 100% of the individuals with abnormal values in both bio-
markers were SCD individuals. Furthermore, 88% of the individuals with an abnormal AD signature atrophy
pattern were SCD individuals, most showing an amnestic profile (aSCD-sd, aSCD-md, or amSCD). In contrast,
56% of the individuals with abnormal WMSA load were SCD individuals, and most showed a non-amnestic pro-
file, predominantly anomic (naSCd-sd and anSCD). Regression random forest models were conducted includ-
ing cognitive complaints, age, sex, depressive symptomatology, and ICV (only for WMSA) as predictors. Results
showed that, in the whole sample, the AD signature pattern was mainly predicted by the memory complaint and
sex, while WMSA were predicted by the writing complaint, age, ICV, and sex. The word-finding complaint also
predicted both biomarkers, and complaints in orientation and reading marginally predicted the AD signature
atrophy pattern. Model parameters are reported in Table 4B.
Discussion
In the current study we addressed one of the priorities for SCD research at present, namely, gaining knowledge on
the impact of different SCD operationalization approaches on the resulting SCD g roups3. We tested four alterna-
tive approaches to operationalize SCD on a large community-based cohort. We then characterized the resulting
SCD groups across a comprehensive set of demographical, clinical, and cognitive measures. We also sought to
investigate potential AD and cerebrovascular underlying pathologies through surrogate sMRI biomarkers. We
found that memory and word-finding were the most frequent complaints. However, they interrelated differently
with the other complaints leading to an amnestic cluster strongly associated with AD, as well as to an anomic
cluster, in which cerebrovascular disease also played a role. Writing, language comprehension, and language
Scientific Reports | (2021) 11:4356 | https://doi.org/10.1038/s41598-021-83428-1 11
Vol.:(0123456789)www.nature.com/scientificreports/
production complaints were also relevant, for example, delineating borderline performance on activities of daily
living and verbal episodic memory.
The two first operationalization approaches were hypothesis-driven and were based on well-established MCI
criteria. A high proportion of individuals endorsed two or more complaints (Psychometric criteria), similar to
previous SCD studies investigating the amount of c omplaints8. Further, aSCD-md was one of the most frequent
subtypes. Both findings support the notion of SCD as a multi-domain condition42,43, and highlight the hetero-
geneity within SCD. However, many previous studies have only recruited amnestic forms due to their focus on
AD5. In addition, previous studies have usually included more homogeneous samples than that of the current
study, because they were based on clinical settings where the frequency of memory complaints is h igher1,30,42–45.
In line with our results, non-amnestic complaints are frequently reported when heterogeneous community or
population-based cohorts are i nvestigated5–7. In particular, the word-finding complaint is frequently r eported6,7.
In the current study, we demonstrated that the Distribution operationalization approach translated these findings
directly to SCD subtypes, providing a classification that could be useful in community-based cohorts as compared
with operationalization approaches influenced by memory complaints (Clinical and Psychometric approaches).
In our fourth operationalization approach we used a data-driven method to identify the most clinically
relevant cognitive variables based on their interrelation with measures of activities of daily living. Of interest,
complaints that better predicted these cognitive and clinical variables included writing, language production,
and language comprehension, but not memory. Our interpretation of this finding is that memory and/or word-
finding complaints may be present in SCD individuals with an underlying neurodegenerative disorder7,46–48.
However, since memory and/or word-finding complaints are very frequent in our cohort, rarer complaints such
as writing, language production, and language comprehension seem to predict features of preclinical stages of
a neurodegenerative disorder better (i.e. worse performance in measures of cognition and activities of daily
living). Worse performance in these cognitive and clinical variables was also associated with lower crystallized
intelligence/education (measured by WAIS-III Information subtest). This finding suggests that these complaints
may reflect more premorbid cognitive or education status than preclinical changes associated to a neurodegen-
erative disease. However, below we discuss two other findings, i.e., cognitive profiles and sMRI biomarkers, that
support the interpretation of these atypical complaints as predictors of features related to preclinical stages of a
neurodegenerative disorder.
Writing, language production, and language comprehension complaints, which catalyze the Multivariate
SCD group, were associated with subclinical impairment in verbal episodic memory (learning and recognition).
These complaints, as well as memory complaints, were strongly associated with the AD signature atrophy pattern.
Importantly, this AD signature atrophy pattern has been related to higher amyloid burden, higher frequency of
the APOE ε4 allele, and greater progression to MCI and dementia in SCD i ndividuals31. Thus, this specific cluster
of complaints could be closely related to AD pathology. In contrast, word-finding complaints, which catalyze
several of the non-amnestic subtypes, were associated with subclinical impairment in executive and premotor
functions. There was also an association with memory functioning, since word-finding saturates on both the
amnestic and non-amnestic clusters, but word-finding seemed to be more closely related with WMSA than with
the AD signature atrophy. Previous studies have linked word-finding with non-AD p athologies49 and normal
50 7
aging in addition to AD . Therefore, we suggest that the anomic cluster of complaints in this study could be
related to cerebrovascular or mixed pathology (AD plus cerebrovascular pathology). These results are consistent
with MCI research showing that amnestic MCI is more closely associated with AD pathology, while non-amnestic
and multi-domain MCI forms are more commonly related to cerebrovascular, mixed, or other pathologies51.
Some limitations should be mentioned. Our data is cross-sectional and from a single center. Future research
should focus on validating our findings longitudinally and on independent cohorts. It is of relevance to ascertain
which is the best operationalization method for identifying SCD individuals at highest risk for developing cogni-
tive decline in the future. Our current analyses should be extended to include direct biomarkers of amyloid and
neurofibrillary tangle pathology. Nonetheless, we investigated a community-based cohort, where the a-priori
prevalence of AD is much lower than in clinical cohorts, and cerebrovascular and age-related tauopathies are
more prevalent.
Conclusions
In conclusion, our findings highlight the distinction between amnestic/non-amnestic phenotypes in SCD, per-
haps anticipating corresponding subtypes of MCI, and different AD presentations and other dementias. Based
on our findings we suggest that the SCD operationalization approach needs to be chosen depending on several
factors, including the aims of the study, the source of the individuals, the clinical purpose, the characteristics of
the clinical center, and the target of the clinical trial, among others. If the aim is early detection of any neurode-
generative disorder, the Clinical approach seems to have greater sensitivity but lacks of specificity and should be
combined with the Multivariate approach. However, this strategy may overlook anomic forms in community-
based cohorts. Hence, the Distribution approach may be a good starting point to explore the characteristics of the
cohort, and other approaches shall be used later on depending on the frequency of amnestic and anomic profiles.
To our knowledge, the current study is the first in applying and comparing different SCD operationalization
approaches in the same cohort. We provide relevant data that could be used as preliminary research guidance.
Since SCD-I support certain flexibility in the classification of SCD1,3, individual studies may still vary in their
major aims. Therefore, it is imminent that researchers clarify how they operationalize SCD and why they choose a
given approach. Our study could serve as a preliminary framework to guide and support their decision. However,
more validation work needs to be done to be able to directly generalize our methods and reach a standardized
operational/diagnostic criterion for SCD. The field needs to move forward conducting large multi-center studies
that investigate operationalization approaches of SCD in different cohorts and using various instruments for
Scientific Reports | (2021) 11:4356 | https://doi.org/10.1038/s41598-021-83428-1 12
Vol:.(1234567890)www.nature.com/scientificreports/
measuring subjective complaints. Our present study is only a preliminary step and we hope that our findings help
pave the way and encourage continuing the task of standardizing the operationalization of SCD in the near future.
Received: 3 June 2020; Accepted: 1 February 2021
References
1. Jessen, F. et al. A conceptual framework for research on subjective cognitive decline in preclinical Alzheimer’s disease. Alzheimers.
Dement. 10, 844–852 (2014).
2. Diniz, B. S., Butters, M. A., Albert, S. M., Dew, M. A. & Reynolds, C. F. Late-life depression and risk of vascular dementia and
Alzheimer’s disease: systematic review and meta-analysis of community-based cohort studies. Br. J. Psychiatry 202, 329–335 (2013).
3. Molinuevo, J. L. et al. Implementation of subjective cognitive decline criteria in research studies. Alzheimers. Dement. 13, 296–311
(2017).
4. Reisberg, B. & Gauthier, S. Current evidence for subjective cognitive impairment (SCI) as the pre-mild cognitive impairment
(MCI) stage of subsequently manifest Alzheimer’s disease. Int. Psychogeriatr. 20, 1–16 (2008).
5. Rabin, L. A. et al. Subjective cognitive decline in older adults: an overview of self-report measures used across 19 international
research studies. J. Alzheimers. Dis. 48(Suppl 1), S63-86 (2015).
6. Martins, I. P., Mares, I. & Stilwell, P. A. How subjective are subjective language complaints. Eur. J. Neurol. 19, 666–671 (2012).
7. Valech, N. et al. Executive and language subjective dognitive decline complaints discriminate preclinical Alzheimer’s disease from
normal aging. J. Alzheimers. Dis. 61, 689–703 (2018).
8. Amariglio, R., Townsend, M. K., Grodstein, F., Sperling, R. A. & Rentz, D. M. Specific subjective memory complaints in older
persons may indicate poor cognitive function. J. Am. Geriatr. Soc. 59, 1612–1617 (2011).
9. Busse, A., Hensel, A., Guhne, U., Angermeyer, M. C. & Riedel-Heller, S. G. Mild cognitive impairment: long-term course of four
clinical subtypes. Neurology 67,2176–2185 (2006).
10. Nemy, M. et al. Cholinergic white matter pathways make a stronger contribution to attention and memory in normal aging than
cerebrovascular health and nucleus basalis of Meynert. Neuroimage 211, 116607 (2020).
11. Gonzalez-Burgos, L., Hernández-Cabrera, J. A., Westman, E., Barroso, J. & Ferreira, D. Cognitive compensatory mechanisms in
normal aging: a study on verbal fluency and the contribution of other cognitive functions. Aging (Albany, NY) 11, 4090–4106
(2019).
12. Blessed, G., Tomlinson, B. E. & Roth, M. The association between quantitative measures of dementia and of senile change in the
cerebral grey matter of elderly subjects. Br. J. Psychiatry 114, 797–811 (1968).
13. Pfeffer, R. I., Kurosaki, T. T., Harrah, C. H., Chance, J. M. & Filos, S. Measurement of functional activities in older adults in the
community. J. Gerontol. 37, 323–329 (1982).
14. Folstein, M. F., Folstein, S. E. & McHugh, P. R. ‘Mini-mental state’. A practical method for grading the cognitive state of patients
for the clinician. J. Psychiatr. Res. 12, 189–198 (1975).
15. Tomaszewski Farias, S. et al. The measurement of everyday cognition: development and validation of a short form of the Everyday
Cognition scales. Alzheimers. Dement. 7, 593–601 (2011).
16. Rami, L. et al. The Subjective Cognitive Decline Questionnaire (SCD-Q): a validation study. J. Alzheimers. Dis. 41, 453–466 (2014).
17. Winblad, B. et al. Mild cognitive impairment–beyond controversies, towards a consensus: report of the International Working
Group on Mild Cognitive Impairment. J. Intern. Med. 256, 240–246 (2004).
18. Petersen, R. C. et al. Mild Cognitive Impairment: clinical characterization and outcome. Arch. Neurol. 56, 303–309 (1999).
19. Ganguli, M. et al. Sensitivity and specificity for dementia of population-based criteria for cognitive impairment: The MoVIES
project. J. Gerontol. 48, M152–M161 (1993).
20. Ferreira, D. et al. Different reserve proxies confer overlapping and unique endurance to cortical thinning in healthy middle-aged
adults. Behav. Brain Res. 311, 375–383 (2016).
21. Beck, A. A. T., Ward, C. H. H., Mendelson, M., Mock, J. & Erbaugh, J. An inventory for measuring depression. Arch. Gen. Psychiatry
4, 561–571 (1961).
22. Yesavage, J. A. et al. Development and validation of a geriatric depression screening scale: a preliminary report. J. Psychiatr. Res.
17, 37–49 (1982).
23. Ferreira, D. et al. Cognitive variability during middle-age: possible association with neurodegeneration and cognitive reserve.
Front. Aging Neurosci. 9, 188 (2017).
24. Cedres, N. et al. Subjective cognitive decline below and above the age of 60: a multivariate study on neuroimaging, cognitive,
clinical, and demographic measures. J. Alzheimer’s Dis. 68, 295–309 (2019).
25. Muehlboeck, J.-S., Westman, E. & Simmons, A. TheHiveDB image data management and analysis framework. Front. Neuroinform.
7, 1–13 (2014).
26. Ferreira, D. et al. Cognitive decline is mediated by gray matter changes during middle age. Neurobiol. Aging 35, 1086–1094 (2014).
27. Desikan, R. S. et al. An automated labeling system for subdividing the human cerebral cortex on MRI scans into gyral based regions
of interest. Neuroimage 31, 968–980 (2006).
28. Fischl, B. et al. Whole brain segmentation: automated labeling of neuroanatomical structures in the human brain. Neuron 33,
341–355 (2002).
29. Voevodskaya, O. et al. The effects of intracranial volume adjustment approaches on multiple regional MRI volumes in healthy
aging and Alzheimer’s disease. Front. Aging Neurosci. 6, 264 (2014).
30. Stewart, R. et al. Longitudinal neuroimaging correlates of subjective memory impairment: 4-year prospective community study.
Br. J. Psychiatry 198, 199–205 (2011).
31. Ferreira, D. et al. A ‘Disease Severity Index’ to identify individuals with Subjective Memory Decline that will progress to mild
cognitive impairment or dementia. Sci. Rep. 7, 188 (2017).
32. Haley, A. P. et al. Subjective cognitive complaints relate to white matter hyperintensities and future cognitive decline in patients
with cardiovascular disease. Am. J. Geriatr. Psychiatry 17, 976–985 (2009).
33. Benedictus, M. R. et al. White matter hyperintensities relate to clinical progression in subjective cognitive decline. Stroke 46,
2661–2664 (2015).
34. Ellis, K. A. et al. The Australian Imaging, Biomarkers and Lifestyle (AIBL) study of aging: methodology and baseline characteristics
of 1112 individuals recruited for a longitudinal study of Alzheimer’s disease. Int. Psychogeriatr. 21, 672–687 (2009).
35. Falahati, F. et al. The effect of age correction on multivariate classification in Alzheimer’s disease, with a focus on the characteristics
of incorrectly and correctly classified subjects. Brain Topogr. 29, 296–307 (2016).
36. Eriksson, L., Kettaneh-Wold, N., Trygg, J., Wikström, C. & Wold, S. Multi-and megavariate data analysis: Part I: basic principles
and applications (Umetrics Academy, 2006).
37. Salat, D. H. et al. White matter pathology isolates the hippocampal formation in Alzheimer’s disease. Neurobiol. Aging 31, 244–256
(2010).
Scientific Reports | (2021) 11:4356 | https://doi.org/10.1038/s41598-021-83428-1 13
Vol.:(0123456789)You can also read