Compensation disclosures - Executive compensation Compensation discussion and analysis Trustee compensation - TIAA.org
←
→
Page content transcription
If your browser does not render page correctly, please read the page content below

Teachers Insurance and Annuity Association of America

                          Compensation
                          disclosures
                          May 2021

                          Executive compensation
                          Compensation discussion and analysis
                          Trustee compensation
Table of contents

Table of contents
Executive compensation—Compensation discussion and analysis

Human Resources Committee report ..................................................................................................................................................1

Executive summary..............................................................................................................................................................................2

Total reward philosophy .......................................................................................................................................................................4

Compensation program best practices ................................................................................................................................................5

Components of total rewards ...............................................................................................................................................................6

Independent consultant........................................................................................................................................................................8

Establishing compensation levels ........................................................................................................................................................8

Variable compensation funding ..........................................................................................................................................................11

Measuring performance .....................................................................................................................................................................12

Performance highlights and compensation decisions for named executive officers ..........................................................................17

Employment agreements ...................................................................................................................................................................26

Executive compensation—Compensation tables and supplemental information

Summary compensation table ...........................................................................................................................................................28

2020 grants of plan-based awards .....................................................................................................................................................29

Outstanding performance-based awards ...........................................................................................................................................30

Nonqualified defined contribution and other deferred compensation plans........................................................................................31

Payments and benefits triggered by termination ................................................................................................................................32

CEO Pay Ratio Analysis ………………………………………………………………………………………………………..……………….35

TIAA Human Resources Committee processes and procedures

Human Resources Committee processes and procedures ................................................................................................................36

TIAA Board of Trustees

Independent Trustee gender and tenure demographics……………………………………………………………………………………..37

Independent Trustee compensation

Program overview ..............................................................................................................................................................................38

Compensation tables and supplemental information .........................................................................................................................38

                                                                                                                                                                 Compensation disclosures
Executive compensation—Compensation discussion and analysis

Executive compensation—Compensation discussion and analysis
Human Resources Committee report
This Compensation Discussion and Analysis (“CD&A”) and accompanying tables describe the associate compensation program of
Teachers Insurance and Annuity Association of America (“TIAA” or the “Company”).

The CD&A has been reviewed and approved by the Human Resources Committee (the “Committee”) of the TIAA Board of Trustees
(the “Board”). The Committee has been delegated by the Board the responsibilities for guiding and overseeing the formulation and
application of compensation and other human resources policies and programs for the Company (the Committee’s charter is
available on the Company’s website, under (“Committee Charters”). These policies and programs are designed to enable the
Company to attract, retain, motivate and reward associates who possess the knowledge and experience the Company needs to
conduct its business. Furthermore, the Committee also ensures that these policies and programs are designed and administered in
a manner that aligns associate pay with the interests of the Company’s individual customers and institutional clients (collectively
referred to as “participants”).

Although the Company is not subject to the Securities and Exchange Commission (“SEC”) rules governing executive compensation
disclosure, the Committee voluntarily publishes this document for the benefit of the Company’s participants. This disclosure, which
embodies the principles of these rules, has been designed to provide participants with a comprehensive picture of the rationale
behind the Company’s executive compensation decisions.

For more than a decade, the Company has been providing individual participants the opportunity to provide an advisory vote and
express their views on TIAA’s compensation policies, programs and practices. The focus of the vote is on the actual compensation
decisions that were made for the preceding performance year. Last year, seventy-four percent of the participant votes supported
management’s compensation decisions, pay-for-performance approach to compensation, and the Company’s transparency in
voluntarily disclosing this process. Only ten percent of the votes did not support the Company’s approach, while sixteen percent of
the votes abstained from a decision. The Company continues to take into consideration the annual participant advisory vote and
commentary on executive compensation when making decisions regarding executive compensation.

Respectfully submitted,

TIAA Human Resources Committee

Kim M. Sharan, Chair
James R. Chambers
Edward M. Hundert
Dorothy K. Robinson
Ronald L. Thompson
Marta Tienda

                                                                                                            Compensation disclosures 1
Executive compensation—Compensation discussion and analysis
Executive summary
This CD&A describes the Company’s compensation program and the 2020 compensation decisions for its named executive officers
(“NEOs”)— the Chief Executive Officer (“CEO”), the Chief Financial Officer (“CFO”) and the next three most highly compensated
Executive Committee members (policy makers of the Company).
■ Roger W. Ferguson, Jr., President and CEO
■ Glenn R. Richter, Senior Executive Vice President (“SEVP”) and CFO
■ Jose Minaya, SEVP and CEO Nuveen1
■ Vijay C. Advani, SEVP, Executive Chairman, Nuveen2
■ Lori D. Fouché, SEVP Advisor to the CEO3
___________
1
Mr. Minaya assumed the role of SEVP and CEO Nuveen in January 2020 and prior to the role, he was the President and Chief Investment Officer of
Nuveen.
2
Mr. Advani served as Executive Chairman beginning January 2020 following Mr. Minaya’s assumption of the role of Nuveen CEO.
3
Ms. Fouché served as SEVP and CEO, TIAA Financial Solutions through June 8, 2020 and remained with the company through December 2020 in the role
as SEVP, Advisor to the CEO.
After thirteen years of service as the President and CEO of TIAA, Roger Ferguson announced his retirement in the fourth quarter of
2020 to be effective April 30, 2021. After a comprehensive search by the TIAA Board of Trustees, Thasunda Brown Duckett was
named as TIAA’s new President and CEO effective May 1, 2021. Building on Mr. Ferguson’s legacy, Ms. Duckett will continue our
commitment to serve the millions of clients and thousands of institutions that rely on us every day and to execute our strategy.
2020 company highlights
Business Performance
■ In 2020, with TIAA’s successful completion of its decade-long Vision 2020 growth and diversification strategy, the Company
embarked on a new journey, “Win with Purpose Together,” a new strategy to continue the development of TIAA Financial
Solutions (“TFS”) and integration of Nuveen and TIAA Bank more deeply into the customer experience. Under the new
strategy, the Company increased its scale and diversified its assets and sources of revenue to remain well positioned to serve
clients in the future.
■ Despite extreme market volatility and global economic uncertainty amid the COVID-19 pandemic, TIAA maintained its superb
financial strength. In continued recognition of its stability, claims-paying ability, and overall expense management, the
Company remained one of just three U.S. insurers to hold the highest possible rating from three of the four leading insurance
company-rating agencies.
■ The Company achieved strong financial and investment performance, with assets under management/administration reaching
$1.4 trillion and net flows favorable to plan. The TIAA General Account also continued to show strong performance.
■ TIAA paid $15.3 billion in retirement income and other disbursements in 2020. TIAA provided income to 36,300 annuitants
over the age of 90 – and 1,383 over the age of 100. Since 1918, TIAA participants have received over $505 billion in annuity
payments and other benefits.
■ TFS successfully combined its Institutional Relationships and Wealth Management teams into one truly integrated
organization, a key step in leveraging the breadth of its capabilities and delivering more seamless solutions to clients.
Adoption of TIAA’s innovative RetirePlus solution - a groundbreaking new approach to Qualified Default Investment
Alternatives that includes lifetime income and helps clients achieve a financially secure retirement – continued to grow.
Compensation disclosures 2
Executive compensation—Compensation discussion and analysis

 ■   Nuveen continued its progression as a premier global investment manager. Nuveen produced strong long-term results against
     Morningstar category peers, delivered strong financial results, and continued evolving to a more scalable, efficient, and client-
     focused structure and model. Reflecting its strong investment performance, Nuveen won 17 Lipper Awards, spanning all the
     major asset classes in which it offers products, and had an impressive showing in Barron’s most recent Best Fund Families
     rankings. Nuveen continued to grow its third-party business through diversification efforts.
 ■   TIAA Bank, which has broadened the Company’s ability to meet clients’ financial needs, ended the year with participant
     deposits 24% higher than year-end 2019 figures.
 ■   As both a diversified global asset manager and an asset owner, Nuveen continued to build on the Company’s half century of
     legacy advocating on responsible investing (“RI”) by applying these RI principles across the Company’s $1.2 trillion in assets
     under management.
 ■   The Company’s investment products continued to perform well: 70% of TIAA-CREF mutual funds and CREF variable annuities
     received a Morningstar overall rating of 4 or 5 stars across all asset classes (48% 4 stars and 22% 5 stars), based on risk-
     adjusted returns as of December 31, 2020.
 ■   The Company continued to focus on providing clients with low-cost products. As of December 31, 2020, 93% of TIAA-CREF
     mutual funds and CREF variable annuities had expense ratios that were below the median of their respective Morningstar
     categories.

 Culture and Corporate Responsibility

 Guided by its values, TIAA continued to be a leader as a responsible corporate citizen and employer and to drive positive
 environmental and social outcomes for clients through its investing practices, despite a turbulent year in which unprecedented
 challenges surfaced.
 ■   As of 2020, the TIAA General Account Impact Portfolio has deployed $2.1 billion in capital commitments, including
     commitments in the following sectors: affordable housing ($1.2 billion); inclusive growth ($773 million); and resource efficiency
     ($105 million).
 ■   Nuveen achieved its goal of systematically integrating environmental, social and governance (“ESG”) factors in its investment
     process for 100% of our assets under management. The firm had 800 touch points across 598 issues focusing on financially
     material ESG concerns and also provided climate training for over 900 investment and risk professionals across the Nuveen
     and TIAA funds complex.
 ■   Nuveen achieved the “Advanced” rating on Morningstar’s inaugural ESG commitment level report and was named 1st in
     shareholder resolutions on Inclusion and Diversity (“I&D”) Issues in the U.S.
 ■   TIAA received a number of recognitions for diversity, including DiversityInc’s Top 50 Companies for the eighth year in a row.
     The Company also received a 100% rating on the Human Rights Campaign’s Corporate Equality Index.
 ■   For the seventh year in a row, TIAA was named one of the World’s Most Ethical Companies by Ethisphere – one of only six
     companies in the financial services industry to win that recognition.
 ■   TIAA was named a Top 70 company for executive women by the National Association for Female Executives, an award that
     recognizes companies where women significantly influence and impact the decisions that affect their company's future and
     bottom line.
 ■   The National LGBT Chamber of Commerce and partners in the National Business Inclusion Consortium named TIAA a 2020
     Best of the Best Corporation for Inclusion for the fifth consecutive year. The award honors TIAA’s commitment to being a
     diverse supplier and to having a workforce that includes LGBTQ+, people of color, women, and people with disabilities.

                                                                                                              Compensation disclosures 3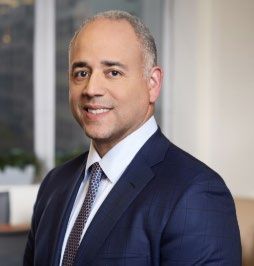
Executive compensation—Compensation discussion and analysis

  ■   TIAA responded to racial injustice events of 2020 with the introduction of the “Be the Change” Initiative. Internally, the
      Company focused on education and forums for dialogues about race, advocacy and allyship. The Company also enhanced
      hiring guidelines to require a diverse slate of candidates and diverse panel of interviewers for open roles. Externally, the
      Company provided guidance to institutional clients and vendors on implementing I&D efforts.
  ■   Through Nuveen’s Women on Boards engagement initiative, it engaged in 2019 and 2020 with 876 U.S. and Japanese
      companies with no female representation on their corporate boards, and more than 40% added a female director.
  ■   Through its Corporate Social Responsibility program, TIAA gave back to the communities in which it operates. Associate-
      directed donations and Company matching contributions to the community topped $2.8 million. Associates in 130 locations
      completed 230 service projects, totaling 27,900 volunteer hours, positively impacting more than 1.2 million lives. Events
      included programs that raised funds to purchase N95 masks, personal protective equipment, and medical supplies for
      healthcare clients in New York City; support The Innocence Project; and provide donations that provided over 500,000 meals
      to Feeding America.

Total reward philosophy
Compensation and benefits programs for the Company’s associates are designed with the goal of providing remuneration that is
fair, reasonable, and competitive. The programs are intended to help the Company recruit, retain, and motivate qualified associates
and align their interests with those of the Company’s participants by linking pay to long-term growth.

These programs are designed based on the following guiding principles:

Performance
The Company believes that the best way to align compensation with the interests of its participants is to link pay directly to
Company, business area, and individual performance, with a focus on sustained long-term financial performance.

Competitiveness
Compensation and benefits programs are intended to be competitive with those provided by companies with whom the Company
competes for talent. In general, programs are considered competitive when they are targeted at the median of these competitor
companies. Individuals may vary from this targeted positioning due to a variety of factors such as tenure, performance, criticality of
role, etc.

Cost
Compensation and benefits programs are designed to be cost-effective and affordable, ensuring that the interests of the
Company’s participants are considered.

Consistency
These guiding principles are intended to apply consistently to all associates of the Company, regardless of their level. As such,
other than the limited availability of a company car and driver for use by the CEO, there are no special programs or perquisites
available exclusively to the Company’s senior executives. The Company believes that this is an important element in creating an
environment of trust and teamwork that furthers the long-term interests of the organization.

                                                                                                               Compensation disclosures 4
Executive compensation—Compensation discussion and analysis

Compensation program best practices
Our compensation program includes key features that align the interests of our associates with the interests of our participants.
Moreover, the program deliberately excludes features that could hinder this critical alignment:

   Best practices modeled in our program                              Practices we do not engage in or allow
            Majority of senior executive compensation is                        No acceleration of long-term award vesting
            performance-based                                                   except in the event of death
            At least half of senior executives' performance-                    No change in control benefits
            based pay tied to long-term goals of the Company                    No special or enhanced employee benefit
            Pay-for-performance metrics directly aligned with                   plan arrangements for senior executives
            key strategic and operational objectives                            Except for limited use of a company car and
            Incentive plans designed to mitigate inappropriate or               driver available to the CEO, no executive
            excessive risk-taking                                               perquisites provided
            Pay program grounded in market-based, competitive
            pay practices
            Variable compensation directly tied to Company
            affordability metrics
            Outstanding long-term incentive awards forfeited in
            the event of termination for cause
            Participants' annual advisory vote and commentary
            are taken into consideration when making pay
            decisions
            Annual voluntary disclosure of compensation
            consistent with SEC rules

                                                                                                             Compensation disclosures 5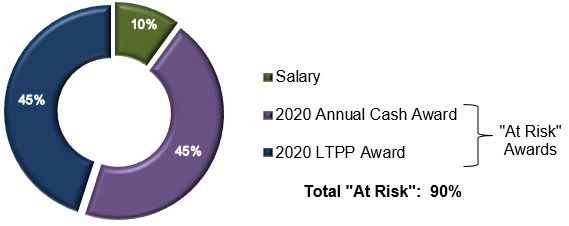
Executive compensation—Compensation discussion and analysis

Components of total rewards
The Company’s total rewards package consists of direct compensation and Company-sponsored benefit plans. Each component is
designed to achieve a specific purpose and to contribute to a total package that is appropriately performance-based, competitive,
affordable to the Company, and valued by the Company’s associates.
Direct compensation program
The total direct compensation for Company associates (including our NEOs) consists of fixed (i.e., base salary) and variable
compensation.

                                                                                                           Compensation disclosures 6
Executive compensation—Compensation discussion and analysis

Employee benefit plans
The Company provides company-sponsored health, welfare and retirement plan benefits to associates. This benefits package is
designed to assist associates in providing for their own financial security in a manner that recognizes individual needs and
preferences. Associate benefits, in aggregate, are reviewed periodically to ensure that the plans and programs provided are
generally competitive and cost-effective, and support the Company’s human capital needs. Benefit levels are not directly tied to
Company, business area, or individual performance.

Health and welfare plans
The core health and welfare package includes medical, dental, vision, disability, and basic group life insurance coverage. NEOs are
eligible to participate in these benefits on the same basis as other Company associates.

Retirement and deferred compensation plans
The Company provides qualified and nonqualified retirement and deferred compensation benefits to associates.
■   Retirement Plan and Retirement Benefit Equalization Plan
    The Retirement Plan is a tax-qualified defined contribution (money purchase) plan. The plan is intended to help provide for an
    associate’s financial security in retirement through Company contributions of a percentage of base salary (which are based on
    the associate’s age). NEOs participate in the Retirement Plan on the same basis as all other Company associates.
    Participation in the plan begins as soon as associates are hired. Contributions to the plan are directed by participating
    associates into certain retirement annuities, mutual funds, and other options.
    The Retirement Benefit Equalization Plan (“Equalization Plan”) is an unfunded, nonqualified plan that works together with the
    Retirement Plan to provide for an associate’s financial security in retirement. This plan covers those associates for whom
    contributions to the Retirement Plan are limited under federal tax law. The Company contributes an amount equal to the
    excess of what otherwise would have been provided under the Retirement Plan if those limits did not apply. Deferrals are
    credited to notional accounts until distribution. Participating associates may allocate credited amounts among notional
    investment options. The Company has set aside amounts that are invested in parallel to the notional investments to cover its
    obligations under this plan.
    Benefits are payable under the Retirement Plan following termination of employment as elected by the participating associate
    under the plan. Benefits under the Retirement Benefit Equalization Plan are payable on the later of termination of employment
    or the participating associate’s 60th birthday. All amounts under the plans are fully vested after three years of service.
■   401(k) Plan and 401(k) Excess Plan
    TIAA’s Code Section 401(k) Plan (“401(k) Plan”) provides associates the opportunity to save for retirement on a tax-favored
    basis. NEOs may elect to participate in the 401(k) Plan on the same basis as all other TIAA associates. The Company

                                                                                                           Compensation disclosures 7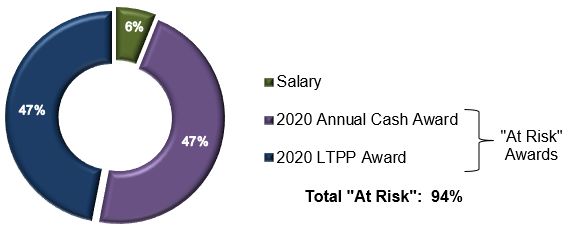
Executive compensation—Compensation discussion and analysis

    provides a matching contribution equal to 100% of the first 3% of the associate’s base salary contributed to the 401(k) Plan.
    New associates are automatically enrolled in the plan with the option to opt out. Contributions to the plan are directed by
    participating associates into certain retirement annuities, mutual funds, and other options.
    Associates whose matching contributions are limited under federal tax law may be eligible to defer additional amounts under
    the nonqualified 401(k) Excess Plan (“Excess Plan”). Deferrals under this plan are credited to participating associates’ notional
    accounts and may be allocated by associates to notional investment options. As with the Retirement Benefit Equalization Plan,
    the Company has set aside amounts that are invested in parallel to the notional investments to cover its obligations under this
    plan.
    Benefits under the 401(k) Plan are generally payable following termination of employment as elected by the associate. Benefits
    under the 401(k) Excess Plan are paid at termination of employment. All associate contributions under the plans are fully
    vested at all times. The Company’s matching contributions under the plans are fully vested after three years of service.
■   Retirement Healthcare Savings Plan
    The Retirement Healthcare Savings Plan (“RHSP”) allows associates to make after-tax contributions to a trust that can be used
    for post-retirement medical care expenses. The Company provides a matching contribution equal to 100% of the first $750
    contributed to the RHSP. Benefits under the RHSP are only payable following termination of employment. All associate
    contributions under the plan are fully vested at all times. The Company’s matching contributions are fully vested after three
    years of service.
■   Voluntary Executive Deferred Compensation Plan
    The Voluntary Executive Deferred Compensation Plan (“VEDCP”) provides eligible associates, including the NEOs, the
    opportunity to defer a portion of their annual cash award and vested LTPP payout.
    Deferrals are credited to participating associates’ notional accounts and may be allocated among notional investment options.
    All amounts deferred under the plan are fully vested at all times. Payments under the plan may be made in a single lump sum
    or in annual installments. As with the other nonqualified deferred compensation plans, the Company has set aside amounts
    that are invested in parallel to the notional investments to cover its obligations under this plan.

Perquisites
The Company generally does not provide any perquisites to its NEOs. Currently, the CEO has access to a Company car and driver
for business and personal use.

Independent consultant
Under the authority granted by its charter, the Committee engaged Semler Brossy Consulting Group LLC (“Semler Brossy”) as its
independent compensation consultant. Consistent with best practices, Semler Brossy does not provide any services to
management during its engagement with the Committee.

In carrying out its responsibilities, the Committee evaluates the information and recommendations put forth by management and its
independent advisor in making its decisions regarding executive compensation. The Committee’s decisions are made with the
objective of providing fair, equitable and performance-based compensation to senior executives in a manner that is affordable and
cost-effective for the Company’s participants.

Establishing compensation levels
Total direct compensation levels (base salary, annual cash award, and LTPP award) are established based on several factors:
Company, business area, and individual performance, as well as competitive benchmarking. To ensure that pay is competitive with
market practices, the Company conducts benchmarking analyses each year against a relevant competitive peer group.

                                                                                                             Compensation disclosures 8
Executive compensation—Compensation discussion and analysis
In general, the Company considers our compensation to be competitive when it is targeted at the median pay levels of our peer
group. When performance exceeds expectations, pay levels are likely to be above target. Conversely, when performance falls
below expectations, pay levels are likely to fall below target.
Allocation of variable compensation
Based on the total funding available for variable compensation (which is discussed in detail below), the CEO, in consultation with
the SEVP, Chief People Officer and Senior Vice President, Head of Enterprise Total Rewards, allocates the aggregate variable
compensation pool to the Company’s business and support areas based on their respective relative contributions to the Company’s
overall performance, as determined in his discretion.
Determining individual compensation levels
Within the confines of the funding allocated to the respective area, individual variable compensation award determinations by
managers are discretionary, based on individual performance and in the context of market pay levels for a given position. Individual
performance is measured through a formal annual performance evaluation process, which includes year-end performance
assessments. Once the individual total direct compensation decisions have been made, the amount of variable compensation to be
awarded as annual cash and LTPP awards is determined based on a formula that provides for a greater proportion of long-term
incentives at higher levels of total direct compensation.
For the NEOs, the Company follows a similar decision-making process in determining appropriate pay levels. In order to ensure
that there is sufficient alignment with the long-term success of the organization, the proportion of variable compensation awarded
as long-term incentives is higher for the NEOs (at least fifty percent of variable compensation attributable to their time on the
Executive Committee) than for other associates.
Chief Executive Officer
Compensation for the CEO is approved by the Board following recommendation by the Committee. The Committee bases its
determination on its assessment of the Company’s overall performance, the CEO’s individual contributions against the achievement
of the corporate goals and other priorities agreed to by the Board and the CEO, and market competitive compensation packages for
chief executive officers among firms in the asset management and insurance industries of similar size and complexity (i.e., multiple
product lines and channels of distribution).
The comparator group used in the market competitive analysis consists of the 17 asset management and insurance companies
listed below (the “Peer Group”). These companies were selected on the basis of their size and complexity in relation to TIAA:
Peer Group
Affiliated Managers Group The Hartford Financial MetLife
Ameriprise Financial Invesco MorganStanley
Bank of NY Mellon JPMorganChase NorthernTrust
BlackRock LincolnNational PrincipalFinancial
Charles Schwab MassMutualFinancial PrudentialFinancial
Franklin Resources T.RowePrice
The current Peer Group was developed in 2017 based on recommendations from Semler Brossy. Legg Mason was removed from
the Peer Group for the 2020 performance year following its acquisition in July 2020 by Franklin Resources (which remains a
member of the Peer Group).
Compensation disclosures 9Executive compensation—Compensation discussion and analysis
Senior Executive Vice Presidents
Compensation for SEVPs, including those that are NEOs, is approved by the Board (at the recommendation of the CEO and then
the Committee).
Recommendations are based on the performance evaluations described above and with reference to competitive pay data of
similarly sized asset management firms, insurance companies and/or mid-sized financial institutions, as applicable to each position.
With reference to this appropriate market compensation data, the CEO develops recommendations based on the overall funding
available for variable compensation and the SEVP’s performance. Discretion is exercised in determining the overall total direct
compensation to be awarded to the SEVP and the recommended variable compensation mix. At least one-half of the variable
compensation awarded to SEVPs is delivered as LTPP awards.
The Company believes that the discretionary design of its variable compensation program supports its overall compensation
objectives by allowing for significant differentiation of pay based on performance. Moreover, it provides the flexibility necessary to
ensure that pay packages for the SEVPs are competitive relative to the external market, to link compensation to results that benefit
the Company’s participants, and to provide internal equity that appropriately reflects the contributions of each SEVP to the short
and long-term success of the organization and to their efforts in reinforcing risk controls and the risk culture of the organization.
The key components of the annual decision-making process in recommending compensation levels for the SEVPs are as follows:
The key members of management who assist the CEO in determining compensation actions for the SEVPs are the SEVP, Chief
People Officer (except with respect to his own compensation) and the Senior Vice President, Head of Enterprise Total Rewards.
Compensation disclosures 10Executive compensation—Compensation discussion and analysis
Variable compensation funding
The Company’s approach to determining appropriate annual variable compensation funding is intended to better drive the
Company’s business strategy, accurately reflect Company performance and balance the interests of our participants with those of
our associates. It ensures that variable compensation continues to remain affordable, while providing payouts clearly aligned with
actual performance and consistent with an acceptable risk profile.
The following chart summarizes the process for developing the annual variable compensation pool:
Compensation disclosures 11Executive compensation—Compensation discussion and analysis
Measuring performance
2020 Corporate Quality Scorecard
The Corporate Quality Scorecard (“CQS”) is a key measure of the combined performance of TIAA and is one factor that impacts
the annual variable compensation funding decision. Revisions are made to the CQS at the beginning of each performance year to
ensure alignment with current business objectives, and is reviewed and approved by the Board to ensure that its metrics, targets
and scaling remain aligned to TIAA’s goals and do not encourage inappropriate or excessive risk-taking.
To ensure alignment between incentive compensation and Company performance, the CQS results are used to directly size the
requested TIAA variable compensation pool funding for existing employees. For 2020 the CQS continued to include the broader set
of metrics that are designed to reflect the enterprise’s health and performance in a given year. The performance metrics have
calendar year targets set by the Executive Committee with input from the business areas. The CQS consisted of metrics that are
divided into four categories: Customer, Financial, Operational/Execution, and People, which were weighted as shown in the
following table:
Category Total weighting
Customer 25%
Financial 35%
Operational/Execution 20%
People 20%
Total 100%
Specific strategic objectives, performance measures, and targets are established at the beginning of the year, as are the
performance scales that translate results into CQS scores for each category. The aggregate annual performance result is
calculated based on the actual performance relative to the pre-established targets and the weightings associated with each metric,
and is a significant factor in determining the size of the variable compensation pool.
A high level description of the metrics is included below; however, specific targets are not disclosed for competitive reasons.
Customer Category
The Customer category includes an aggregate weight of 25% on the CQS. The overall Customer result is equal to the average of
the results for the three Customer metrics:
Net Promoter Score – Individual and Plan Sponsor
These metrics quantify the strength of individual participant and institutional client loyalty. Results are collected through
online and telephone surveys, which capture customer responses to the question “How likely would you be to
recommend TIAA’s products and services to a friend or colleague?”
Participant First-Choice Consideration
Percentage of surveyed participants answering, “it would be my first choice” (highest on a scale of four options) when
asked if they would “consider using TIAA for any of my financial needs”.
Compensation disclosures 12Executive compensation—Compensation discussion and analysis
Financial Category
The Financial category includes an aggregate weight of 35% on the CQS. The overall Financial result is equal to the average of the
results of the five Financial metrics:
Net Flows vs. Target
The difference between the Company's cash inflows and outflows in a given period.
Operating Margin vs. Target
Total revenue before dividend credited to Participants, less total expenses.
Operating Expenses vs. Target
Expense the Company incurs through its normal business operations.
Gross Guaranteed Income Flows vs. Target
Inflows to TIAA Traditional.
Non-GA Revenue vs. Target
TIAA management revenue excluding General Account for Pension/IRA across all categories of revenue.
Operational/Execution Category
The Operational/Execution category includes an aggregate weight of 20% on the CQS. The overall Operational/Execution result is
equal to the average of the results of the three Operational/Execution metrics:
Individual Customer Digitization Score
Percentage of key individual customer transactions performed through digital channels.
Investment Performance
Assessment of investment performance relative to established benchmarks for a representative selection of actively-
managed funds and investment options across the organization.
Strategic Initiative Execution Score
Percentage of planned milestones that are completed for strategic initiatives governed by the Enterprise Program
Management Office.
People Category
The People category includes an aggregate weight of 20% on the CQS. The overall People result will be equal to the weighted
average of certain associate engagement and diversity metrics:
Associate Engagement
Average of five individual item scores that represents the specific emotional outcomes that are critical to engagement
within the company.
Diversity Representation
Tracks associate representation across various demographics
2020 LTPP Scorecard
The LTPP Scorecard is intended to align associate interests with those of our participants both in terms of our accomplishments
and our performance. It also provides greater transparency for both participants and associates. The design, as illustrated below,
provides a balanced solution that will enable the Company to attract and retain associates while aligning associates’ interests with
the long-term interests of our participants.
Compensation disclosures 13Executive compensation—Compensation discussion and analysis
The LTPP Scorecard was designed specifically to balance financial results with prudent risk-taking in order to ensure that there is
no incentive for associates to engage in unnecessary and excessive risk taking. The results are monitored each year to ensure that
the design continues to properly manage inappropriate risk.
The results of the LTPP Scorecard determine the annual change to our PUV. The number of Performance Units granted and the
value of the Performance Units at vesting are based on the PUV at grant and at vesting, respectively. Similar to 2019, the 2020
LTPP Scorecard was designed to align the value of LTPP units with TIAA’s performance against the following key strategic and
operational priorities:
■ Grow TIAA’s assets in a healthy and sustainable manner
■ Maximize risk-adjusted investment performance on a relative basis
■ Build and sustain high loyalty with participants
■ Effectively manage cost for participants
AUM/A & TIAA Capital Account Growth
This combined metric measures the annual growth of all assets under management and administration by the Company including
TIAA Bank assets (e.g., loans). It captures both our absolute annual investment performance and our annual net client flow
performance, before benefit payouts to participants. This includes the assets of all of our subsidiaries and joint ventures.
This metric is a key feature of our design because it provides an incentive to grow assets, which leads to more competitive pricing.
This will increase participants’ investment returns. The metric serves to align associate interests with our participants’ investment
experience by directly impacting LTPP PUV.
Evaluating company performance
This portion of the formula focuses on our operations and is based on three separate metrics:
■ Investment Performance
The intent of this metric is to align TIAA’s investment strategy with outcomes. It uses a similar calculation as used in the current
CQS, but is based on a five-year weighted average.
Year-over-year Operating Margin Growth
This metric reflects the organizational focus on bottom line value creation for our participants. This is achieved by continuing to
improve revenues that lead to both increased dividends to participants and superior financial strength while thoughtfully
managing expenses in a time that key strategies such as growth and diversification require significant year-over-year
incremental investments. Since capital gains and losses are reflected in TIAA’s Capital Account (and included in the AUM/A
Compensation disclosures 14Executive compensation—Compensation discussion and analysis
Growth metric described above), they are excluded from this calculation. In addition, dividends paid to participants are
excluded from this calculation in order to insulate this metric from our annual dividend decision.
■ Composite Operational Score
For 2020 the Composite Operational Score was updated to place significant emphasis on the Company’s performance related
to its Customer strategy, while continuing to assess Nuveen’s performance in growing its third-party AUM. The Composite
Operational Score consists of individual metrics that assess Company performance relative to certain specific business area
strategic initiatives. The individual business area metrics were evenly weighted, and results relative to the established targets
were aggregated to determine the final Composite Operational Score as follows:
Nuveen Third-Party Organic Growth
This metric assesses Nuveen’s ability to grow its third-party AUM.
Customer Complaints Index
The Customer Complaints Index evaluates the customer experience with TIAA and TIAA Bank by monitoring the
frequency of customer complaints compared to the volume of activity.
Net Promoter Score – Individual and Plan Sponsor
These metrics quantify the strength of individual participant and institutional client loyalty. Results are collected through
online and telephone surveys, which capture customer responses to the question “How likely would you be to
recommend TIAA’s products and services to a friend or colleague?”
Participant First-Choice Consideration
Percentage of surveyed participants answering, “it would be my first choice” (highest on a scale of four options) when
asked if they would “consider using TIAA for any of my financial needs”.
Board discretion
The Board retains overall discretion to adjust the annual LTPP PUV above or below the actual LTPP Scorecard results for
such year, if necessary, to properly fulfill its responsibility to our participants to ensure payout levels are appropriate in light of all
relevant considerations, such as organizational health, capital adequacy, cost effectiveness, and any extraordinary external events
or situations.
LTPP PUV
As with the CQS, specific strategic objectives, performance measures, and targets are established and set at the beginning of the
year, as are the performance scales that translate results into LTPP Scorecard scores for each metric. The aggregate annual
performance result, called the LTPP Scorecard factor, is calculated based on the actual performance relative to the pre-established
targets associated with each metric, and is used to determine the increase (or decrease) in LTPP PUV for the performance year.
For 2020, the LTPP Scorecard result was 15.55%, driven by strong market appreciation and strong AUM/A growth, solid
Investment Performance, and the Composite Operational Score metrics ending at or above target in 2020. The 2020 LTPP
Scorecard performance resulted in an increase in the LTPP PUV to $4,915.8678.
The following chart shows the annual percentage change in LTPP PUV since 2013, relative to the annual total shareholder return
for the companies in our Peer Group for each respective year.
Compensation disclosures 15Executive compensation—Compensation discussion and analysis
Annual change in LTPP PUV relative to Peer Group Total Shareholder Return
Compensation disclosures 16Executive compensation—Compensation discussion and analysis
Performance highlights and compensation decisions for the named executive officers
The Company achieved strong performance in 2020 and made significant strides toward its long-term strategic goals, and the
performance of our NEOs was critical to the Company’s success. The following is a summary of the significant achievements of our
NEOs that formed the basis of the 2020 compensation decisions:
Roger W. Ferguson, Jr., President and CEO
Responsibilities: Mr. Ferguson managed TIAA’s business operations and senior leadership through his
retirement on April 30, 2021. He was responsible for implementing and directing TIAA’s strategy and served as
the primary liaison between the Board, the CREF Board and management. He also played a key role as brand
ambassador for the Company.
2020 Performance Highlights:
Mr. Ferguson led the successful completion on the Company’s overarching Vision 2020 growth and
diversification strategy that guided its growth for a decade: becoming a fully diversified financial services
company that helps clients meet a broad range of financial needs at all stages of life.
Under Mr. Ferguson’s leadership, TIAA maintained its outstanding financial strength and remained one of
just three US insurance companies to receive the highest possible ratings from three of the four leading
insurance company rating agencies.
Mr. Ferguson helped to guide the Company to strong financial and investment performance in 2020, with
assets under management/administration reaching $1.4 trillion and net flows favorable to plan. The TIAA
General Account also continued to show strong performance.
Mr. Ferguson oversaw the continued integration and growth of TIAA’s two core businesses: TFS and
Nuveen, including leading the TFS organization for the second half of the year. In 2020, Mr. Ferguson led
the Company’s launch of a new strategy, “Win with Purpose Together,” to further develop and define TFS
and integrate TIAA Bank and Nuveen more deeply into the participant experience. Despite extreme market
volatility and global economic uncertainty amid the COVID-19 pandemic, TIAA preserved its financial
position. The company’s 2020 Voluntary Separation Program (“VSP”) allowed TIAA to reshape and resize
into a more streamlined, agile enterprise that’s well-positioned to meet the needs of its clients going forward.
TFS successfully integrated the Institutional Relationships and Wealth Management teams into the
new Client Relationships organization. The Product Group and Chief Customer Office combined into
Client Solutions and Outcomes, and worked to ensure the continued growth in adoption of TIAA’s
innovative RetirePlus solution as a Qualified Default Investment Alternative. TIAA Traditional gross
flows were well ahead of plan. Additionally, TIAA Bank moved quickly in the spring of 2020 to
become a small business lender under the federal Paycheck Protection Program, and was also
among the country’s first to respond to forbearance requests on loans.
Nuveen continued on its path to becoming a premier global investment manager, achieving
impressive long-term results against Morningstar category peers; delivering strong financial results;
and continuing to evolve to a scalable, efficient, and client-focused structure and model. Nuveen won
17 Lipper awards, achieved its milestones for the implementation of its global operating model, and
continued to grow its third-party business.
2020 was a uniquely challenging year for the Client Services and Technology (“CS&T”) area. From
embracing the digital shift to supporting our clients during difficult times to enabling 16,500 associates to
work remotely in just a few days, CS&T kept clients and stability at the forefront. TIAA’s Contact Centers
Compensation disclosures 17Executive compensation—Compensation discussion and analysis
responded to more than 4.8 million client inquiries and the Operations team processed 54 million retirement
transactions. Inbound paper forms were reduced by 25% year over year. With SEC approval, the Company
continued its movement to electronic communication, eliminating nearly 2 million paper confirmation
statements, saving $1.6 million annually.
Nuveen made strides in technology, migrating its global trading platform for equities to a third-party, achieving
significant savings in investment accounting through the Nuveen mortgages transition, and integrating key
aspects of Nuveen’s Symphony Asset Management business that reduced risk and empowered teams.
Mr. Ferguson continued to strengthen TIAA’s foundation, overseeing the conversion to remote work for
16,500 associates in just three days in March 2020, migrating 20,000 devices to new software for enterprise
collaboration, and - unifying human resources processes and technology globally – the culmination of a
multi-year effort.
As TIAA’s most visible brand ambassador in 2020, Mr. Ferguson engaged in many additional speaking
opportunities, media interviews, and client/associate engagement activities to provide reassurance in
addition to discussing topics like TIAA’s evolution, the importance of guaranteed lifetime income, the value of
I&D (specifically antiracism), and inclusive capitalism. With the shift to virtual meetings and remote work, he
had nearly 50 speaking engagements, telling the TIAA story and engaging with clients and key stakeholders
on campuses, at conferences, and in association meetings, both in-person early in the year and then
virtually. His activities supported the Company’s efforts to grow the business and enhance the customer
experience it delivers to clients.
Mr. Ferguson’s social media engagement grew tremendously on LinkedIn, with more than 59 posts
published on the channel, which resulted in a 60% increase in followers and more than 1.4 million
impressions and nearly 29,000 engagements.
Mr. Ferguson also continued to invest time in building and strengthening TIAA’s relations with policymakers,
trade associations, and regulators at both the state and federal levels on TIAA’s response to the COVID-19
pandemic. When faced with the worst municipal market conditions since the financial crisis, he oversaw the
Company’s advocacy to lawmakers and regulators for the inclusion, passage and implementation of a
municipal bond liquidity facility through the Coronavirus Aid, Relief, and Economics Security Act.
Mr. Ferguson participated in a number of external activities relevant to TIAA’s business and clients. He
continued to serve as co-chair of the American Academy of the Arts and Sciences’ Commission on the
Future of Undergraduate Education, and on the New York State Insurance Advisory Board, the Smithsonian
Institution Board of Regents, and the American Council of Life Insurers, among other organizations.
Promoting I&D intensified as a focus for Mr. Ferguson, both internally and externally, and TIAA was once
again recognized as a top company for I&D by a number of external groups:
100% Corporate Equality Index Rating, The Human Rights Campaign Foundation
Top 50 Companies For Diversity, DiversityInc
100 Best Companies for Working Mothers, Working Mother magazine
Compensation disclosures 18Executive compensation—Compensation discussion and analysis
Glenn R. Richter, SEVP and CFO
Responsibilities: Mr. Richter served as Chief Financial Officer of TIAA, and was responsible for the financial
stewardship of the enterprise. He oversaw TIAA’s financial management, including planning, reporting,
accounting, tax, and actuarial, and he had oversight of Corporate Strategy and Development and General
Account investment strategies. Additionally, Mr. Richter oversaw corporate service functions, including real
estate and facilities management, physical security, enterprise vendor risk management, and strategic sourcing.
Mr. Richter announced his resignation from the Company on March 2, 2021 to pursue other opportunities. He
resigned his position of CFO effective May 17, 2021 and will stay on in the role of SEVP, Advisor to the CEO
through July 31, 2021 to ensure a successful transition of his responsibilities.
2020 Performance Highlights:
Under Mr. Richter’s leadership, TIAA was strongly positioned to withstand the financial pressures of the
COVID-19 global pandemic; maintaining strong capital and risk-based capital (“RBC”) positions (21
percentage points favorable to plan) and a $1.25 billion surplus note issuance. TIAA also grew AUM/A,
experienced positive net flows and was able to keep expenses in line with expectations all while maintaining
strong customer service levels.
Mr. Richter continued the successful delivery of the annual productivity program to ensure year-over-year
cost savings so TIAA can continually invest in programs, technologies and product offerings, as well as
strengthen capital, so that, ultimately, it can deliver strong outcomes for our clients. Through this program,
despite the pandemic, the organization continued in 2020 to realize a 3% year over year reduction in on-
going operating expenses.
He began the execution and implementation of a multi-year initiative to improve the Company’s financial
systems, focusing on an integrated solution that leverages the latest technology to improve our processes
and accelerate decision-making.
Mr. Richter continues to focus on strengthening competencies and creating efficiencies by centralizing
reporting and analytics within the Nuveen, TIAA Bank, and TIAA finance functions. Implementing deeper
models and analysis to inform business strategy.
He began the implementation of the Charlotte campus and New York office modernization efforts as well as
realizing rent and occupancy savings by not renewing leases at 57 locations where space was no in
alignment with TIAA’s ongoing workspace strategy.
Mr. Richter continues to oversee the development of an economic view of capital that aligns with industry
best practices, which will assist the Actuarial team and TIAA in making strategic business decisions relative
to investment risk appetite and will complement traditional metrics such as RBC and Potential Capital at
Risk.
He completed his second year as the executive sponsor of TIAA’s Empowered (African American and
Caribbean) Business Resource Group, which includes nearly 1,000 associates; the group delivered several
events in 2020 to promote I&D enterprise-wide.
Compensation disclosures 19Executive compensation—Compensation discussion and analysis
Jose Minaya, SEVP, CEO Nuveen
Responsibilities: Mr. Minaya is the CEO of Nuveen, where he is responsible for Nuveen’s vision, strategy and
day-to-day operations. He assumed the role as CEO in January 2020 and prior to the role, he was the President
and Chief Investment Officer of Nuveen.
With $1.2 trillion in assets under management, Nuveen’s diverse investment capabilities span across a broad
range of traditional and alternative asset classes for both institutional and individual investors around the world.
In 2020, Mr. Minaya executed several key strategic initiatives while delivering strong long-term investment
excellence for our clients.
2020 Performance Highlights:
Under Mr. Minaya’s leadership, Nuveen continued to deliver investment excellence. Investment
performance remained strong with 71% of rated asset either 4 or 5 stars by Morningstar as of December
2020. Nuveen’s investment teams were recognized with several industry awards such as the Lipper Best
Mixed Assets Large Fund Company Award for an unprecedented fifth year in a row, Fund Manager of the
Year & Lender of the Year at UK Property Awards, and the 12th consecutive Energy Star award.
Despite the market volatility and persistence of ongoing industry pressures, Mr. Minaya continued to grow
and diversify the business with net flows increasing over 10% versus prior year as Nuveen executed on its
growth strategy. Nuveen’s total organic growth rate of 2% exceeded public peer average, which saw a
reduction of 3%.
Mr. Minaya led several transformational initiatives to best position Nuveen for future growth which included:
Continuing to diversify clients through strategic focus on global expansion efforts resulting in key
client wins, a strong sales pipeline and record capital raised.
Transforming Nuveen’s US Wealth distribution by deepening advisor relationships with a focus on
discretionary mandates, product penetration, and client experience and engagement via data and
digital capabilities.
Continuing to evolve the investment platform by integrating Symphony Asset Management with
Nuveen’s Fixed Income capabilities, creating a large-scaled leveraged finance offering managing
$31B across high yield credit, loans, collateralized loan obligations (“CLO”) and alternative fixed-
income strategies.
Strategically identifying investment capability gaps and evaluating potential inorganic opportunities
that align to Nuveen’s growth plans and client needs. This includes a focus on building our
infrastructure and private placement capabilities through acquisitions.
Launching new capabilities to meet investor needs such as Nuveen Dynamic Municipal
Opportunities Closed-End Fund, Nuveen Global Impact Fund and over $1B in new issue
CLO AUM.
Extending our leadership in RI with key activities such as systematically integrating financial ESG
factors into our investment process for 100% of Nuveen’s AUM, and promoting awareness and
action by engaging with US and global regulators on ESG policies and standards. Nuveen received
A+ / A scores on United Nations Principles of Responsible Investment assessments which is above
peer median and ranked #1 US asset manager voting record on climate.
Compensation disclosures 20You can also read