Complex Migration Trends from Latin America and the Caribbean Amidst the Global Pandemic - Manuel Orozco and Mariellen Jewers Center for Migration ...
←
→
Page content transcription
If your browser does not render page correctly, please read the page content below
Complex Migration Trends from
Latin America and the Caribbean Amidst
         the Global Pandemic

            Manuel Orozco and Mariellen Jewers
       Center for Migration and Economic Stabilization
              Creative Associates International
                      September 2021
Complex Migration Trends from Latin America and the Caribbean
Amidst the Global Pandemic1
Introduction
The nature, composition, and scale of migration in the Americas has changed dramatically from 2019 to
now. Migration flows to the United States have doubled to nearly 2 million people. This inflow to the
United States is composed of migrants from Mexico, Central America—with significant increases from
Nicaragua—and Ecuador as well as refugees from Venezuela, Cuba and Haiti.
The sustained increases in the past two years are exceptional, given that migration inflow to the United
States in 2019 was substantial. Separate from the United States, outmigration is growing between
countries in the region.
Amidst the global pandemic, migrants—particularly from Venezuela and Haiti—are going to Colombia,
Chile, and Brazil. The root causes of current migration are more complex and include political crises,
economic insecurity, violence, weak social protection systems, COVID-19 contagion, low vaccination rates,
and natural disasters.
However, successfully addressing solutions to the increasing numbers of migrants into the United States
and other countries within the LAC region will require interventions that can have a regional as well as a
country-by-country approach.
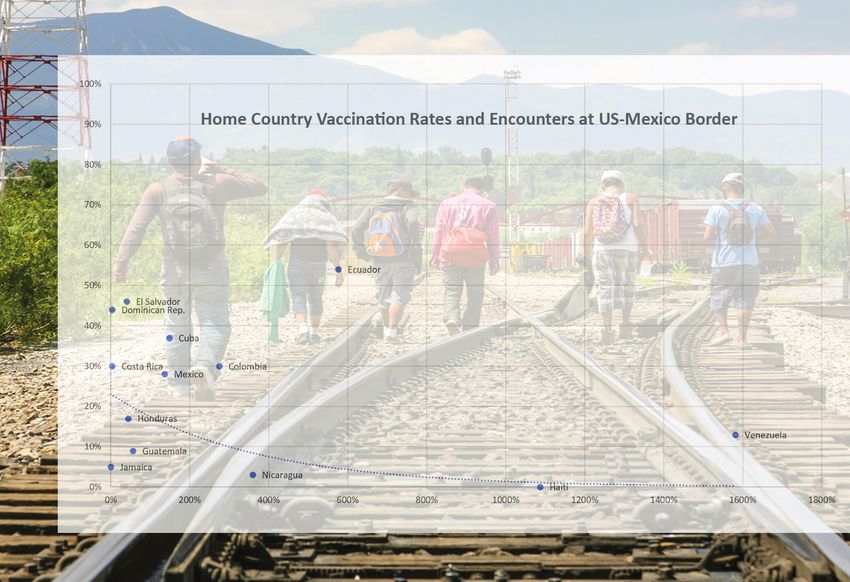
Table 1: Migration and Social and Economic Indicators
Percentage Growth Share of Population
Aprehensions Global
/Encounters Per Covered by Health
Apprehensions Vaccinat
Country at US Border Remittances Capita Social Index
at US Border ed
Income Insurance
2021 2019-21 2020-21 2019-21 2021 2021 2021
Colombia 6000 274% 36% -12% 30% 9% 44
Costa Rica 250 3% -3% 30% 20% 45.1
Cuba 35,000 148% -18% 37% NA 35
Dominican Rep. 3,000 3% 28% -7% 44% 7% 38.3
Ecuador 98,000 576% -9% 54% 11% 50.1
El Salvador 140,000 40% 30% -4% 46% 6% 44.2
Guatemala 440,000 56% 30% 2% 9% 4% 32.7
Haiti 33,600 1087% -8% 0% 1% 30
Honduras 389,000 44% 25% -4% 17% 3% 27.6
Jamaica 1,000 0% 15% -12% 5% 40% 57.6
Mexico 575,000 136% 23% -12% 28% 5% 35.1
Nicaragua 60,000 359% 15% -1% 3% NA 23
Venezuela 46,468 1581% -24% 13% 7% 29
1
Manuel Orozco and Mariellen Jewers, Center for Migration and Economic Stabilization, Creative Associates,
Washington, DC 2021.
1Source: https://www.nytimes.com/interactive/2021/world/covid-cases.html [week of Sept 6]; Global Health Security Index,
https://www.ghsindex.org/report-model/; World Bank Dev. Indicators; https://www.cbp.gov/newsroom/stats/nationwide-
encounters.
Mexican migration, a new wave in the making?
Mexican migration had slowed down since 2005 (See Table) and it showed a sudden increase since 2020.
Mexican immigrants in the United States have been staying longer, which partly explained larger increases
in remittances from the United States despite slowed migrant entry during this period. However, in 2021,
the number of encounters at the US border of Mexicans attempting to enter the country doubled, nearing
the number of apprehensions in 2010. It is important however to point out that the ‘migrant recidivism’
rate among Mexicans was highest to an average of 30% against 15% in 2019 and 26% in 2020. 2
Table 2: Characteristics of Mexican Immigrants in the U.S. and Mexican Migration to the U.S., 2010-21
Immigrants in United States Irregular Migration Non-immigrant Visas
Share 20+ Legal
Year Ave Yrs Border Irregular H1-B, H2-A,
Total yrs living Migration
in US Apprehensions Entries H1-B2 H2-B
in US
2010 12,168,662 12 30% 632,034 94,805 66,956
2015 11,643,298 16 267,885 48,219 82,323
2018 11,500,000 17 40% 252,267 45,408 962,888 242,582 79,678
2019 11,489,684 19 44% 254,595 45,827 1,042,961 261,097 54,780
2020 11,489,684 20 48% 297,711 53,588 625,726 244,109 29,242
2021 11,600,000 20 48% 578,000 108,000 30,000
Source: UNDESA, DHS, Orozco, Manuel. In the Cusp of Change, 2016. A Commitment to Family: Remittances and Covid-19, June
2021.
Because a majority of migrants start sending money on the same year they arrive, remittance transfer
data serve as reasonable proxies for identifying geographic shifts in migration. Remittance data offer
important insight, first to the effect that the flow of money is not evenly distributed and second, that is
not trending its regular pattern—that is not going to the same states as in previous years. From 2020 to
2021, remittance flows grew more than 9 percent to the states of Tabasco, Mexico City, Coahuila and
Zacatecas. Other states like Durango, Yucatan, Sonora, Aguascalientes, Quintana Roo, Nuevo Leon and
Guanajuato saw growth in transfers between 2 percent and 4 percent.
It is difficult to discern what may explain these shifts in Mexican outmigration. In examining the
relationship between key indicators (e.g. COVID-19 cases, state GDP, formal job creation, homicides, and
size of the informal economy), the growth in remittance flows corresponds largely to COVID-19 cases per
state, as opposed to job performance or productivity.
Table 3: Growth in Remittances, by Mexican State, 2020 - 2021
Remittance Growth
State
2020-2021
Tabasco, Mexico City, Coahuila, and Zacatecas Over 9%
2
The recividism rate may be associated with the pandemic event and border closures.
https://www.wola.org/2021/06/weekly-border-update-cbp-data-points-to-a-rise-in-migrants-from-other-
countries/
2Durango, Yucatan, Sonora, Aguascalientes, Quintana Roo, Nuevo Leon and 2% to 8%
Guanajuato
Chiapas, Colima, Hidalgo (30% of all migrants) 1% growth
Tamaulipas, Jalisco, Campeche, Oaxaca, No growth
Morelos, Tlaxcala, Veracruz, Querétaro, Nayarit, Estado de México, San Luis Negative growth, remittance
Potosí, Baja California, Chihuahua, Baja California Sur, Michoacán, Sinaloa, decline between -1, -4%, Puebla
Puebla (42% of all migrants) -14%
Source: Central Bank of Mexico
Central American Migration
Migration from Central America is also showing what could represent a historic high outflow. The
projected outmigration amounts to one million people based on surveys showing a large percent of
citizens intend to migrate. A 2019 study by Creative Associates showed that 25 percent of people from
these countries have considered emigrating. In 2021 in El Salvador the number increased from 24 percent
to 36 percent. 3
Table 4: Migration Trends of Central Americans
Households with individuals with an intention to migrate
El Salvador Guatemala Honduras Nicaragua CAM countries
2021 544,500 430,000 575,000 560,000 2,111,521
Total outmigration estimate =
(legal entry + irregular border crossing, + apprehensions + overstays)
2021 139,927 388,239 444,799 65,331 1,038,297
Share between the intention and actual outmigration
26% 90% 77% 49%
A. Legal permanent status arrivals
El Salvador Guatemala Honduras Nicaragua Three countries
2,018 16014 9188 6997 1,972 32,199
2019 10,605 5,479 6,045 2,248 22,129
2020 5,343 2302 2,250 1,077 9,895
2021 est. 7,500 3500 4000 500 15,500
B. Non-immigrant visa of foreign labor entry (2019)
H2A 157 2537 306 3,000
H2B 653 3269 829 4,751
C. Irregular entry estimates
2018** 4,798 35,390 23,772 500 84,166
2019 9,721 26,123 26,123 1,600 64,165
2020* 14,000 8,000 2,500 22,000
2021 est. 13,406 39,170 44,967 6,649 104,192
3
Orozco, Manuel. Survey of El Salvadorans about their intention to migrate. Forthcoming, October 2021.
3D. Apprehensions
2018** 41,981 161,845 116,845 3,000 320,671
2019 85,059 228,575 228,575 14,000 561,446
2020* 21,051 61,488 52,594 3,000 135,133
2021 est. 117,305 342,737 393,460 58,182 911,683
E. Visa Overstayers***
2019 3,432 5,664 4,745 2500 13,841
2021 est. 1716 2832 2373 500 6,921
Note: US Visa Statistics, https://travel.state.gov/content/dam/visas/Statistics/AnnualReports;
https://travel.state.gov/content/travel/en/legal/visa-law0/visa-statistics/nonimmigrant-visa-statistics.html. * as per survey
respondents that 0.9% and 1% of their relatives went to the US. **surveys on migrants in the US point that 2.5% arrived the
same year they were interviewed. ***Between 0.6 and 5% of Latin American and Caribbean migrants overstay
https://www.dhs.gov/sites/default/files/publications/20_0513_fy19-entry-and-exit-overstay-report.pdf, for 2021 with the
travel restrictions in place, a maximum equivalent to 50% of 2019 travelers is considered as overstayers. Intention to migrate:
Saliendo Adelante.
Generally, people who have considered migrating reported being exposed to tough economic situations
and have been victimized to a greater extent than those who had not considered emigrating. They also
have larger have transnational family ties than those who have not thought about migrating. 4
Across the region, the individual experiences and characteristics associated with thoughts of migrating
include being young, living in a low-income household, being a low skilled or informal worker, being
unemployed, being a skilled worker with at least a high school education, having an unfavorable outlook
on the future economic situation, having been victimized, and having transnational ties. Youth are twice
as likely to consider migrating than their older counterparts. 5
A range of economic issues influence whether residents from these countries consider migrating. Living
in a household earning less than $400 a month that can’t make ends meet makes people 1.24 times more
likely to consider migrating. Believing that conditions are worse off today than they were last year makes
people 1.67 times more likely to think about migrating. Labor market conditions also matter. Regarding
transnational ties, having a relative abroad does not make a person more likely to think about migrating
but receiving remittances does. In all three countries, receiving remittances has greater statistical
significance than having a relative abroad. However, the statistical interaction 6 between receiving
remittances and having a relative abroad is significant and yields a 71 percent chance that the person has
thought of migrating. In the case of Honduras, the intention to migrate correlates with having had a
property destroyed from Hurricane Eta.
Amidst this regional trend there is an unprecedented wave of migration taking place from Nicaragua. An
estimate of the size of Nicaraguan migration to the US may be at least 60,000 people, including border
apprehensions, visa overstayers, and legal migration. Another 40,000 will go to Costa Rica this year. This
adds to a growing outmigration trend that is likely to continue, based on 2021 survey findings that 35
percent of Nicaraguans intend to migrate.
4“Saliendo Adelante: Why migrants risk it all,” www.saliendo-adelante.com
5
Source: Creative Associates, 2019, “Saliendo Adelante: Why migrants risk it all,” www.saliendo-adelante.com
6In statistical analysis, two variables interact when a particular combination of variables yields results that would not be anticipated
based of the main effects of those variables.
4Figure 1. Intention to migrate from Nicaragua
40% 35.80% 34.40%
30%
19%
20%
10%
0%
Dic. 2019 Julio 2020 Abril 2021
Emigrar
Orozco, Manuel. Survey of 700 Nicaraguans, April 2021. June 2020; December 2019.
People’s desire to migrate is shaped by their views of Nicaraguan politics and the continued deterioration
of the economy. Nicaraguans’ personal incomes have stagnated for four years and are roughly the same
as 2017 levels. Looking at survey data from April 2021, the intention to migrate increases among those
who are unemployed, are working in the informal economy, who think the economic crisis is the main
problem in the country, and who cannot make ends meet. 7 In addition, however, those who think there
will be fraud in the elections, and believe that human rights violations and bad government are the main
problem in the country, are more likely to migrate. 8
Venezuelan Migration: Continuity in the Midst of the Pandemic
Despite the pandemic, outmigration from Venezuela increased by 11 percent from March 2020 to
September 2021. 9 Large outmigration from Venezuela, both before and during the pandemic, has been
driven by economic hardship, including food insecurity and unemployment. 10 Data available in 2020
revealed that 97 percent of Venezuelan households are food insecure, with food and fuel becoming even
more scarce during the pandemic. 11 As of June 2021, the Venezuelan Industries Confederation
(CONINDUSTRIA) registered eight consecutive years of negative production, averaging 30.6% decrease in
productivity index from 2012. 12
The pandemic has left a majority of businesses (large and small) without access to diesel and functioning
at 20 percent capacity. Unfortunately, policies to stop the spread of COVID-19 have seriously limited or
eliminated regular pathways for migration available to Venezuelans before the pandemic.
Pathways for Venezuelan migration within the region have changed from June 2020 to September 2021
(Table 1). Colombia experienced a decline of migrants from Venezuela. In 2020, despite exceptionally low
numbers of migrants for several months due to border closures, Colombia experienced a net increase in
7
The odd of migrating increase 2, 1.5, 1.2, and 6 times over these respective economic issues.
8
The odds of migrating among them are 1.5, 2 and 1.4 times over those who think otherwise.
9
Calculations based on data from Refugiados y migrantes de Venezuela | R4V
10
Venezuelan immigrants in Colombia_Final_ONLINE.pdf
11
Effect of Remittances on Food Security in Venezuelan Households | Publications (iadb.org); Venezuela:
Temporada de mangos | Internacional | EL PAÍS (elpais.com)
12
Adán Celis, presidente de Conindustria: Aprobación de plan de vacunación y eliminación del esquema 7+7
permitirá reactivar parte de la producción industrial - Conindustria
5Venezuelan migrants. This trend reversed from January to July of 2021; Colombia experienced a net
reduction in migrants from Venezuela, with more migrants leaving than entering the country. At the same
time, there was a 102 percent increase in migrants refused from entering Colombia at the border. 13 Peru,
followed by Ecuador, now host much larger shares of Venezuelan migrants than in June of 2020. The
sustained migration to Peru—despite rising xenophobia, policing and obstacles to economic integration—
supports that outmigration is driven by the persistent and desperate economic situation in Venezuela. 14
Table 5: Regional Migration, June 2020 and September 2021
VENEZUELANS VENEZUELANS GROWTH JUNE SEPT 2021
REPORTED BY REPORTED BY JUN - SEP SHARE BY SHARE BY
RV IN JUN-20 RV IN SEP-21 2021 COUNTRY COUNTRY
COLOMBIA 1,790,644 1,742,927 -3% 42% 38%
PERU 829,677 1,049,970 27% 19% 23%
CHILE 455,494 457,324 0% 11% 10%
ECUADOR 362,901 451,093 24% 8% 10%
BRAZIL 263,445 261,441 -1% 6% 6%
ARGENTINA 179,069 173,248 -3% 4% 4%
PANAMA 121,072 121,598 0% 3% 3%
DOMINICAN REPUBLIC 96,625 114,050 18% 2% 2%
MEXICO 73,115 102,223 40% 2% 2%
COSTA RICA 29,813 29,906 0% 1% 1%
OTHER 103,143 112,782 9% 2% 2%
Source: R4V https://www.r4v.info/es/refugiadosymigrantes, Evolución de las cifras en los 17 países r4v. Growth and share
calculations are authors’. Total for June 2020 from data graphic was 4,304,998 and for September 2021 is 4,616,562.
Migration trends suggest that migrants are using Colombia as a point of departure to other destinations.
There were 12,386 more Venezuelan migrants exiting than entering Colombia from June 2020 to
September 2021. While we have no specific data on destination of the migrants exiting from Colombia, it
is unlikely that they are returning to Venezuela. 15
The trend of migration from Venezuela to the United States seems to have changed considerably from
2020 to now. Venezuelans have experienced that largest increase in apprehensions at the United States’
border, with an increase of 1,058 percent. Nevertheless, as a share of total migration to the United States.
Haitian Migration, between Assassinations and Earthquakes, Migration Increases
Migration from Haiti is driven by persistent poor economic growth and social systems punctuated by
recurrent political crisis and natural disasters. By most measures Haiti is arguably the most fragile state
within the region and is thirteenth most fragile state as ranked by the Fund for Peace. 16 During the
13
Comparison of the 2020 total migrants and the number of “inadmision” for 2020 and 2021 on Migracion
Colombia. Flujos Migratorios - 2021 | Tableau Public and Flujos Migratorios - 2020 | Tableau Public
14
Venezuelans Can Bolster Economic Recovery and Stability in Peru amid COVID-19 | Center For Global
Development (cgdev.org); https://www.latimes.com/espanol/internacional/articulo/2021-02-06/preocupacion-
por-delincuencia-en-peru-afecta-a-venezolanos
15
Where Are Venezuelan Migrants and Refugees Going? An Analysis of Legal and Social Contexts in Receiving
Countries - The Center for Migration Studies of New York (CMS) (cmsny.org)
16
Global Data | Fragile States Index; Migration-Patterns-and-State-Fragility.pdf (thedialogue.org)
6pandemic, Haitians continued to move to the Dominican Republic in a regular fashion as in previous years.
However, to other countries, the mobility has increased. In the first half of 2021, an estimated 25,000
Haitian migrants reached Colombia as a point of transit; the majority were on their way to Panama. 17 The
number of people choosing irregular migration into Chile, Colombia and Panama are reaching numbers
comparable to post-earthquake 2010. While many Haitian migrants that enter Chile remain in the country
at least for some time, Colombia and Panama are transit points for migrants on a northward journey.
Haiti is dependent on remittances, which reached 3.8 billion dollars in 2020.18 For every ten dollars
remitted back to Haiti in 2020, at least eight came from the United States. In line with remittances, the
United States remains the primary destination for Haitian migrants.
Haitian migration in the past three years has been characterized by a reduction in visa pathways and
increase in border apprehensions. From 2018 to 2019 immigrant and nonimmigrant visas for Haitians
declined by 35 percent and they declined even further (50%) from 2019 to 2020. At the same time,
apprehensions between 2019 and 2021 increased by 1,087 percent. Irregular migration began to swing
upwards at the same time of swelling unrest in Haiti, which later culminated in the presidential
assassination on July 7, 2021. Within one month, Haiti was struck by the deadliest natural disaster in the
country since the 2010 earthquake.
While data for August and September is not yet available, experiences from 2010 would suggest a further
increase in outmigration because of the August 2021 earthquake. As in 2010, where Brazil was a major
destination for Haitians who worked on the construction for the 2016 Olympics, the United States, Chile
and the Dominican Republic are now a key economic destination for Haitians. With the combined crises
facing Haiti, those who enter the United States through the border may be applying for asylum status.
A Cuban exodus in the middle of a pandemic?
Although the United States is the destination for most Cuban migrants, hosting more than 80 percent of
all Cuban migrants worldwide, the growth of irregular migration to the US as well as to other countries
signal a shifting pattern.
The concentration of Cubans in the United States can be largely attributable to the longstanding
preferential treatment for Cubans within U.S. immigration policy. While U.S. policies have changed, the
United States remains the primary destination for sustained outmigration from Cuba.
Economic indicators suggest persistent poor economic opportunity. Based on private data sources,
remittances account for 5 percent of Cuba’s GDP. Following mismanagement of vaccine roll-out and
health system failures to attend infected persons, surging civil unrest has only added to the number of
people leaving Cuba.
17
Miles de migrantes haitianos permanecen varados en la frontera entre Colombia y Panamá | Internacional | EL
PAÍS (elpais.com)
18
Global-Flows-of-Family-remittances.pdf (creativeassociatesinternational.com)
7Table 6: Cuban Migration
Year Puerto Rico Spain USA WORLD USA Spain Puerto Rico
1990 19,579.00 21,854.00 736,971.00 835,796.00 88% 3% 2%
1995 19,293.00 28,314.00 815,617.00 935,463.00 87% 3% 2%
2000 19,054.00 45,738.00 894,876.00 1,049,761.00 85% 4% 2%
2005 17,039.00 71,614.00 959,480.00 1,162,586.00 83% 6% 1%
2010 12,882.00 103,189.00 1,055,229.00 1,313,321.00 80% 8% 1%
2015 13,321.00 131,134.00 1,210,674.00 1,507,660.00 80% 9% 1%
2019 13,645.00 141,447.00 1,337,371.00 1,654,684.00 81% 9% 1%
Source: UNDESA
In fact, Cubans’ immigration pathways to the United States have changed dramatically since the
termination of the “wet foot, dry foot” policy and limitations to the Cuban Adjustment Act. 19 Between
2019 and 2021, there has been a rise in irregular migration among Cubans, which is largely a reflection of
the major shifts in opportunities for Cubans to immigrate to the United States made in 2016 and 2017. 20
In 2018 there were just over 2,000 apprehensions, increasing to 14,136. This year the number of Cubans
encountered at the US-Mexico border will reach more than 35,000 people.
When Resilience is Depleted in Fragile States: Some Reflections
The number of people migrating amidst a global pandemic is alarming.
The intense growth of migrants from Mexico, Venezuela, Cuba and Haiti are culminating in historically
high levels of irregular migration into the United States and other countries in the Latin American and
Caribbean region. 21 Migration to Chile, Colombia, Costa Rica, the Dominican Republic, Panama or Peru,
highlights an immediate humanitarian concern. However, the effects of the current wave of migration will
require ongoing attention as migrants settle in their new homes and attempt to reunite their families.
More than half of Venezuelans in Colombia say that they would stay and would bring their relatives at
some point. 22
Whether this inflow to the US and other countries may be temporary in some cases or 2022 will exhibit a
similar pattern, a humanitarian and economic response in the short-term is important given the severity
of conditions in which many of those migrant home countries are facing. These issues raise new
complexities in international migration from Latin America and the Caribbean.
Addressing these complexities means bringing existing strategies, expanding and complementing them
with additional approaches. It is important to bear in mind that these flows come from predominantly
fragile states, countries whose resilience capacity has been exhausted and are now suffering severe crises
19
Microsoft Word - CORREA SPAGAT PUBLICATION V.5.docx (wilsoncenter.org)
20
Migration from Fragile States PPT
21
The figures for 2021 control for ‘recidivism’; the increase of repeat encounters, that is people who have
been apprehended or encountered at least once more within one year above 20% up from 14% from previous
years, still points to a large inflow. https://www.cbp.gov/newsroom/national-media-release/cbp-releases-july-
2021-operational-update
22
Orozco, Manuel. Venezuelan Immigration Trends, Challenges, and Possibilities for Integration, 2021.
8or even collapsed health and economic systems. To that effect, is important to explore immediate
solutions.
First, a humanitarian response is urgently needed to address this outflow and inflow, an effective
humanitarian response would be best fashioned to provide short-term relief in coordination with
intervention that address the root causes of migration outlined in the Biden Administration strategy for
the region.
The humanitarian approach includes extending vaccine relief to home countries where large migration is
taking place or to host countries where migrants feel the need to move out because options for
vaccination in those places are very low. 23 Short-term solutions may deal with extending temporary
protected status to those arriving in host countries, such as the United States.
The increased numbers of people moving to the United States may also reflect that they are coming from
third countries after realizing conditions are not adequate for their wellbeing, in the absence for example
of vaccines or secure employment opportunities.
Second, in this light, a critical aspect to stemming growth in migration is to extend solutions proposed by
the Biden Administration for the Northern Triangle countries to other countries like Nicaragua and Haiti.
It is important to extend the US migration management approach the Dominican Republic, Mexico, Costa
Rica, Panama, Colombia, Peru and Chile. These solutions would leverage the positive capacity of migration
and stem social backlash to immigration flows, particularly given the stress to social and health safety nets
created by the pandemic.
23
In most migrant host countries in Latin America and the Caribbean, vaccine access to migrants starts with those
with regular legal status, then extended to those in irregular status going to the bottom of the line in some cases.
9You can also read