Concordia Station, Antarctica - Un viaggio nel clima che cambia(mo) - CAI Nov 2017
←
→
Page content transcription
If your browser does not render page correctly, please read the page content below
11/29/17

             Un viaggio nel clima che cambia(mo)

                                                            Carlo Barbante
                                                            IDPA-CNR, Ca’Foscari University of Venice
photo credit: L. Poto

                        Concordia Station, Antarctica
                    Daily (gray) and mean monthly (black) 2-m air temperature from the
                    AWS installed by the Antarctic Meteorological Research Centre of the
                    University of Wisconsin-Madison, placed 1.5 km away from the
                    Concordia station

                                                    2008-2014

                        Mean temperature: -51.1 C    Max temperature: -14.4 C
                        Min temperature: -81.1 C

          Stenni, pes comm. 2017

                                                                                                              1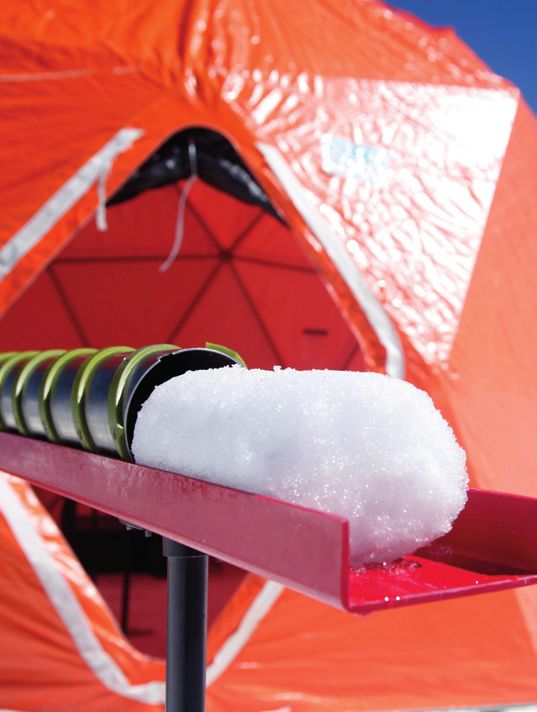
11/29/17

                                                     Piana di Marcesina
                                                                     01-05 Jan 2009
                                                                                                    Buson

                   Min temperature: -40.3 C

                   Bruno Renon, ARPAV, 2017, pers comm.

                                                   Temperature Anomaly ( C)

                           1.0
Temperature Anomaly (°C)

                           0.8

                           0.6

                           0.4

                           0.2

                           0.0
                                                                                      1951-1980

                           -0.2

                                  1960             1970             1980       1990   2000   2010    2020
                                                                             Year

                   NASA's Goddard Institute for Space Studies (GISS), 2016

                                                                                                                  2
11/29/17

Temperature anomalies in the Northern Hemisphere
               (1000 -2010 AD)

 IPCC, 2013: Summary for Policymakers. In: Climate Change 2013: The Physical Science Basis.

                               Climate Change

IPCC, 2013: Summary for Policymakers. In: Climate Change 2013: The Physical Science Basis.

                                                                                                    3
11/29/17

CO2 Concentration (ppm)       CO2 Record Mauna Loa Observatory, Hawaii

                      NOAA ESRL 2016    http://www.co2levels.org

                              Ice Mass Loss and Sea Level Rise

                      IPCC, 2013, Fig TS.3

                                                                               4
11/29/17

               Sea Level Rise

                +63 cm

                                IPCC 2013, TFE.2, Fig. 2
                +19 cm

  IPCC, 2013

Space and time …

                                                                 5
11/29/17

                The last 500 million years

       Primates diverged from                                 Homo Erectus
       other mammals (85 Myr)                                 about 1.5 Myr

                                                  Homo Habilis                Homo Sapiens
                                                  about 2.8 Myr               about 350 kyr
                                  Humans separated
                                  about 7.5 Myr

     Royer, 2004, Zachos, 2008, Lisieki and Raymo, 2005, EPICA (2004)

                        The ice core record
   • One of many sedimentary records
   • Very good at recording the atmosphere
   • 800,000 years (Antarctic) and 128,000 years (Greenland)

                                                                         Flow lines
Accumulation zone

Ablation
zone

                                                                        Bedrock

                                                                                                    6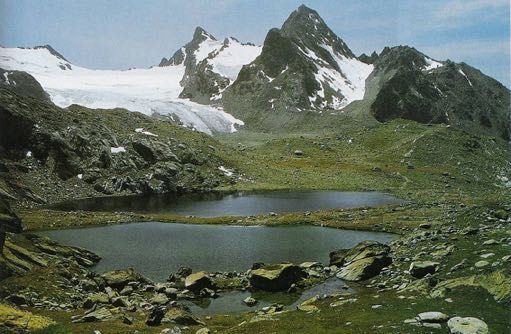
11/29/17

               Snow and ice as archives
§ Ice cores are the key palaeorecord for
  the atmosphere
§ Climate and forcing factors in the
  same record
§ Well resolved
§ But mainly limited to polar regions

                                                 7
11/29/17

   Processing

                                          The Colle Gniffetti firn/ice core

                                           ü Italian-Swiss border
                                           ü 4455 m a.s.l.
                                           ü 2 parallel cores (80.2 m)

J. Gabrieli et al., Atmos Environ. 2011

                                                                                    8
11/29/17

    Cold War pollutant

                                            Tsar bomb, Arctic Siberia; 30 October 1961

                                            57 Mton (more than 5 times the total
                                            amount of traditional explosives during
                                            2 World War)

                                            Blast at 4000 m a.s.l.; nuclear mushroom
                                            cloud high about 60 km

239Pu         profile in the Alps

 J. Gabrieli et al., Atmos. Environ. 2010

                                                                                               9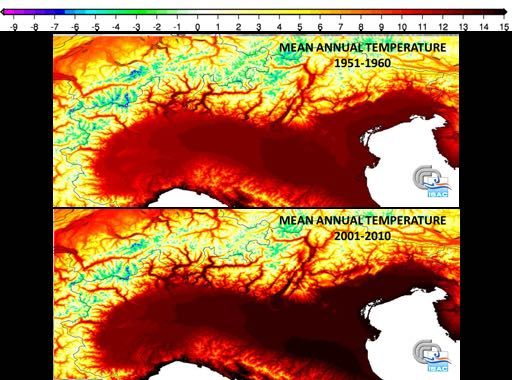
11/29/17

                       EPICA ….
                -380
  ! DδD(‰)
        (‰)

                -400

                -420

                -440

                                                                                                                                                     900

                                                                                                                                                           CH4CH
                                                                                                                                                     800

                                                                                                                                                               (ppbv)
                                                                                                                                                     700

                                                                                                                                                           4
                                                                                                                                                                 (ppbv)
                                                                                                                                                     600

                                                                                                                                                     500

                                                                                                                                                     400
                300
     2 (ppmv)

                280

                260
 CO (ppmv)

                240
 CO
          2

                220
                200

                180

                       800         700             600            500             400             300            200             100             0

                                                                        AgeAge
                                                                            (ka(ka)
                                                                                    BP)

                 Wolff et al. 2006, Jouzel et al., 2007, Lüthi et al. , 2008, Loulergue et al., 2008, Schilt et al., 2009; Stenni et al., 2010

                CO2 vs Temp. the long time perspective

CO2 400 ppmv

                 Zhang et al., 2013; Zachos et al., 2008

                                                                                                                                                                               10
11/29/17
0 Temperature and CO2
ΔTemp. ( C)
-5
pdf
-10
280
CO2 (ppmv)
230
180
800.000 600.000 400.000 200.000 0
Years
Where are we going ?
Summary for Policymakers
(a) Global average surface temperature change
Mean over
6.0
2081–2100
historical
RCP2.6
4.0
RCP8.5
39
SPM
(oC)
2.0
RCP8.5
RCP6.0
42
RCP4.5
0.0 32
RCP2.6
−2.0
1950 2000 2050 2100 A new set of scenarios,
the Representative
(b) Northern Hemisphere September sea ice extent
10.0 Concentration
8.0
39 (5) Pathways (RCPs) have
been proposed
(106 km2)
6.0
29 (3)
4.0
2.0 37 (5)
0.0
RCP2.6
RCP4.5
RCP6.0
RCP8.5
1950 2000 2050 2100
(c) Global ocean surface pH
IPCC, 2013: Summary for Policymakers. In: Climate Change 2013: The Physical Science Basis.
8.2 12
9
(pH unit)
8.0
RCP2.6
RCP4.5
10
RCP6.0
7.8
RCP8.5
7.6
1950 2000
Year
2050 2100
11
Figure SPM.7 | CMIP5 multi-model simulated time series from 1950 to 2100 for (a) change in global annual mean surface temperature relative to
1986–2005, (b) Northern Hemisphere September sea ice extent (5-year running mean), and (c) global mean ocean surface pH. Time series of projections
and a measure of uncertainty (shading) are shown for scenarios RCP2.6 (blue) and RCP8.5 (red). Black (grey shading) is the modelled historical evolution
using historical reconstructed forcings. The mean and associated uncertainties averaged over 2081−2100 are given for all RCP scenarios as colored verti-
cal bars. The numbers of CMIP5 models used to calculate the multi-model mean is indicated. For sea ice extent (b), the projected mean and uncertainty
(minimum-maximum range) of the subset of models that most closely reproduce the climatological mean state and 1979 to 2012 trend of the Arctic sea11/29/17
- Carlo Barbante -
Alpine temperature anomalies
M. Brunetti, ISAC-CNR, 2015 – Personal Communication
- Carlo
Glacial Ice Loss Around theBarbante
World -
IDPA-CNR, Venice, Italy
0 University of Venice Ca’Foscari, Italy
‐2000
cumulativve mean annual masss balance (mm w.e.)
‐4000
‐6000
‐8000
8000
‐10000
‐12000
‐14000 All glaciers
37 'reference' glaciers
‐16000 Subset of 'reference'
reference glaciers
‐18000
1980 1985 1990 1995 2000 2005 2010 2015
year
Mean cumulative mass balance of all reported glaciers
(blue line) and the reference glaciers (red line)
World Glacier Monitoring Service. www.wgms.ch
1211/29/17
1864
1912 1896
2001 2006
Mont Blanc massif, Routor and Argentiere glaciers
Rhonegletscher, 1900-2008
www.glaciers-online.net
1311/29/17
Grosser Aletschgletscher, Walliser Fiescherhörner,
1939-2010
Marmolada glacier, Dolomites
-45 m
A recent study carried out comparing geo-radar,
LiDAR and photogrammetry data revealed a net
mass loss of 5.6 million tonnes, in the time-period,
2005-2010, representing over the 25% of the total First cave / hut along the normal
mass of the glacier. alpinist path to the Marmolada
summit, escaved in 1875
1411/29/17
Long-term trend “Mer de Glace”
1895 Today
Col du Dôme (4300 m): +2,0 C warming observed in the
glacier between 1994 and 2016
Vincent, 2007, Vincent, unpublished
Expectations for the future
Saint-Sorlin glacier, France
2002
2040 2070 2090
Disappearance of Alpine glaciers below 3500 m of altitude by 2100
Le Meur, EPSL (2007)
1511/29/17
- Carlo Barbante -
IDPA-CNR, Venice, Italy
University of Venice Ca’Foscari, Italy
o Coring on selected glaciers:
• archive cores
• reference core
o Long term repositories in Antarctica
o The creation of a reference database, common
and shared, for the scientists of today and tomorrow
o The establishment of an international governance
under the aegis of UNESCO
- Carlo Barbante -
IDPA-CNR, Venice, Italy
University of Venice Ca’Foscari, Italy
1611/29/17
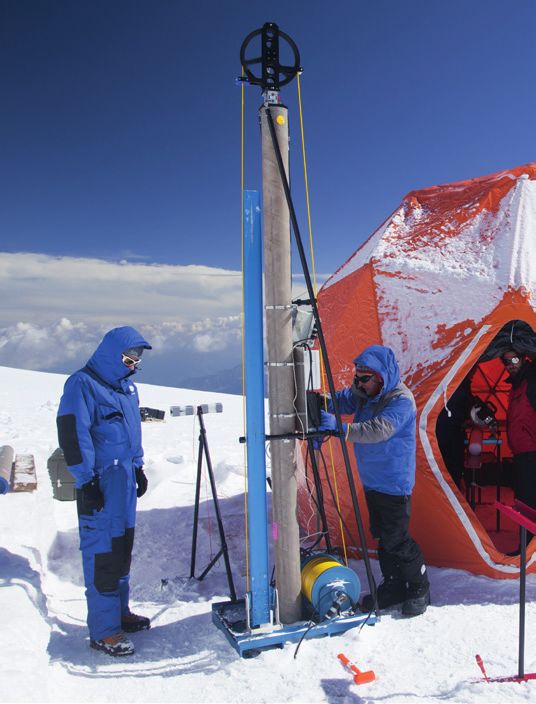
- Carlo Barbante -
Step 1: Sampling
IDPA-CNR, Venice, Italy
University of Venice Ca’Foscari, Italy
- Carlo Barbante -
Step 1: Sampling
IDPA-CNR, Venice, Italy
University of Venice Ca’Foscari, Italy
Mt. Blanc, Aug 2016, 4300m Mt. Illimani , May 2017, 6300m
- Three cores drilled - Two cores drilled
- Depth 126 m - Depth 135 m
- 2020 in Antarctica - 2021 in Antarctica
1711/29/17
Step 2: Processing & Analysis
Step 3: Transport to Antarctica
1811/29/17
Step 4: Long term storage
Dome C (Concordia Station, Italy-France)
Altitude of 3,233 metres
1,100 km from Dumont Durville
1,200 km from Mario Zucchelli
Average air temperature is −54.5 C
Step 5: The future
• New science missions: Mt. Elbrus, Altai, Grand
Combin, Tibetan plateau, Kilimanjaro, ….
• Design and build the cave in Antarctica
• UNESCO «project of decision» will be presented to
the Executive Committee in October 2017 =>
transforming IM as a full program of UNESCO
9. Encourage les Etats membres à favoriser la mobilisation de
contributions extrabudgétaires ;
10. Invite la Directrice générale de l’UNESCO à étudier l’opportunité de
proposer aux Nations Unies la création d’une Journée mondiale de
sensibilisation aux glaciers ;
• An international Ice Memory Foundation
• Support from foundations, private sponsors and
national funding agencies
1911/29/17
con il patrocinio dell’Ufficio Scolastico Regionale per il Veneto
Scienza e tecnica nell’Antropocene
Clima e sua evoluzione
30 novembre 2017, ore 9.30 - 13.00
Edificio Alfa, Campus scientifico, Università Ca’ Foscari Venezia
Via Torino 155, Mestre
Evento organizzato dall’Accademia Nazionale delle Scienze detta dei XL
in collaborazione con l’Università Ca’ Foscari di Venezia, l’Istituto per la Dinamica
dei Processi Ambientali (CNR), la Società Italiana per le Scienze del Clima e la
Fondazione Giovanni Angelini - Centro Studi sulla Montagna, con il contributo del
Consiglio Nazionale delle Ricerche
www.accademiaxl.it www.unive.it
20You can also read