Connecticut Retirement Plans and Trust Funds Investment Strategy Group - Consumer and Wealth Management - CT.gov
←
→
Page content transcription
If your browser does not render page correctly, please read the page content below

Consumer and Wealth Management

Connecticut Retirement Plans and Trust Funds

Investment Strategy Group
Consumer and
                                                                                                                    Wealth
Presenter Biographies                                                                                           Management

                 Sharmin Mossavar-Rahmani
                 Partner, Head of the Investment Strategy Group (ISG) and CIO for the Consumer and Wealth Management
                 Division
                 +1 (212) 902 – 2300
                 Sharmin is head of the Investment Strategy Group and chief investment officer for the Consumer and Wealth
                 Management Division, responsible for the overall strategic asset allocation and tactical investment strategy.
Sharmin joined Goldman Sachs as a partner in 1993. Prior to joining the firm, Sharmin worked at Fidelity Management Trust
Company, where she was chief investment officer for all separate and co-mingled fixed income accounts. Sharmin is a member of
the Board of Trustees and the Investment Committee of New York-Presbyterian Hospital and Harvard University's Global Advisory
Board. She is a former member of the Board of Trustees, and former chair of the Investment Committee of the Trinity School in
New York City. Sharmin has published two books, one on bond indexing and one on OPEC natural gas, as well as numerous articles
on portfolio management issues. Sharmin earned a BA from Princeton University and an MS from Stanford University.

                  Lisa Rotenberg
                  Managing Director, Goldman Sachs Senior Coverage Responsibility for CRPTF
                  +1 (212) 902 – 7987
                  Lisa is a managing director with senior coverage responsibility for many of Goldman Sachs’ largest institutional
                  investors globally, and leverages her experience with portfolio solutions to advise clients. She has held many roles
                  in the Asset Management Division (AMD) including serving as co-head of the US Public Fund business, co-head
of the Corporate Pension business, and as global head of the Consultant Relations business. Lisa was named a Goldman Sachs
managing director in 2003. She joined as a vice president in 1994. Prior to joining the firm, Lisa served as Minnesota’s deputy state
auditor representing the state auditor in all plan sponsor decisions related to the Minnesota State Board of Investment. She also
served as Minnesota’s chief deputy commerce commissioner with oversight responsibility for the securities, insurance, banking, and
real estate industries. Prior to joining the Minnesota Department of Commerce, Lisa served as a special assistant attorney general for
the State of Minnesota. She previously served on the Minnesota Governor’s Task Force on Small Business Capital Formation. Lisa
earned an AB in Government from Harvard University and a JD from the University of Minnesota Law School, where she also
served on the Board of Advisors.
                                                                                                                                         2
Consumer and Wealth Management US Resilient Durability is one of the chief elements of strength. Nothing is either loved or feared but that which is likely to endure. – Alexis de Tocqueville, Democracy in America Economic and Financial Market Outlook
Consumer and
Wealth
Overview of Today’s Call Management
Economic and Financial Market Outlook
US Preeminence
Stay Invested
Risks
4
Source: Investment Strategy Group.Consumer and
Wealth
Economic Growth to Recover in 2021 – Developed Markets Management
Real GDP Growth Forecasts (% YoY) – As of April 6, 2021
United States Eurozone United Kingdom Global
Period ISG GIR Consensus ISG GIR Consensus ISG GIR Consensus ISG GIR Consensus
2020 -3.5 -3.5 -3.5 -6.6 -6.6 -6.6 -9.9 -9.9 -9.9 -3.8 -3.4 -3.3
2021 6.6 7.2 5.7 4.6 5.1 4.2 5.2 7.1 4.7 5.6 6.8 5.6
2020-21
2.9 3.5 2.0 -2.3 -1.8 -2.7 -5.2 -3.5 -5.7 1.6 3.2 2.1
Combined
While global GDP was hit significantly, contracting by an estimated 3.8% in 2020, our base case calls for a solid recovery
in 2021, with global GDP expanding by 5.6%. Across major developed regions, we expect the US to outperform.
The near-term momentum remains challenging while the level of infections is elevated, particularly in the Eurozone.
However, we think this setback will prove temporary once the operational challenges of mass vaccinations are
surmounted.
As the pandemic is brought under control, we expect a meaningful acceleration in economic activity, particularly in the
services sectors.
We expect monetary and fiscal policy to remain very accommodative, supporting the recovery.
Source: Investment Strategy Group, Goldman Sachs Global Investment Research, Bloomberg.
Note: Forecasts are estimated, based on assumptions, are subject to revision and may change as economic and market conditions change. There can be no assurance
the forecasts will be achieved. 5Consumer and
Wealth
Economic Growth to Recover in 2021 – Emerging Markets Management
Real GDP Growth Forecasts (% YoY) - As of April 6, 2021
China Brazil India Russia Emerging Markets
Period ISG GIR Consensus ISG GIR Consensus ISG GIR Consensus ISG GIR Consensus ISG GIR Consensus
2020 2.3 2.3 2.3 -4.1 -4.1 -4.1 -7.0 -7.0 -7.0 -3.0 -3.0 -3.0 -1.9 -2.0 -1.3
2021 7.5 8.5 8.5 3.8 4.0 3.5 11.1 10.9 9.5 3.3 4.5 3.0 6.2 7.5 6.7
2020-21
10.0 11.0 11.0 -0.5 -0.3 -0.7 3.3 3.1 1.8 0.2 1.4 -0.1 4.2 5.3 5.3
Combined
EM GDP shrank 1.9% in 2020, the worst performance in data going back to 1980.
The recession was short-lived, however, with most economies rebounding by last summer.
EM economies have entered 2021 with a healthy momentum with upside surprises to growth in Q4 2020. We expect EM
growth to rebound to 6.2% this year. There are upside risks from strong external demand driven by reopenings and policy
support in DM economies (particularly the US), and downside risks from a rise in infections in Brazil and India.
In China, we expect 2021 GDP growth to accelerate to 7.5% from 2.3% last year. While fiscal and monetary policy will
remain accommodative to support the recovery, policymakers may slowly dial back the level of stimulus given debt
concerns—we estimate total debt in China stood at 288% of GDP as of December 2020, up sharply from 270% at the end
of 2019.
Source: Investment Strategy Group, Goldman Sachs Global Investment Research, Bloomberg.
Note: Forecasts are estimated, based on assumptions, are subject to revision and may change as economic and market conditions change. There can be no assurance
the forecasts will be achieved. 6Consumer and
Wealth
Monetary Policy to Remain Accommodative Management
1. Central Bank Balance Sheets1 2. Central Bank Main Policy Rates
70% US Eurozone UK Japan (Right) 140%
2.00
1.63
60% 120%
1.50
50% 100% 1.00
0.75
%
40% 80% 0.50
% of GDP
0.13 0.10
30% 60% 0.00
-0.10 -0.10
-0.50
20% 40% -0.50 -0.50
-1.00
10% 20% US Eurozone UK Japan
0% 0% Dec-19 Apr-21
07 08 09 10 11 12 13 14 15 16 17 18 19 20 21
In response to the pandemic, major central banks eased monetary policy substantially by cutting policy rates and
expanding their balance sheets via asset purchases and credit easing operations.
Looking ahead, we expect central banks to maintain a very accommodative policy stance for an extended period of time.
We expect policy rates across major developed economies to remain on hold at their current low levels for a while and
for central banks to continue their asset purchase programs and maintain credit support measures in 2021.
This accommodative monetary stance should contain increases in yields, which is reflected in our end-2021 10-year yield
forecasts for US Treasuries, German bunds, and UK gilts of, respectively, 1.50 – 2.00%, -0.4 – 0%, and 0.5 – 1.25%.
(1) Data are presented as % of annual nominal GDP. UK balance sheet data after Q4 2019 is based on the BoE’s Weekly Reports. 7
Source: Investment Strategy Group, Bloomberg, Haver Analytics.Consumer and
Wealth
Fiscal Policy to Remain Accommodative Management
1. Government Budget Deficits1 2. Government Debt-to-GDP Ratios1
250
20.0
18.4 223
218
18.0
198
200
16.0 15.5
14.9
14.0
12.2 12.2 11.9 150
12.0
% of GDP
11.0
% of GDP
9.8 114
10.0 9.1 107 109
106 103
100
8.0 100
8.0 86
79 81
6.3
65 69
6.0
4.6 56
4.0 50
2.5 2.5
2.0
0.6
0.0 0
US Eurozone UK Japan China US Eurozone UK Japan China
2019 2020 2021 (ISG Forecast) 2019 2020 2021 (ISG Forecast)
In response to the pandemic, policymakers globally have delivered unprecedented fiscal stimulus, supporting household
incomes and containing corporate bankruptcies.
We expect fiscal policy to continue supporting the recovery in 2021. Notably, additional near-term fiscal measures in
the US reflect the $1.9tn phase 5 coronavirus bill. In Europe, many national fiscal measures were extended into 2021,
while the EU-wide Next Generation fund remains on track to start disbursing funds this year.
As a result, government debt across major economies is expected to increase significantly relative to pre-pandemic
levels. However, low interest rates (supported by accommodative monetary policy) will keep the debt burden
sustainable, in our view.
(1) Estimates reflect current fiscal policy. The Eurozone aggregate forecast is computed as a weighted average of Germany, France, Italy, Spain. US and UK data are on a fiscal year basis. 8
Source: Investment Strategy Group, IMF, Haver Analytics.Consumer and
Wealth
US Federal Budget Receipts Management
US Total Federal Budget Receipts as a Percent of GDP
25 Total Federal Budget Receipts Post-WWII Median
2000:
20.0
20
17.2
16.3
15
% of GDP
2009–10:
14.6
10
5
0
1934 1944 1954 1964 1974 1983 1993 2003 2013
Source: Investment Strategy Group, OMB, CBO. 9Biden Administration Unveils an Initial Set of Proposed Tax Consumer and
Wealth
Increase Management
Select Tax Increase Proposals from the 2020 Presidential Campaign and Expected Outcome
Current Campaign Proposal GIR expectation EG expectation
50
43.4
39.6
37
30
28 28
25 25 23.8
25 21 21 21
15 15
12.4
10.5
0 0
0
Increase Corporate Tax Modify and Expand Impose Minimum Increase Top Marginal Tax Capital Gains and Impose Social Security
Rate Global Intangible Low- Corporate Tax on Book Tax Rate Dividends for Income Payroll Tax on Earnings
Taxed Income Income Over $1mm at Ordinary Above $400k
Rate
Select Tax Increase Proposals to Fund American Jobs Plan Expected Tax Increase Proposals to Fund American Families Plan
The Administration has unveiled an initial set of tax increase proposals. These increases are intended to offset the costs of the $2.3
trillion American Jobs Plan (physical infrastructure) over 15 years. These proposals focus on corporations.
The next set of proposed increases is expected in late April. These increases are intended to offset the costs of the yet-to-be-
published ~$2tn American Families Plan (human infrastructure). These proposals will likely focus on individuals.
Passage of these tax increases in Congress will be a considerably heavier political lift than the COVID-19 rescue plan. Of the tax
increases, corporate tax rate and top marginal tax rate appear most likely to secure enough political support to pass – though the
exact levels remain uncertain. None of the potential tax increases are expected to be retroactive.
Note: GILTI – a tax on income earned by foreign affiliates of US companies from intangible assets such as patents, trademarks, and copyrights.
Source: Investment Strategy Group, GS Global Investment Research, Eurasia Group 10Consumer and
Wealth
US Interest Expense Expected to Decline Due to Low Rates Management
US Interest Expense as Percent of GDP: Realized + GIR Forecasts
Through 2023
Historical Median GIR Forecast
3.5
1991
3.2
3.0
2.5
% of GDP
2.0
2020
1.7
1.5 1.4
2024
1.3
2021
1.0 1.2
0.5 1942
0.6
0.0
1940 1950 1960 1970 1980 1990 2000 2010 2020
GIR expects US interest expense as a percent of GDP to be the lowest since the 1960s.
11
Source: Investment Strategy Group, Congressional Budget Office, Goldman Sachs Global Investment Research, US Treasury.Large Output Gaps Have Opened Up as a Result of the Consumer and
Wealth
Pandemic Management
1. Unemployment Rate – Through March 20211 2. Output Gap Estimates2
16.0
1.0%
US Eurozone UK Japan 0.4%
0.0%
14.0
-1.0% -0.6%
12.0 -1.3%
-2.0%
% of Potential GDP
-1.8%
10.0
-3.0%
%
8.0 -4.0% -3.8%
-4.1%
6.0 -5.0%
-6.0% -5.8%
4.0 -5.9%
-7.0%
2.0
-7.4%
-8.0%
DM BRICs World
0.0
07 08 09 10 11 12 13 14 15 16 17 18 19 20 21
2019 2020 2021
Labor markets suffered a very large hit from the pandemic. Unemployment rates have surged across regions, albeit
less so in Europe and Japan because of the extensive use of short-time work schemes. Still, aggregate hours worked
contracted significantly across major developed countries.
Growth in job vacancies remains soft, but labor markets have started to improve, especially in the US.
Even as economies have begun to recover, unemployment rates are still elevated and output gaps remain wide. We
estimate a world output gap of around -5.9% of potential GDP in 2020, narrowing to -4.1% in 20212.
(1) Unemployment rate through March 2021 for the US, February 2021 for the Eurozone and Japan, and through January 2021 for the UK. (2) World output gap estimated as a weighted
average of the IMF’s output gap estimate for developed economies and the ISG’s output gap estimate for the BRICs. 12
Source: Investment Strategy Group, IMF, Haver Analytics.Consumer and
Wealth
Inflation is Expected to Rise Management
1. Core CPI Inflation1 2. Decomposition of US Core CPI into Base Effects and Underlying Inflation
2.5
3.0
2.2 2.2
2.5
2.0
1.7 1.7
2.0
1.5
1.5 1.4
1.5
% YoY
% YoY
1.0
1.0 0.9
1.0
0.7
0.6
0.5 0.5
0.0
0.0
0.0
-0.5
-0.2
-0.5
US Eurozone UK Japan
Base effects Underlying core CPI Core CPI inflation
2019 2020 2021 (ISG Forecast)
Still-sizable slack in the economy—evident in the elevated unemployment level—represents a powerful headwind to
inflation, although in the US labor market slack is diminishing at a faster-than-expected pace.
In the US, inflation is likely to rise this year as the economy rebounds and prices recover from currently depressed
levels. While in the near term this largely reflects transient drivers, including a low base effect and temporary supply
constraints in certain sectors, beyond 2021 diminishing slack is likely to keep inflation above 2%.
(1) 2021 forecasts reflect the midpoints of the corresponding ISG forecast ranges.
Source: Investment Strategy Group, IMF, Haver Analytics. 13Consumer and
Wealth
Market Expectations for Policy Normalization Management
1. Front End Policy Rates – As of 05Apr2021 2. US Front End Market Pricing – SOFR1 futures curve
Years Rate (%)
Years Until Market Prices 25bp Higher Policy Rate
10 2.00
31Dec20 9.0
9 1.75
8 1.50
7 6.5
6.2 1.25
6
1.00
7.3
5
0.75
4
3.2
0.50
3 2.6
2.1
0.25
2 3.6
0.00
1 1.8
1.5 1.5
1.0
0
US Canada Europe UK Japan Australia Current (05Apr21) 17Feb21 31Dec20
Since the end of 2020, market expectations for the timing of policy normalization have shifted across developed markets.
Focusing on US rates and the Federal Reserve, the market is now pricing for lift off to occur by Q4’22 and for ~3 hikes to occur by
the end of 2023. This pricing shifted in the past couple months, as the market had been indicating a mid-2023 lift off in February.
1SOFR = secured overnight financing rate, risk-free rate benchmark in the US.
Source: Investment Strategy Group, Bloomberg. 14Consumer and
Wealth
ISG 2021 and 5-Year Prospective Total Returns Management
2021 and Five-Year Prospective Annualized Pre-Tax Return Projections (Rounded) – As of March 29, 2021
12 9 9 11
10 9 9
2021 Prospective Return 8 8
8 6
5 4 5 5 5
6 5-Year Prospective Annualized Return 5 5 4 5 5
4 3 3
% 4 3 3 3 3
2 1 2
2 0 0 1 0 0
0
-2 -1 -1 -1 -1
-4
-6 -5
-8
Asset Class (Historical Volatility)
We expect a base case total return of 8% for US equities and 8.6% for the MSCI All Country World Index.
In the year ahead, non-US developed equities and emerging market equities are forecast to outperform US equities,
but match or lag it over the next five years. These non-US markets also typically have higher volatility.
Equities should outperform cash and bonds; US Treasuries are projected to have negative returns in coming years.
Note: These forecasts have been generated by ISG for informational purposes. Return targets are based on ISG’s framework, which
incorporates historical valuation, fundamental and technical analysis. Dividend yield assumptions are based on each indexes trailing 12-
month dividend yield. They are based on proprietary models and there can be no assurance that the forecasts will be achieved. Please see 15
additional disclosures and indices used at the end of this publication. Source: Investment Strategy Group.Higher Interest Rates in 2021 Will Weigh on High Quality Consumer and
Wealth
Bond Returns. We Prefer Credit Over Duration Management
1. ISG Prospective 2021 Fixed Income Returns by Asset Class 2. US 10-Year Treasury Yield Since 1790
6 16%
10-Year US Treasury Yield
4.6 Long-Term Average
4 14% 3% or Below
2.5% or Below
2% or Below
2021 Prospective Return (%)
12%
2
1.4
10-Year Treasury Yield
0.1 0.1 10%
0
-0.5 8%
-1.2 -1.0
-2
6%
-4 -3.5 4.8
4% 20.6
Years 9.7
-5.3 -5.2 Years
-6 11.5 Years
10-Year 5-Year US Cash US US Bank EUR 10-Year GBP 10-Year EM Local 2%
1.7
Treasury Treasury Corporate Loans Cash German Cash UK Gilt Debt 2.8 Years
HY Bund
0%
US Europe EM
1790 1810 1830 1850 1870 1890 1910 1930 1950 1970 1990 2010
Several factors make bond returns vulnerable to rising interest rates this year: a strengthening global economic recovery
on the back of widespread vaccinations, already record low yields, receding flight-to-safety premiums in sovereign bond
prices, and high government issuance to finance fiscal measures.
But a disorderly backup in rates is unlikely given today’s economic slack and the lingering disinflationary impacts of the
pandemic. This backdrop will provide cover for central banks to maintain stimulative monetary policy this year.
We expect the 10-year Treasury yield to be between 1.50% and 2.00% by the end of 2021. While we expect rates to
increase, history reminds us that interest rates can remain low for long periods of time.
Source: Investment Strategy Group, Datastream, Bloomberg, Global Financial Data. 16Consumer and
Wealth
Enhancing Income Management
Yield of Various Asset Classes – As of March 31, 2021
10
9.0
9 8.7
8
7
Pre-Tax Yield (%)
6
5.1 5.0
5 4.5 4.4 4.2
4.0 3.9
4 3.6
2.9
3
2.0
2 1.6
1 0.7
0
Asset Class (Volatility)
Note: Preferreds not adjusted for taxes.
Source: Investment Strategy Group, Bloomberg. 17Consumer and
Wealth
We Expect Attractive Returns for US Equities in 2021 Management
1. Decomposition of ISG Central Case S&P 500 Return for the Year 2021 2. ISG S&P 500 Total Return Forecast at Year-End 2021 – As of April 6, 2021
35 20
17 Solid Bars: From Year-End 2020
16 Striped Bars: Fom Current
30
12
8 8
8
25
4
Total Return (%)
0
20
Return (%)
-1
23 -4
-8
15 29
-12
10 -16
2 -20 -19
5 -24
8
6 -25
-28
0 Good Case Central Case Bad Case
Earnings Growth – Impact of Multiple = Price Return + Dividend Yield = Total Return (25% Probability) (60% Probability) (15% Probability)
Contraction*
With a 60% probability, we expect the S&P 500 to reach 3950–4050 by the end of 2021 in our central case:
– Total returns of 7–9% (8% midpoint)
– Earnings growth of 28–31% (29% midpoint), reflecting $141 in 2020 and $180–185 in 2021
– Dividend yield of 2%
– A compression in valuation multiples
Our good case implies a 17% total return (or 4350 price) with 25% odds, reflecting a faster and more widespread
rollout of vaccinations and better-than-expected economic growth.
Our bad case implies a -19% total return (or 3000 price) with 15% odds, reflecting the potential for a more deleterious
turn in COVID-19 developments and unfriendly regulatory or tax policies.
* Includes the compounding effect between earnings and multiples.
18
Source: Investment Strategy Group, Bloomberg.Valuations Have Been Higher During Periods of Low and Consumer and
Wealth
Stable Inflation Than Over the Entire Post-WWII Period Management
S&P 500 Valuation Multiples – As of April 6, 2021
Long-Term Median (Post-World War II)
Median Over the Low and Stable Inflation Regime (Since April 1996)
Current Level
Peak of Dot-Com Bubble
60 Projected Trailing P/E at 2021 Year-End Adjusting Today's Depressed Earnings*
50
40
29
30 26
Multiple (x)
22 21 22
19 18 19 17
20 16 15 16
10
0
P/Trend Reported P/10Y Avg Reported P/Peak Reported Shiller CAPE P/TTM Operating P/TTM Reported
Earnings Earnings Earnings Earnings Earnings
Based on Earnings Over a Cycle Based on Earnings in the Last 12 Months
* Based on the midpoint of ISG’s central case forecast range for the S&P 500 at 2021 year-end. 19
Source: Investment Strategy Group, BloombergToday’s Low Interest Rates Support Higher Valuations and Consumer and
Wealth
Have Room to Rise Before Becoming a Headwind for EquitiesManagement
1. S&P 500 Implied Equity Risk Premium: Forward 12-Month Earnings Yield 2. Inflection Point for Negative Correlation Between Stock Prices and Bond
Less US Treasury 10Y Yield – As of April 1, 2021 Yields – As of April 6, 2021
10 Equity Risk Premium Current Level Post-Crisis Average Average Since 1996 6
5.1
6.9 at
8 Cheaper Market 5
Equity Trough
US Treasury 10-Year Yield (%)
Valuations
6 4
Equity Risk Premium (%)
3.4
4.3
4 3
2.8
2.7
2 2
1.67
0 1
-2 0
Historical Since 1962 Adjusted for Today's Lower Current 10-Year
Equilibrium Rate* Treasury Yield
Yield at Which Stock Prices and Rates
-4
Become Negatively Correlated
1996 1998 2000 2002 2004 2006 2008 2010 2012 2014 2016 2018 2020
The implied equity risk premium (ERP)—the difference between the earnings yields and the bond yield—is still an
attractive 2.8% and is considerably better than the negative ERP seen during the technology bubble.
Although we expect rising rates to compress valuations this year, interest rates have ample room to increase before they
would jeopardize the bull market, provided they are rising in response to improving real growth.
Keep in mind that 92% of S&P 500 debt is fixed-rate debt and only 14% matures over the next two years, so it would
take a number of years for higher rates to negatively impact aggregate S&P 500 interest expense.
* Adjusts for the reduction of 1.75 percentage points in the long-run equilibrium nominal rate, in line with the shift in Federal Reserve projections since 2012. 20
Source: Investment Strategy Group, FactSet, Bloomberg, Global Financial Data, Haver Analytics.Constructing Stock-Picking Models Requires Judgements Consumer and
Wealth
About Fundamentals Management
1.Equally-weighted returns. 21
Source: Corporate Reports, Empirical Research Partners Analysis.Equities are Likely to Deliver Attractive Returns During Consumer and
Wealth
This Economic Expansion, as They Have in the Past Management
1. Odds of Various S&P 500 One-Year Total Returns During US Economic 2. S&P 500 Total Return from Equity Trough to Beginning of Next Recession2
Expansions1 – As of April 6, 2021
100 450%
403%
87 400%
80 350%
64 300%
60
Probability (%)
250%
200% 195%
40
150% 138%
30
100% 85%
20
50%
4
0%
0 Gain from Median Post-WWII Average Post-WWII Memo: Last 4
Decline of Positive Return Return of 10% Return of 20% March 23rd Bottom Gain from Bottom Gain from Bottom Expansions Median
at Least 10% or Greater or Greater Gain from Bottom
Investors have enjoyed 87% odds of a positive return—and a much greater likelihood of large gains than of large losses—
in years when the economy is expanding.
In fact, nearly three-fourths of historical equity declines in excess of 20% occurred during US economic contractions.
With our forecast placing just 10% odds on a recession this year, the economic backdrop in 2021 is favorable for stocks.
Past economic expansions have been associated with sizable cumulative equity gains, implying ample upside despite the
85% equity rally from last year’s March low.
Given these historical analogs and our fundamental views, we expect equities to deliver mid-single-digit annualized
returns that will be superior to cash and bonds for the foreseeable future.
(1) Based on data since 1945. (2) Recession start date is defined as the first date of the NBER business cycle peak month. 22
Source: Investment Strategy Group, Bloomberg.Consumer and
Wealth
S&P 500 Drawdown Probability Over One Year Window Management
One-Year Probability of a Drawdown in the S&P 500 Conditional on
Valuations Being in the 9th or 10th Decile
100% Return from Peak to Trough Within a Year
95%
Return from Beginning to End of Year
Probability of Drawdown When Valuations are High
80%
75%
60%
41%
40%
24% 23%
19%
20%
15%
9%
0%
-5% -10% -15% -20%
Magnitude of Drawdown in US Equities
Over a 12-month period the historical probability of a 5% correction from current valuation levels is 95%, and the
probability of a 10% correction is 75%.
The odds of a pullback persisting through the year have been much lower. The historical probability of a 5% correction
from beginning to end of year is only 24%.
Source: Investment Strategy Group, Bloomberg. 23We are Tactically Overweight Value vs. Growth and Small- Consumer and
Wealth
Cap vs. Large-Cap Equities Management
1. US Russell 1000 Value vs. Growth Relative Total Return – Through April 6, 2. US Small-Capitalization vs. Large-Capitalization Relative Total Return –
2021 Through April 6, 2021
1.9
1.6
1.7
1.4
1.5
1.2
1.3
1
1.1
Value Stocks 0.8
0.9 Underperform
Growth Stocks Small-Capitalization
Stocks Underperform
0.6 Large-Capitalization
0.7
Stocks
0.5 0.4
1990 1995 2000 2005 2010 2015 2020 1978 1983 1988 1993 1998 2003 2008 2013 2018
Value has underperformed growth by 336 percentage points (pp) (or 5.6pp ann.) since August 2006, and by 36% in 2020 given
the global pandemic/zero rates. Relative performance is now at levels last seen during the technology bubble.
The valuation spread between cheap and expensive stocks stands about 1.3 standard deviations above its mean. Such wide
spread reflect the higher risk premiums offered by value stocks, which have been associated with subsequent outperformance.
Small cap stocks have lagged large cap stocks by about 1.8% a year since July 1983. As a result, the Russell 2000 index’s price
to cash flow multiple stands in the bottom 20% of its past range relative to the S&P 500.
We expect the economic recovery fueled by broad vaccine rollout to be the catalyst for value’s and small cap’s outperformance
this year. Similar periods of economic recovery have supported returns of value and small cap stocks in the past.
Source: Investment Strategy Group, Bloomberg. 24Consumer and
Wealth
Growth versus Value Outperformance Accelerated in 2020 (I) Management
1. S&P 500 Sector Total Returns in 2020 2. S&P 500 Sector 2021 YTD Total Returns – As of April 6, 2021
70% 35%
60% 56% 31%
30%
50% 44%
40% 25%
33%
30%
24%
21% 20% 18%
18%
20%
13%
11% 11%
10% 15%
13% 13%
1% 12% 12%
0%
-2% -2% 10% 9%
-10% 7% 6% 6%
-20% 5% 4%
3% 3%
-30%
0%
-40% -34%
Financials
Utilities
Energy
Cons Staples
Industrials
Comm Svc
Cons Discret
Health Care
Real Estate
S&P 500
FAAMG*
Materials
Info Tech
FAAMG*
Cons Discret
Comm Svc
Materials
Health Care
Industrials
Cons Staples
Energy
Info Tech
S&P 500
Utilities
Financials
Real Estate
(22%) (28%) (13%) (11%) (3%) (13%) (8%) (7%) (3%) (10%) (2%) (2%) (3%) (11%) (9%) (11%) (3%) (2%) (13%) (21%) (27%) (3%) (13%) (6%)
S&P 500 GICs Sectors (Current Market Cap Weight) S&P 500 GICs Sectors (Current Market Cap Weight)
* FAAMG includes Facebook, Apple, Amazon, Microsoft and Google. * FAAMG includes Facebook, Apple, Amazon, Microsoft and Google.
The Russell 1000 Growth index outperformed the Russell 1000 Value index by around 36 percentage points in 2020 given
the global pandemic and its hit to growth and interest rates.
The significant underperformance of cyclical equities in 2020, particularly energy and financials, suggests investors
remain highly skeptical of the economic trajectory despite the recovery in the headline S&P 500.
The weak growth backdrop has led investors to pay a premium for growth, leading to crowding in popular tech names.
Source: Investment Strategy Group, Bloomberg, Bloomberg, Factset, Datastream, S&P Global. 25Consumer and
Wealth
Growth versus Value Outperformance Accelerated in 2020 (II) Management
S&P 500 Sector Dispersion: Normalized (2022 Consensus) P/B vs. ROE
10x
Discretionary Discretionary
9x ex-Amazon
8x Info Tech
Valuation: Price to Book Ratio (2022)
7x
6x
Staples
5x
Industrials
4x Comm. Real Estate
Svcs. Health Care
S&P 500
3x
Materials
2x Utilities
Energy
1x Financials
0x
5% 10% 15% 20% 25% 30% 35% 40%
Profitability: Return on Equity (2022)
When we look at normalized (using 2022 estimates) valuation relative to profitability, sectors like Information Technology
and Consumer Discretionary trade at a slight premium, while Healthcare, Industrials and Staples trade at a discount. When
we adjust the valuation of Consumer Discretionary for Amazon, the sector trades at a valuation inline with its profitability.
26
Source: Investment Strategy Group, Bloomberg, Bloomberg, Factset, Datastream, S&P Global.Sizable Dispersion in Performance Across Real Estate Consumer and
Wealth
Sub-sectors During 2020 Management
2020 Total Returns Across US REIT Sectors
30%
22%
20%
14%
10% 7%
2020 Total Return (%)
0%
-10%
-20%
-19% -20%
-25%
-27%
-30%
-40% -37%
Data Industrials Towers Apartments Office Hotels Shop. Malls
Centers Center
2020 saw considerable dispersion in sector performance among REITs. Malls, shopping centers and hotels that were
severely affected by COVID-19 underperformed, as well as companies with higher leverage and shorter lease terms.
Newer non-core REIT sectors such as datacenters and towers have outperformed, along with industrials/warehouses
which benefit from a physical to digital transition.
Performance based on Bloomberg US REIT Sector indices except Datacenters and Towers where a basket of companies was used to calculate year to date returns for the sector.
27
Source: Investment Strategy Group, Bloomberg, Factset. Data as of Dec 31, 2020Non-US Equities Trade at Large Discounts to the US, but Consumer and
Wealth
Valuation has no Bearing on Subsequent Performance Management
1. Non-US Developed Equity Valuation Premium / Discount to US Equities –
2. EM Equity Valuation Premium / Discount to US Equities – As of March 2021
As of March 2021
10% Non-US Developed Equities Premium / Discount vs. US Equities 20% Emerging Market Equities Premium / Discount vs. US Equities
Long-term Average Long-term Average
10%
0%
0%
-10% -10%
-20%
-20%
-26% -30%
-32%
-30%
-40%
-47%
-40% -50%
-60%
-47%
-50%
-70%
-60% -80%
1992 1995 1998 2001 2004 2007 2010 2013 2016 2019 1995 1998 2001 2004 2007 2010 2013 2016 2019
Non-US developed markets and EM equities continue to trade at large valuation discounts to US equities.
However, we do not recommend a broad tactical tilt to either funded out of US equities, given:
– No evidence that significant discounts have led to outperformance over the subsequent one and five years.
– Non-US developed and EM equities do not typically outperform US equities in a downdraft.
– Underlying fundamental factors do not present compelling rationale to overweight non-US equities.
Source: Investment Strategy Group, Datastream. 28No Compelling Rationale to Overweight EAFE or EM Consumer and
Wealth
Equities versus the US Management
1. Annualized US vs. Non-US Earnings Growth 2. Technology Stocks’ Earnings Weight Across 3. Price/Forward Earnings and PEG Ratios3 – As
Gap Since 20071 – Through March 2021 Regions2 – As of April 2, 2021 of April 2, 2021
8 35 33.2 25x 1.0
EAFE EM 0.91
22.1 0.9
29.9 20.8
4 3.2 30 20x 0.8
27.4 0.71
Share of Index Earnings (%)
0.5 0.8 0.7
0 25 15.1
15x 0.6
0.50
0.5
-4 -3.1 -2.8 -2.4 -2.6
20
-4.2 -3.9 -4.1 10x 0.4
-5.3 -4.7
-5.7 -5.9 0.3
-8 -7.2 -6.9
-7.5 -7.1
-7.2 15
12.2 5x 0.2
-12 -11.1 0.1
10
0x 0.0
-16 S&P 500 MSCI EM MSCI EM S&P 500 MSCI EM MSCI EM
5 with S&P with S&P
500 500
Weights Weights
0
Non-US Developed China Emerging Markets US Price/Forward Earnings (Left) PEG Ratio (Right)
Earnings outside the US have substantially lagged those of the US across most sectors since the peak in earnings
growth in 2007.
The divergence in earnings can be partly attributed to the higher exposure of the US equity market to the broader
technology sector. However, even adjusting for sector weights, US companies in aggregate earn more than their non-
US counterparts.
1. Indices are based on annual MSCI data, beginning in 2007. Analysis uses 12-month forward earnings in order to mitigate the impact of negative earnings periods.
2. Includes information technology, internet and direct marketing retail, and interactive media services.
3. Using ISG estimates for 12-month forward EPS growth. 29
Source: Investment Strategy Group, Bloomberg, Datastream, FactSet.Consumer and
Wealth
ISG Tactical Views Management
Equities ISG Tactical Views by Asset Class – As of April 6, 2021
• MLPs
Long MLPs, funded from investment grade fixed income. Asset Class Current Tactical View
• Long S&P 500 Energy Sector Fixed Income
Long S&P 500 energy sector, funded from investment grade fixed income. Investment Grade Underweight
• Long S&P 500 Healthcare Sector Relative Value US Bank Loans Overweight
Long S&P 500 healthcare sector vs. short beta-adjusted S&P 500 index. Global Equity
• Systematic Downside Mitigation Tilt US Equity Overweight
Short Systematic Downside Mitigation basket, long S&P 500 futures (delta-neutral). MLPs Overweight
• Systematic Upside Improvement Tilt Energy Sector Overweight
Long Systematic Upside Improvement basket, short S&P 500 futures (delta-neutral). Healthcare Sector Overweight
• Short S&P 500 Put Small Cap Equity Overweight
Short a Dec. 31, 2021 put struck 5% OTM. EAFE Equity Neutral
Short a Dec. 31, 2021 put struck 10% OTM. Eurozone Banks Overweight
• Short Russell 2000 Put Emerging Market Equity Neutral
Short a Dec. 31, 2021 put struck at-the-money. Currencies
• Eurozone Banks Euro (vs. USD) Underweight
Long Eurozone bank equities on a currency hedged basis, funded from investment grade Swiss Franc (vs. USD) Underweight
fixed income. Japanese Yen (vs. USD) Underweight
• Short Eurozone Banks Put British Pound (vs. USD) Neutral
Short a 12-month put struck at-the-money. Commodities
• Long Europe Stoxx 600 Call vs. Short Stoxx 600 Put WTI Crude Oil Neutral
Long Europe Stoxx 600 call struck 5% OTM, funded by a short position in Stoxx 600 put Gold Underweight
struck 15% OTM, both expiring Dec. 17, 2021. Real Estate Neutral
Fixed Income, Currencies and Commodities
• Higher US 30Y Swaps
Short a 9M30Y receiver swaption struck at-the-money.
• Long US Bank Loans
Long US bank loans, funded from investment grade fixed income.
• Long US dollar vs. Yen
Long a 2-year USDJPY call struck at-the-money-spot.
• Long US dollar vs. Swiss franc
Long a 2-year USDCHF call struck at-the-money-spot.
• Short Euro vs. US dollar
Long a 2-year EURUSD put struck at-the-money-spot.
• Short Gold
Long a July 16, 2021 put struck 5% OTM.
30
Source: Investment Strategy Group.Consumer and
Overweight MLPs / Midstream Companies Wealth
Continued Cash Flow Discipline Leads to Potential for Appreciation in 2021 Management
1. 2021 Cash Flow Waterfall Estimates for Alerian Index Constituents ($ bn) 2. Median EV / EBITDA3 Multiple for MLPs (Forward 12-Month EBITDA)
Cash Use Aggregate (Capex and Distributions, $ bn) 16x Median MLP EV/EBITDA Max: 15.5x
Cash Flow Aggregate for MLPs (EBITDA/CFO/FCF, $ bn)
Historical Average
45 40.9 Cash Flow Yield to Market Cap (Right Axis) 14% 15x
Average + 1SD
FCF Yield and Distribution Yield to Mkt Cap (%)
12.8% Average - 1 SD
40 14x
12%
2021 Consensus Estimates($ bn)
Earnings and Cash Flows -
Enterprise Value / EBITDA
35 13x
30.1 13.1x
10%
30 12x
8.4%
25 22.2 8%
11x 11.2x
20 7.9 10.1x
6% 10x
15
4.4% 9x 9.3x 8.8x
4%
10 7.6
8x
2%
5 14.7
7x 2020 Low: 7.1x
2008 Low: 6.9x
0 0%
EBITDA CFO (-) Capex FCF (-) Distribution FCF After 6x
Distributions 1Q03 1Q05 2Q07 2Q09 2Q11 2Q13 2Q15 2Q17 2Q19
Continued Capital Discipline: 2021 earnings estimates for the midstream sector have risen 2% since the(EBITDA1)
start of the year, while capital expenditure estimates have declined 7.8% over the same period. Put simply, companies
are spending less on new project construction given reduced production from E&Ps and are retaining more cash flow.
Attractive Cash Flow Yields: Given improved capital discipline, the sector is priced to deliver a free cash flow yield
of 12.8%2 before distributions based on 2021 estimates (versus 4.1% for the S&P 500) and 4.4% 2 after distributions.
Attractive Valuations: The sector’s valuation still stands at a discount relative to history and more than one standard
deviation from historical average. A return to valuations at the end of 2019 still implies healthy returns from current
levels. We expect the sector to appreciate 23% in 2021 through a combination of distributions and price appreciation.
1. EBITDA = Earnings Before Interest, Taxes, Depreciation and Amortization. 2. Free Cash Flow Yield = (Cash flow from operations less capex) / market capitalization. We measure Free Cash
Flow After Distributions as Cash Flow from Operations less Capex less Distributions. 3. EV / EBITDA = Enterprise Value/EBITDA. Source: Investment Strategy Group, Bloomberg, Eikon. 31Consumer and
Overweight Bank Loans Wealth
Spreads are Wide Relative to Expansionary Medians and High Yield Bonds Management
1. Leveraged Loan Spreads, Current Levels Versus Recessions/Expansions 2. Cumulative ETF and Mutual Fund Flows, HY and Bank Loans Since 2019
80 High Yield Bank Loans
9.0
64.1 bn
Nov 2020
Cumulative ETF and Mutual Fund Flows Since 2019 ($ bn)
7.90
8.0 60
Credit Suisse Lev. Loan Index - 3y Discount Margin %
7.0 53.7 bn
40
6.0
20
5.0 4.66 4.52 4.50
4.12
4.0 0
3.0
-20
2.0
-40
1.0
-52.4 bn
0.0 -60
Average Median Expansions Recessions Current
excl. 6m Before -65.6 bn
Unconditional Recession Nov 2020
-80
Average Since 1992 Jan-19 May-19 Sep-19 Jan-20 May-20 Sep-20 Jan-21
Attractive Spreads: Leveraged loan spreads stand at around 450 bps and are close to historical medians. The sector
also offers 157 bps of incremental compensation relative to high yield bond spreads 1, which are in their 7th percentile
relative to history. Spreads are also around 40 bps higher than the average seen during economic expansions.
Limited Interest Rate Duration: US leveraged loan’s 0.25 year rate duration is attractive in the modestly higher
interest rate environment we expect. This has manifested itself in fund flows. Bank loans had seen outflows and high
yield bonds had seen inflows until late Nov 2020, but these flows have reversed in recent months as rates have risen.
Attractive Returns: Our default models as well as realized default rates point to a decline in defaults during 2021.
Coupled with incremental spread and low duration, we expect the sector to deliver 5-6% returns in 2021.
1. HY spreads measured using the Bloomberg Barclays HY Index stand at 293 bps as of April 6th, 2021. Source: Investment Strategy Group, Bloomberg. Market Data as of April 6th, 2021.
32Consumer and
Overweight Eurozone Banks Wealth
Attractive Valuation and Rising Earnings Should Continue to Generate Positive Returns Management
1. Covid-Related Impairments Likely Peaked in 2020 2. We Expect Bank Valuations to Rise With Improving Return on Equities
3.0% Euro Area Cost of Risk, % Euro Area NPL Ratio %, rhs 10% 0.9
Global Financial Euro Sovereign Benign Credit Cycle Covid-19
Eurozone Banks Price to Book (x)
2.5% Crisis Debt Crisis Crisis
8% 0.8
2.0%
0.71
6%
0.7
1.5%
0.63
2.22%
4%
0.59
1.0% 0.6
1.44%
1.40%
1.38%
1.37%
1.27%
2%
0.88%
0.87%
0.80%
0.5%
0.74%
0.69%
0.69%
0.56%
0.39%
0.42%
0.39%
0.39%
0.53%
0.5
0.0% 0%
0.4
Current P/B P/B based on 2021 RoE P/B based on 2022 RoE
Rising Earnings: Improving global growth and gradually rising interest rates should boost earnings, which have
already benefitted from lower-than-expected provisions for loan losses.
Attractive Valuation: The sector’s rise in earnings will also boost return on equity, thereby warranting a higher price
to book multiple. We expect Eurozone banks to deliver 15% total return over the next 12 months.
Increased Capital Return: In contrast to the years following the global financial crisis, banks are well-capitalized
and don’t need to raise capital. In fact, banks are expected to be net buyer of their own shares after the ECB lifts ECB
restrictions in the fourth quarter.
Cost of Risk: Loan Loss Provision / Average Loans.
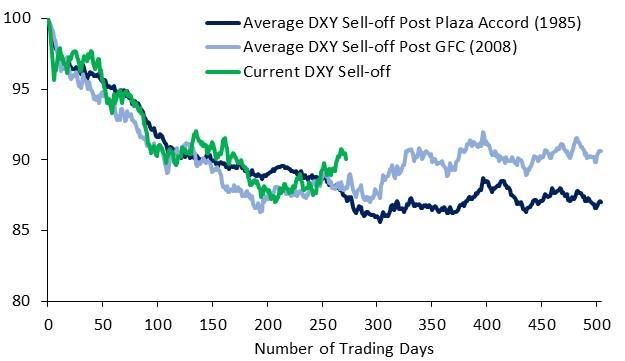
Source: Investment Strategy Group, Datastream, I/B/E/S, Morgan Stanley Research. 33We Expect the Dollar to Strengthen Relative to the Euro Consumer and
Wealth
and Swiss Franc Management
1. Major DMs Real GDP1 (Indexed to 100, 2019 End) 2. Average Dollar Index Decline
105
US Real GDP EA Real GDP
Switzerland Real GDP Japan Real GDP 102.8
100 100.0
97.7
97.5
95
90
2019 2020 2021
US Economic Growth to Outperform Developed Market Peers: US economic growth is on pace to outperform
that of the Eurozone, Japan and Switzerland by 3-5 percentage points over 2020 and 2021 combined. In fact, the US
is the only developed economy whose GDP is set to exceed its pre-pandemic level by the end of the 2021.
Relative Central Bank Postures: The euro, yen and franc will continue to be attractive funding currencies relative to
the dollar as the Federal Reserve is likely to begin preparing the market for the tapering of its quantitative easing
program well before similar policy normalization steps from other developed market central banks.
Historic Dollar Analogues: Dollar bear cycles on average stabilized after drawdowns similar to the contemporary
sell-off. Therefor, past performance suggests the dollar may have limited downside relative to current market pricing
(1) Based on ISG Forecast except for Switzerland, which is based on average of IMF and BBG Consensus Forecast.
Source: ISG, IMF, Bloomberg. 34Consumer and
Wealth
US Preeminence (I) Management
1. GDP Per Capita 2. Post-GFC Cumulative Real GDP Growth 3. Cumulative Change in Household Leverage
($000) US Eurozone Cumulative Real GDP Growth % of GDP
30% 50
70 UK Japan Germany
China Germany US Germany Eurozone UK Japan
63.1 40 Eurozone 40
25%
60 22.8%
Japan
20% 30 China
50 17.0%
45.5 UK
15% 20
39.4 US
40 39.0 10.4%
10% 10
37.4 8.6%
5
30 7.2%
5% 0 1
-8
20 -5
0% -10
10 10.6 -5% -20
-22
0 -10% -30
2000 2002 2004 2006 2008 2010 2012 2014 2016 2018 2020 Jun-09 Jun-11 Jun-13 Jun-15 Jun-17 Jun-19 2008 2009 2010 2011 2012 2013 2014 2015 2016 2017 2018 2019 2020
5. Research and Expenditure Development Over 6. Applications for Invention Patents Filed
4. Working-Age Population Projections
Time Abroad
Indexed (2020 = 100) US Eurozone Applications in 2018 (Thousands)
Germany UK US$ billions
130 Japan China 700 250 236
US
India
120 Japan 207
600 Germany 548
110 South Korea 200
500 China
100
150
90 400
105
80
300 304
100 84
77
70
200
60 162
50
123
50 100
83
40 0 0
2020 2030 2040 2050 2060 2070 2080 2090 2100 1953 1963 1973 1983 1993 2003 2013 South Korea China Germany Japan US
Sources: Investment Strategy Group, Haver, Goldman Sachs Global Investment Research. BIS, Datastream, IMF, World Bank, United Nations Population Division, World Intellectual 35
Property Organization.Consumer and
Wealth
US Preeminence (II) Management
1. Human Capital Index 2. Countries’ Level of Output Per Worker 3. Average Corporate Management Score
PPP (2017 US$)
4 3.7 3.7 3.7 3.8 140,000 3.50
3.6
3.4
3.2 3.3 3.3
120,000
2.9 3.2
2.7
3.25 3.1 3.2 3.2
3
2.6 100,000
3.0 3.0
2.1 2.9
3.00 2.9
80,000
2
2.7
60,000 2.75 2.7 2.7 2.7
2.6 2.7
40,000 2.5
1
2.50
20,000
0 0 2.25
4. Global Manufacturing Cost-Competitiveness
5. Charges for the Use of Intellectual Property 6. Earnings Growth since Pre-GFC Peak
Index
US = 100 US$ billions 100 US
125 2004 2019 122 250 Receipts Payments Eurozone
UK
118 80
Cumulative Earnings Growth Since Pre-GFC Peak (%)
120 117116 211 Japan
115
115 113 112
EM 64
200 60
China
107108
43
110 107 40
105 103 103 104104 141
150
100 99 100 20
100 97 117
0
95 92
100 75 -6
90 86 87 -20 -17
85 43 47
50 36 -40
26 25 -28 34
80 16 17 -49
-50
7 -60
0
EU US Japan Germany UK China -80
Oct-07 Apr-09 Oct-10 Apr-12 Oct-13 Apr-15 Oct-16 Apr-18 Oct-19
Sources: Investment Strategy Group, Haver, Goldman Sachs Global Investment Research. BIS, Datastream, IMF, World Bank, United Nations Population Division, BCG. 36Consumer and
Wealth
US Preeminence (III) Management
1. Real GDP Growth and Equity Market Characteristics (%ann.)1 – As of
2. Large Chinese Companies and US and/or Israeli Predecessors
March 2021
US China
36% Chinese Companies US/Israeli Companies
32.0%
E-Commerce Alibaba (1999) Amazon (1994)
32%
JD.com (1998) eBay (1995)
28%
Pinduoduo (2015) Groupon (2008)
Social Network Tencent (1998) Facebook (2004)
24%
Tencent OICQ/QQ
20% Instant Messaging ICQ (1996)
(1998)
% ann.
16% 14.7% Web Search Baidu (2000) Google (1998)
Smartphones Huawei (1987) Apple (1976)
12%
10.3% Xiaomi (2010)
9.1%
Streaming iQiyi (2010) Netflix (1997)
8%
5.6% Microblogging Sina Weibo (2009) Twitter (2006)
4% 2.7% Online Payments Alipay (2004) PayPal (1998)
2.3%
1.7%
0%
Real GDP Growth Equity Market Return EPS Growth Volatility
(1) Based on data since inception of the MSCI China Index on 12/31/1992.
Source: Investment Strategy Group, Datastream, MSCI. 37Consumer and
Wealth
US Preeminence (IV) Management
GDP Per Capita vs. Growth in Subsequent 5 Years
Real GDP per capita growth in subsequent 5 years (% YoY)
12 China
11 Korea
10 Taiwan
9 Hong Kong
8 Singapore
7
6
5
4
3
2
1
0
-1
5,000 15,000 25,000 35,000 45,000 55,000
Real GDP Per Capita
Source: Investment Strategy Group, Haver. 38Stay Invested: The Hurdle to Underweight Equities is High Consumer and
Wealth
Given the Upward Trend in the Earnings and Prices Management
1. S&P 500 Price Index vs. Earnings 2. S&P 500 Bull and Bear Markets Over the Post-WWII Period1
S&P 500 Trailing-12-Month Reported Earnings S&P 500 Price Index
Bull Market Bear Market
Indexed Value in Log Scale (1945=100)
6250
1,000
S&P 500 Price Index (in Log Scale)
1250
100
250
50 10
1945 1955 1965 1975 1985 1995 2005 2015 1945 1950 1955 1960 1965 1970 1975 1980 1985 1990 1995 2000 2005 2010 2015 2020
Tailwind of Earnings Growth: S&P 500 companies have grown their earnings at a steady rate of 6% per year since WWII.
Earnings also grow more often than not, as they have increased 69% of the time and declined 31% of the time since WWII.
Long-Term Trend of Prices: Prices of US equities follow the path of corporate earnings in the long run. The correlation
between 10-year price returns and 10-year earnings growth has been 0.50.
Asymmetry of Tactical Asset Allocation: Overweighting equities when they are cheap has a greater probability of success
than underweighting equities when they are expensive. Equities are an appreciating asset class whose earnings grow with
the economy, and have always recovered from bear markets eventually, typically within two years, on average.
We do not endorse a buy-and-hold investment strategy but instead recognize that the odds of success when underweighting
equities is low unless valuations and the odds of recession are both excessively high, neither of which apply today.
(1) Shaded periods denote US recessions. 1947-1948 is colored blue because it was neither a bull nor a bear market.
Source: Investment Strategy Group, Bloomberg, S&P Global, Robert Shiller, NBER.
39Financial Market Reaction to Catastrophes and Surprises is Consumer and
Wealth
Unpredictable Management
1. S&P 500 Index Performance in the Context of COVID-19 Infections –
2. S&P 500 Price Index and ISG Tactical Tilts1 – Through April 6, 2021
Through April 5, 2021
4000 7-Day Moving Average of Global COVID Infections (Right) 800,000 S&P 500 Price Index
S&P 500 Price Index (Left) 4,000 Added S&P 500 Exposure
3800
700,000 Reduced S&P 500 Exposure
3,800
3600
600,000 3,600
3400
3,400
S&P 500 Price Index
500,000
3200
3,200
Infections
3000 400,000
3,000
2800
300,000 2,800
2600
2,600
200,000
2400 2,400
100,000
2200 2,200
2000 0 2,000
Jan-20 Mar-20 May-20 Jul-20 Sep-20 Nov-20 Jan-21 Mar-21 De c-19 Mar-2 0 Jun -20 Sep -20 De c-20 Mar-2 1
Shocks like pandemics, tsunamis and wars are inevitable, but since they cannot be predicted, it is best to ride them out.
No equity investor would have predicted a US equity market return of 18% in 2020 in the face of nearly 20 million
reported coronavirus infections and 345,000 fatalities, an estimated GDP decline of 3.5%, an estimated earnings decline
of 17%, and about 11 million unemployed people in the US.
Our strategy was to increase equity exposure as the S&P 500 became cheap enough to offer compelling value for a long-
term investor and reduce it as prices recovered. All told, we recommended 19 tactical tilts on the S&P 500 last year.
The recommendation for clients to rebalance their portfolios after they had deviated 5% from their strategic target was
even more impactful, adding an incremental 1.9% returns to a moderate risk portfolio last year.
(1) Tactical tilts shown are only those published during the year 2020 related to the S&P 500.
Source: Investment Strategy Group, Bloomberg, Datastream, WHO, National Health Commission of PRC, John Hopkins University, NEJM.
40Consumer and
Wealth
Risks to Our 2021 Outlook Management
COVID-19 Pandemic
US-China Relations
Geopolitical
Cybersecurity
Domestic Policies
“Techlash”
Recession
41Consumer and
Wealth
Western Developed Countries’ Perception of China Management
1. % of Americans Surveyed with Opinion 2. % of French Surveyed with Opinion 3. % of Germans Surveyed with Opinion
100% Unfavorable Favorable 100% Unfavorable Favorable
100% Unfavorable Favorable
80% 80%
80% 73% 70% 71%
60% 60% 60%
40% 40% 40%
20% 26% 25%
20% 20%
22%
0% 0%
0%
20 05 20 06 20 07 20 08 20 09 20 10 20 11 20 12 20 13 20 14 20 15 20 16 20 17 20 18 20 19 20 20 20 05 20 06 20 07 20 08 20 09 20 10 20 11 20 12 20 13 20 14 20 15 20 16 20 17 20 18 20 19 20 20
20 05 20 06 20 07 20 08 20 09 20 10 20 11 20 12 20 13 20 14 20 15 20 16 20 17 20 18 20 19 20 20
4. % of Britons Surveyed with Opinion 5. % of Japanese Surveyed with Opinion 6. % of Koreans Surveyed with Opinion
100% 100% Unfavorable Favorable
Unfavorable Favorable 100% Unfavorable Favorable
86%
80% 80%
74% 80% 75%
60% 60%
60%
40% 40%
40%
20% 22% 20%
20% 24%
9%
0% 0% 0%
20 05 20 06 20 07 20 08 20 09 20 10 20 11 20 12 20 13 20 14 20 15 20 16 20 17 20 18 20 19 20 20 20 05 20 06 20 07 20 08 20 09 20 10 20 11 20 12 20 13 20 14 20 15 20 16 20 17 20 18 20 19 20 20 20 05 20 06 20 07 20 08 20 09 20 10 20 11 20 12 20 13 20 14 20 15 20 16 20 17 20 18 20 19 20 20
Data as of 2020. Note: 2020 survey was mid-year. All other years’ surveys were as of the end of the year. Source: Investment Strategy Group, Pew Research. 42Consumer and
Wealth
Key Takeaways Management
Strong pickup in global growth: We expect most countries to grow above trend as they recover from the pandemic-
induced recession. The US and China will likely be the only two large economies whose GDP levels at the end of 2021
will be higher than in 2019.
Accommodative monetary and fiscal policy: : Among those in developed economies, we expect the US Federal Reserve
to be the first to raise policy rates, but our base case is that the first such tightening is still some two and a half years
away. In the US, the Biden administration is set to deliver more fiscal stimulus.
Low risk of recession: We have assigned a 10% risk of recession in the US and globally over the next year.
Abundance of risks: The two greatest risks we face are a worsening of the pandemic and a deterioration in US-China
relations.
Attractive portfolio returns: We expect moderate-risk and well-diversified portfolios to return just under 6% in 2021,
driven by 8–10% return from US and non-US equities and modestly negative returns in high-quality fixed income
securities.
Stay invested: While the margin of safety has declined given current high valuations in equities, we recommend clients
stay invested at this time. We believe we are in the nascent stage of a multiple-year economic expansion that supports
mid-single-digit annualized equity returns that are superior to cash and bonds.
US preeminence is intact, supported by economic strength, abundant natural resources, human capital advantages, and a
vibrant, innovative and efficient private corporate sector.
43
Source: Investment Strategy Group.Consumer and Wealth Management Appendix
Consumer and
Wealth
Global Equities: Sector Composition Management
Sector Composition (% of Index Market Cap) – As of April 2, 2021
MSCI EAFE MSCI EM
Sector S&P 500 Difference vs Difference vs
Weights Weights
S&P 500 S&P 500
Communication Services 11.0% 5.3% -5.7pp 12.0% 1.0pp
Consumer Discretionary 12.4% 12.8% 0.4pp 17.8% 5.4pp
Consumer Staples 6.1% 10.2% 4.1pp 5.6% -0.5pp
Energy 2.8% 3.3% 0.4pp 4.8% 1.9pp
Financials 11.3% 17.3% 5.9pp 18.0% 6.6pp
Health Care 12.8% 11.9% -0.9pp 4.5% -8.4pp
Industrials 8.8% 15.5% 6.7pp 4.3% -4.5pp
Information Technology 26.9% 9.1% -17.8pp 21.1% -5.8pp
Materials 2.7% 7.9% 5.3pp 8.0% 5.3pp
Real Estate 2.5% 3.1% 0.6pp 2.1% -0.4pp
Utilities 2.6% 3.6% 1.0pp 2.0% -0.7pp
Compared with international equities, the S&P 500 is overweight information technology and underweight financials
and commodities.
45
Source: Investment Strategy Group, Datastream, MSCI.EM Equity Valuations Are Expensive Even When Consumer and
Wealth
Adjusting for Today’s Sector Composition Management
1. MSCI EM Price/Forward Earnings Ratio – Through April 2, 2021 2. MSCI EM NTM EPS – Through April 2, 2021
21x Actual (20y Avg. = 11.3x) Keeping Today's Weights Constant (20y Avg. = 11.9x) 120
18.5
19x (Mar-09)
100
$86
MSCI EM Price/Forward Earnings Ratio
17x 16.2 (Jan-20) $88
(Jun-20)
80
15.1
MSCI EM NTM EPS
15x
+28%
$69
13x 60 (Jun-20)
$52
11x (Mar-09)
40
9x
20
7x
5x 0
2001 2003 2005 2007 2009 2011 2013 2015 2017 2019 2021 2001 2003 2005 2007 2009 2011 2013 2015 2017 2019 2021
Some investors argue that MSCI EM valuations should be expensive relative to history given the change in the index’s
sector composition over the last several years, with a larger weight in growth sectors such as info tech and consumer
discretionary and a smaller weight in value sectors such as financials and commodities.
That said, EM equity valuations still look very elevated even when taking that into account. The only other points in
time over the last two decades when MSCI EM’s P/E ratio was meaningfully more expensive than today were in
March 2009 and June 2020, but that was entirely due to depressed earnings estimates—which is not the case currently.
46
Source: Investment Strategy Group, FactSet.Consumer and
Wealth
Presenter Biographies Management
Sharmin Mossavar-Rahmani
Partner, Head of the Investment Strategy Group (ISG) and CIO for the Consumer and Wealth Management
Division
+1 (212) 902 – 2300
Sharmin is head of the Investment Strategy Group and chief investment officer for the Consumer and Wealth
Management Division, responsible for the overall strategic asset allocation and tactical investment strategy.
Sharmin joined Goldman Sachs as a partner in 1993. Prior to joining the firm, Sharmin worked at Fidelity Management Trust
Company, where she was chief investment officer for all separate and co-mingled fixed income accounts. Sharmin is a member of
the Board of Trustees and the Investment Committee of New York-Presbyterian Hospital and Harvard University's Global Advisory
Board. She is a former member of the Board of Trustees, and former chair of the Investment Committee of the Trinity School in
New York City. Sharmin has published two books, one on bond indexing and one on OPEC natural gas, as well as numerous articles
on portfolio management issues. Sharmin earned a BA from Princeton University and an MS from Stanford University.
Lisa Rotenberg
Managing Director, Goldman Sachs Senior Coverage Responsibility for CRPTF
+1 (212) 902 – 7987
Lisa is a managing director with senior coverage responsibility for many of Goldman Sachs’ largest institutional
investors globally, and leverages her experience with portfolio solutions to advise clients. She has held many roles
in the Asset Management Division (AMD) including serving as co-head of the US Public Fund business, co-head
of the Corporate Pension business, and as global head of the Consultant Relations business. Lisa was named a Goldman Sachs
managing director in 2003. She joined as a vice president in 1994. Prior to joining the firm, Lisa served as Minnesota’s deputy state
auditor representing the state auditor in all plan sponsor decisions related to the Minnesota State Board of Investment. She also
served as Minnesota’s chief deputy commerce commissioner with oversight responsibility for the securities, insurance, banking, and
real estate industries. Prior to joining the Minnesota Department of Commerce, Lisa served as a special assistant attorney general for
the State of Minnesota. She previously served on the Minnesota Governor’s Task Force on Small Business Capital Formation. Lisa
earned an AB in Government from Harvard University and a JD from the University of Minnesota Law School, where she also
served on the Board of Advisors.
47You can also read