Content Analysis of Passengers' Perceptions of Airport Service Quality: The Case of Honolulu International Airport - MDPI
←
→
Page content transcription
If your browser does not render page correctly, please read the page content below
Journal of
               Risk and Financial
               Management

Article
Content Analysis of Passengers’ Perceptions of Airport Service
Quality: The Case of Honolulu International Airport
Wonmi Bae and Junwook Chi *

                                          School of Travel Industry Management, Shidler College of Business, University of Hawaii at Manoa,
                                          2560 Campus Road, George Hall 346, Honolulu, HI 96822, USA; wonmi@hawaii.edu
                                          * Correspondence: jwchi@hawaii.edu

                                          Abstract: This paper explores passengers’ perceptions toward airport service quality through a
                                          content analysis. Using 1341 review comments posted on the Skytrax website, we identify satisfiers,
                                          dissatisfiers, and performance factors that determine passengers’ experiences at the Honolulu In-
                                          ternational Airport and the world’s leading airports (Singapore Changi Airport, Haneda Airport,
                                          Incheon International Airport, Hamad International Airport, and Hong Kong International Airport).
                                          The results show that the Honolulu International Airport needs to improve cleanliness of the facilities,
                                          signage, and staff courtesy. A context-specific examination reveals that security, check, flight, line, and
                                          staff are the most frequently occurring words used by dissatisfied passengers. The most common
                                          words mentioned by satisfied users of the world’s leading airports include staff, terminal, clean, time,
                                          immigration, and free. These findings provide suggestions and implications concerning customers’
                                          perspectives and may help airport managers enhance airport service quality and renovate airport
                                          facilities.

                                Keywords: airport service quality; content analysis; Honolulu international airport; sentiment

                                          analysis; text analytics technique
Citation: Bae, Wonmi, and Junwook
Chi. 2022. Content Analysis of
Passengers’ Perceptions of Airport
Service Quality: The Case of
                                          1. Introduction
Honolulu International Airport.
Journal of Risk and Financial                  Customer satisfaction and perceived value can determine destination image and
Management 15: 5. https://doi.org/        market propensity and understanding passengers’ perceptions of airport service quality
10.3390/jrfm15010005                      is necessary for airport management and tourism development. Airports have become a
                                          dynamic space for enjoying shopping, experiencing leisure activities, and relaxing during
Academic Editor: Thanasis Stengos
                                          a stop-over. Since tourism services begin and end at an airport, a commercially oriented
Received: 24 November 2021                and competitive airport is vital for tourism growth and destination competitiveness (Gupta
Accepted: 28 December 2021                and Venkaiah 2015; Wattanacharoensil et al. 2017). Satisfied passengers are more likely to
Published: 30 December 2021               spread positive word-of-mouth, contributing to traveler retention and destination loyalty
Publisher’s Note: MDPI stays neutral
                                          (Della Corte et al. 2015; Prentice and Kadan 2019). Therefore, enhancing visitor satisfaction
with regard to jurisdictional claims in   and destination image can produce economic benefits and competitive advantages for
published maps and institutional affil-   destinations.
iations.                                       To measure passenger satisfaction and airport service quality, various methods have
                                          been employed in the literature (e.g., Ching and Lau 2016; Eboli and Mazzulla 2009; Fodness
                                          and Murray 2007; Kurniawan et al. 2017; Maslen 2014; Pabedinskaitė and Akstinaitė 2014;
                                          Lupo 2015; Pantouvakis and Renzi 2016; Tsai et al. 2011). A growing body of research has
Copyright: © 2021 by the authors.         recently used online reviews and content analysis tools to examine airport service quality
Licensee MDPI, Basel, Switzerland.        and performance from the passenger’s point of view. A number of studies have relied
This article is an open access article    on Leximancer to analyze online reviews of airports (e.g., Zakrzewski 2008; Chuchu 2017;
distributed under the terms and           Brochado et al. 2019; Zhao 2019). Leximancer is a new technique that employs statistical
conditions of the Creative Commons
                                          algorithms to analyze natural language and organize text into sentiment terms. The benefits
Attribution (CC BY) license (https://
                                          of using Leximancer software are that, based on word frequency and connectivity, it enables
creativecommons.org/licenses/by/
                                          researchers to identify main concepts and discover linkage between each concept (Smith
4.0/).

J. Risk Financial Manag. 2022, 15, 5. https://doi.org/10.3390/jrfm15010005                                      https://www.mdpi.com/journal/jrfm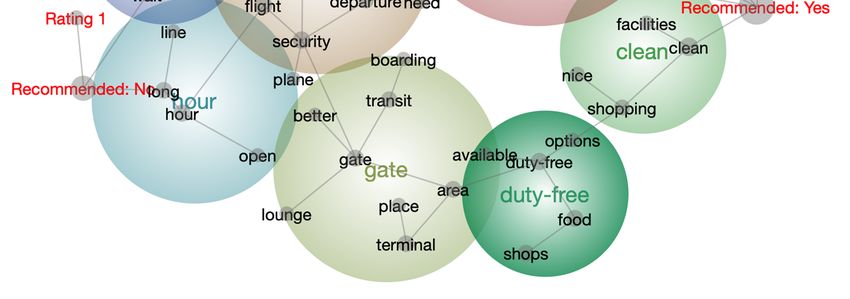
J. Risk Financial Manag. 2022, 15, 5                                                                                          2 of 19

                                       and Humphreys 2006). In addition, Leximancer is effective for a large volume of data so
                                       researchers can quickly determine and highlight the important concepts (Azeem et al. 2012).
                                       Other studies have used NVivo to analyze travelers’ perceptions of airports (Caballero
                                       Galeote and Mestanza 2020). Unlike Leximancer’s automatic content analysis, NVivo
                                       provides various functions for manipulating data records, coding, and performing text
                                       search queries. Nvivo is appropriate for a small volume of data, so it helps to focus on more
                                       specific words. With Nvivo, researchers are able to organize and categorize main concepts,
                                       so it is advantageous for determining important themes (Zakrzewski 2008). Therefore,
                                       it helps researchers extract ideas and link them with data to address specific research
                                       questions (Azeem et al. 2012). By using Leximancer, we can identify general main concept
                                       ideas and word connectivity, and by using Nvivo, we can verify more detailed information
                                       or words. Since Honolulu airport offers small sample numbers, combining Leximancer and
                                       Nvivo will help to enhance the reliability and accuracy of the study results.
                                             The purpose of this paper is to further assess passengers’ perceptions toward airport
                                       service quality using the airline passengers’ online review and content analysis tools. This
                                       paper conducts an analysis of concept maps, word frequencies and trees, and service
                                       attribute ratings to evaluate customer sentiments. Data visualization reveals key factors
                                       influencing passengers’ satisfaction and dissatisfaction with airport experiences.
                                             Our study differs from previous studies in two aspects. First, we consider a case study
                                       of the Honolulu International Airport in comparison to the world’s top five airports (Singa-
                                       pore Changi Airport, Haneda Airport, Incheon International Airport, Hamad International
                                       Airport, and Hong Kong International Airport). This approach allows direct comparisons
                                       of the crucial drivers for traveler experiences with the Honolulu International Airport and
                                       the leading global airports. The prevailing satisfiers and dissatisfiers are also compared
                                       using airport benchmarking of the world’s top five airports (Skytrax 2018).
                                             The Honolulu International Airport (HIA) is one of the 30 busiest airports in the
                                       United States. In 2018, over 20 million passengers used HIA, and the airport supported
                                       about 15,000 jobs and generated $629 million in revenue (Hawaii Tourism Authority 2019).
                                       Despite the significant role of the airport in the Hawaiian tourism industry, HIA was rated
                                       only 2 out of 10 in terms of overall service quality (Skytrax 2018). According to U.S. News
                                       & World Report (2019), a customer survey of airport users ranked HIA as the third worst
                                       among North American airports, with a satisfaction score of 719 out of 1000 points. Given
                                       the large gap between passenger expectations and actual services delivered at HIA, it is
                                       timely and necessary to perform a sentiment analysis of airport service quality to provide
                                       more useful information to the airport authority and help improve the tourism industry.
                                             Another unique aspect of this paper is that we use both text analytics techniques and
                                       sentiment analysis to compare the results. Leximancer has several advantages over other
                                       content analysis tools. It is efficient for analyzing a large volume of data and appropriate
                                       for exploratory and predictive analytics (Smith and Humphreys 2006). The results are
                                       reliable as Leximancer automatically generates a list of important themes and concepts
                                       from the data without manual coding. This feature helps prevent researcher bias and
                                       subjectivity. However, Leximancer can produce unexpected or unexplained concepts and
                                       interrelationships, making it difficult to interpret results and draw conclusions (Sotiriadou
                                       et al. 2014). To treat this issue, we adopt NVivo text analysis software for an interpretive
                                       approach. NVivo requires manual data handling and is more suitable than Leximancer
                                       for a researcher-driven study. Researchers need to manage and organize data to interpret
                                       results appropriately.
                                             Three research questions drive this study: (1) What are the most important themes and
                                       concepts associated with HIA and the world’s leading airports? Using Leximancer’s con-
                                       cept maps, we explore dominant themes and interrelationships among concepts. (2) What
                                       are the satisfiers, dissatisfiers, and performance factors that determine passengers’ expe-
                                       riences at airports? Using NVivo’s data visualization, we identify the most frequently
                                       mentioned words in positive and negative user review comments to analyze which airport
                                       service factors are essential to meet passengers’ expectations (dissatisfiers) and which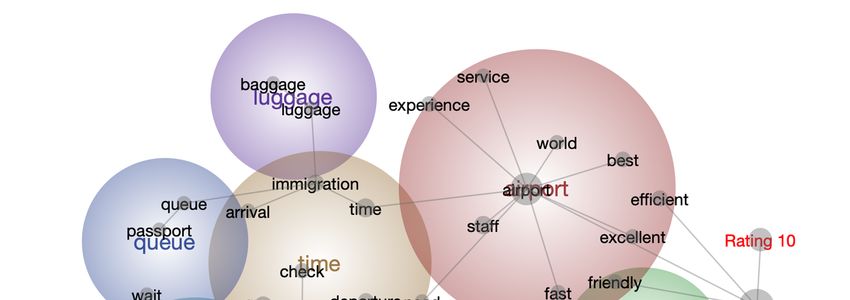
J. Risk Financial Manag. 2022, 15, 5                                                                                            3 of 19

                                       service elements serve to enhance passenger satisfaction (satisfiers). (3) What are the levels
                                       of air passengers’ satisfaction and dissatisfaction with HIA compared to the world’s leading
                                       airports? We compare and evaluate the average ratings of the airports using eight service
                                       attributes (queuing, time, terminal cleanliness, terminal seating, terminal sign, food and
                                       beverage, airport shopping, WI-FI, and airport staff).
                                             The rest of the paper is organized as follows. The next section provides a review of
                                       the literature on customer surveys, interviews, and online reviews for the study of airport
                                       service quality. The content analysis and data used in this study are then discussed. The
                                       following section provides the results of content analysis, with special emphasis on the
                                       comparison of Leximancer and NVivo results. Finally, the last section presents important
                                       policy implications and limitations of this study.

                                       2. Literature Review
                                       2.1. Traditional Customer Satisfaction Surveys and Interviews
                                             As airports become more competitive, it is imperative to investigate travelers’ per-
                                       ceptions of airport service quality so airport managers can understand, meet, and exceed
                                       their customers’ expectations. Customer surveys have been widely used to evaluate airport
                                       customer satisfaction and service quality. A large number of studies have investigated
                                       the importance of airport service quality by conducting surveys and suggested possible
                                       improvement proposals (Allen et al. 2020a, 2020b, 2021; Bellizzi et al. 2018; Ceccato and
                                       Masci 2017; Brida et al. 2016; Pandey 2016; Bezerra and Gomes 2015, 2016; Paramonovs
                                       and Ijevleva 2015; Jeon and Kim 2012; Liou et al. 2011). For example, Allen et al. (2021)
                                       investigated airport passengers’ satisfaction to create practical strategies for airport ser-
                                       vices. Using passenger surveys from the Lamezia Terme international airport in Italy, they
                                       claimed that operators should focus on airport cleanliness to improve airport service quality.
                                       Allen et al. (2020b) employed a SEM approach to investigate airport service quality and
                                       found that environment (e.g., terminal cleanliness) and control (e.g., security) factors are
                                       the most significant dimensions that influence passengers’ overall satisfaction. Bellizzi et al.
                                       (2018) conducted face-to-face interviews to evaluate passengers’ satisfaction toward the
                                       Lamezia Terme airport’s service quality and revealed that satisfaction factors and levels
                                       differ depending on travelers’ backgrounds. Paramonovs and Ijevleva (2015) also employed
                                       a survey method to analyze major satisfaction factors for passengers at Riga International
                                       Airport in Latvia. Using 937 valid samples, the results indicated that telecommunications,
                                       effective signage, clean restrooms, staff courtesy, and availability are key factors affecting
                                       air passengers’ satisfaction.
                                             Similarly, Bezerra and Gomes (2015) focused on passenger characteristics and critical
                                       service factors that influence travelers’ satisfaction with airports. Their study used surveys
                                       from departing passengers at the Guarulhos International Airport and found that perceived
                                       levels of service quality dimensions vary across travelers’ characteristics. Liou et al. (2011)
                                       surveyed Taiwan International airport customers’ satisfaction using the dominance-based
                                       rough set approach (DRSA). The results indicated that face-to-face contact, such as staff
                                       courtesy and security, is a significant factor affecting passenger satisfaction. Furthermore,
                                       Brida et al. (2016) examined the relationship between Information and Communication
                                       Technology services (ICTs) and airport customers’ perception toward the Chile airport
                                       service quality. Based on the surveys with 995 participants, the study concluded that
                                       improving information and communication technologies would provide more positive
                                       experiences to passengers and improve airport service quality. Pandey (2016) assessed
                                       airport service quality at the Suvarnabhumi (BKK) and Don Mueang (DMK) airports in
                                       Thailand. The result showed that DMK airport needs to improve check-in and security
                                       lines, washroom cleanliness, and baggage claim area service, while BKK airport needs to
                                       enhance restaurant facilities.
                                             In addition, Ghazi and Ammar (2018) studied air passengers’ attitudes toward duty-
                                       free shopping and airport food and beverage selections. They concluded that cognitive and
                                       affective evaluations could increase international visitors’ satisfaction and positively affect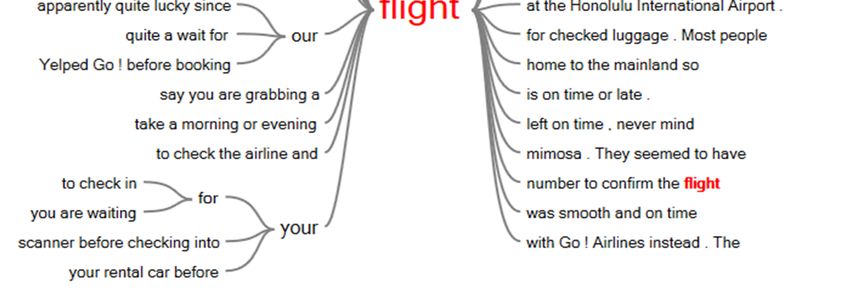
J. Risk Financial Manag. 2022, 15, 5                                                                                            4 of 19

                                       their intentions to revisit and recommend the service. Ceccato and Masci (2017) explored
                                       the linkage between airport environments and passengers’ perceived safety. Using 3859
                                       passengers’ responses, the results showed that a subpar airport environment, such as
                                       uncleanly bathrooms, limited dining options, and slow-moving security checkpoints, is
                                       more likely to elicit negative customer perceptions. Jeon and Kim (2012) studied the
                                       relationship between airport servicescape, emotional states, and behavioral intentions.
                                       They collected 300 samples from Incheon International Airport passengers, finding that
                                       functional, safety, esthetic, and social factors are related to positive emotions, while ambient
                                       and social factors are related to negative emotions.

                                       2.2. Social Networks and Other Online Reviews
                                             While traditional surveys and interviews are valuable sources of data, the contents of
                                       online reviews have been utilized in recent research to evaluate airport performance and
                                       service quality. Analyzing online reviews can be a cost- and time-efficient method to obtain
                                       customer perceptions and track recent service trends. It has been claimed that sentiment
                                       analysis of online reviews can identify newer insights into airport service quality than
                                       traditional techniques (Martin-Domingo et al. 2019). Because online reviews enable service
                                       providers to identify their customers’ satisfaction and dissatisfaction levels, such customer
                                       feedback can be a useful resource for the tourism and hospitality industry (Schuckert
                                       et al. 2015). For example, Bogicevic et al. (2013) used a visual data mining technique to
                                       evaluate airport customer satisfaction and airport service quality. Their study used 1095
                                       air passengers’ reviews and applied the most frequently identified attributes to explore
                                       factors affecting airport customers’ satisfaction and dissatisfaction. The results showed that
                                       a pleasant and clean environment is most often related to satisfaction, while security, signs,
                                       and poor restaurants are more frequently related to dissatisfaction.
                                             Straker and Wrigley (2018) analyzed the top 100 airports’ mission statements and
                                       digital channels to investigate the link between digital channel typologies and content
                                       needs. Their findings indicated that well-designed mission statements delivered through
                                       digital channels can increase customer satisfaction. Using 9632 passenger comments posted
                                       on Skytrax (2018) examined the relationship between customer satisfaction and various
                                       attribute ratings, such as seat comfort, staff, ground service, and entertainment. Their study
                                       reported that ground services including a lounge’s physical environment, baggage claim,
                                       and ticketing experiences, are essential factors affecting air passengers’ experiences and
                                       satisfaction.
                                             A growing body of research has recently used content analysis tools to examine airport
                                       service quality and performance from the passenger’s point of view. A number of studies
                                       have relied on Leximancer to analyze online reviews of airports (e.g., Brochado et al.
                                       2019; Zhao 2019; Chuchu 2017; Zakrzewski 2008). Leximancer is a new technique that
                                       employs statistical algorithms to analyze natural language and organize text into sentiment
                                       terms. For instance, Brochado et al. (2019) used 1200 online reviews from TripAdvisor
                                       to explore travelers’ experiences with air transport services. The results of Leximancer
                                       analysis showed that airport operations, such as check-in, baggage handling, and boarding
                                       gate, are major drivers of air passengers’ overall satisfaction. Using review comments from
                                       Skytrax about Chinese airlines, Zhao (2019) examined passengers’ perceptions of service
                                       quality and travelers’ intention to recommend, finding that value for money is the crucial
                                       attribute for all types of passengers.
                                             Other studies have used NVivo to analyze travelers’ perceptions of airports (e.g.,
                                       Caballero Galeote and Mestanza 2020; Wattanacharoensil et al. 2017; Azeem et al. 2012).
                                       Unlike Leximancer’s automatic content analysis, NVivo provides various functions for
                                       manipulating data records, coding, and performing text search queries. Therefore, it helps
                                       researchers extract ideas and link them with data to address specific research questions. For
                                       example, Caballero Galeote and Mestanza (2020) studied the perceptions of both residents
                                       and international travelers toward services at the Málaga-Costa Del Sol Airport. The results
                                       of NVivo analysis suggested that residents and travelers have different points of view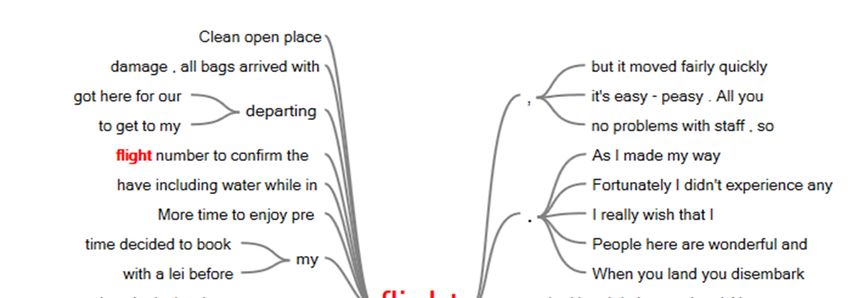
J. Risk Financial Manag. 2022, 15, 5                                                                                             5 of 19

                                       regarding negative externalities of the airport (e.g., pollution, noise, and mass tourism),
                                       revealing that international travelers exhibited almost no concerns about these issues.
                                       Wattanacharoensil et al. (2017) used NVivo to examine airport customer experiences in
                                       relation to their views of the destinations. Based on 732 reviews for 15 airports, they found
                                       that an airport is an important internal component of the tourism experience and can affect
                                       an air passenger’s positive perceptions of a destination.

                                       3. Method
                                            A content analysis is suitable for qualitative research and trend analysis, and it can
                                       capture any type of text, video, or image. The main advantages of a content analysis are
                                       its ability to coordinate information from unorganized documents and its applicability
                                       to both qualitative and quantitative research (Aureli 2017; Hsieh and Shannon 2005). It
                                       effectively captures the characteristics and meanings behind the text of a message and
                                       identifies complex concepts that otherwise cannot be efficiently summarized.

                                       3.1. Leximancer and NVivo
                                             For comparison purposes, we use both text analytics techniques and sentiment analysis
                                       to identify crucial factors affecting traveler experiences from traveler reviews and comments.
                                       First, Leximancer is used to visually display major themes and concepts based on frequency
                                       of text. Each bubble in a concept map indicates a different theme. The larger the bubble, the
                                       more frequently that term or theme is mentioned in review texts. In terms of bubble color,
                                       warm colors (e.g., red or orange) denote more important and relevant themes, while cool
                                       colors (e.g., green or blue) imply less significant themes (Leximancer 2020). Bubble overlap
                                       indicates that those themes are related to each other and that reviewers frequently mention
                                       these words together. On the other hand, bubbles at a distance from each other imply that
                                       the themes are not correlated with each other. Leximancer automatically generates a ranked
                                       concept list based on relevance and word frequency.
                                             Next, NVivo is employed to demonstrate the most frequently mentioned words for
                                       positive and negative comments. In this paper, the data are divided into two groups
                                       based on the reviewers’ intention to recommend the airport. The word frequency analysis
                                       then identifies satisfiers, dissatisfiers, and performance factors that determine passengers’
                                       experiences at airports. Matzler and Sauerwein (2002) claimed that performance factors can
                                       generate a high level of customer satisfaction when fulfilled but at the same time result in a
                                       high level of dissatisfaction when neglected. Thus, performance factors can appear in the
                                       words and phrases most frequently mentioned by both satisfied and dissatisfied travelers.
                                       NVivo creates word trees to demonstrate a branching view of frequently occurring words.
                                       Finally, we compare individual rating scores across eight airport attributes (queuing time,
                                       terminal cleanliness, terminal seating, terminal sign, food and beverage, airport shopping,
                                       WIFI, and airport staff). The null hypothesis for the equality of two mean values between
                                       HIA and the world’s leading airports is tested to examine the levels of airport customer
                                       satisfaction.

                                       3.2. Skytrax Data
                                             This study uses review comments posted between 2004 and 2019 on Skytrax, the
                                       largest airport and airline review site with over 700 airports. Skytrax is a useful resource for
                                       researchers in analyzing air passengers’ experiences and perspectives regarding airport and
                                       airline services (Wattanacharoensil et al. 2017) and offers a verification system to increase
                                       the validity of air passenger reviews. This paper describes a case study comparing HIA to
                                       a group of the world’s leading airports. According to Skytrax (2018), Singapore Changi
                                       Airport, Haneda Airport, Incheon International Airport, Hamad International Airport, and
                                       Hong Kong International Airport received the highest overall scores and were voted the
                                       world’s top five airports by international travelers. These airports are selected to identify
                                       the key service elements that achieve high passenger satisfaction. In this paper, we collect a
                                       total of 1341 usable review comments (139,560 words) and rating scores of service attributes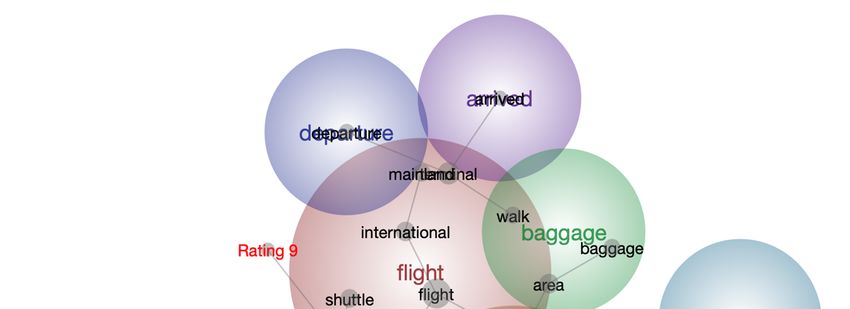
J. Risk Financial Manag. 2022, 15, 5                                                                                                             6 of 19

                                       of the HIA (72 reviews, 10,037 words), as well as the five comparable airports (1269 reviews,
                                       129,523 words). Only English language reviews are collected. Table 1 shows the information
                                       from review comments used in the analysis.

                                       Table 1. Information of the Honolulu International Airport and the World’s Leading Airports.

  Average Skytrax                                                                             Passengers           Number of          Number of
                              Location                  Airport Name (Code)
   Rating (2018)                                                                            (Million, 2018)         Reviews            Words
                                                 Honolulu International Airport
         2/10              United States                                                          20.99                 72              10,037
                                                             (HNL)
         7/10                Singapore           Singapore Changi Airport (SIN)                   65.60                 375             35,826
         8/10                  Japan                 Haneda Airport (HND)                         87.13                 62               7143
         6/10               South Korea        Incheon International Airport (ICN)                68.26                 241             25,080
         6/10                  Qatar           Hamad International Airport (DOH)                  34.50                 305             34.824
                                                Hong Kong International Airport
         6/10               Hong Kong                                                             74.70                 286             26,650
                                                             (HKG)
                                       Sources: Traffic Statistics Changi Airport Group, Passenger traffic at Tokyo Airport 2018, Maeil Business News,
                                       Business Traveller, Hongkong Business, and Hawaii Tourism Authority.

                                             Review titles, comments, recommendations, dates, locations, attribute ratings, and
                                       overall ratings are collected in MS-Excel spreadsheet format. Table 2 shows reviewer
                                       information for the entire sample by type of passengers, experience at the airport, review
                                       year, satisfaction rating, and recommendation. Types of passengers identified by reviewers
                                       included 165 business travelers; 139 couple leisure travelers; 165 family leisure; and 262
                                       solo travelers. Reviewer reports of their airport experience fell into these categories: 261
                                       travelers who experienced both arrival and departure; 92 who arrived only; 157 who
                                       departed only; and 221 who experienced transit only. It should be noted that the type of
                                       travel and airport experience data have been available only since June 2015. With respect to
                                       overall satisfaction ratings (on a scale from 1 to 10), there are significant differences between
                                       HIA and the world’s leading airports. For HIA, 58% (42 reviewers) selected ratings of 1 or
                                       2 (poor), while only 11% (149 reviewers) selected the same low ratings for the world’s top
                                       five airports. The largest number of respondents (468 reviewers) chose ratings of 9 or 10 for
                                       the world’s top five airports. In terms of recommendations, the majority of reviewers (67
                                       of 72 records, or a whopping 93%) would not recommend HIA to others. In contrast, 731
                                       passengers (56%) intended to recommend one of the world’s five leading airports.

                                       Table 2. Information of the Airport Reviews.

                                                                Number of Reviews              Number of Reviews (SIN,
          Category                        Details                                                                                        Total
                                                                    (HNL)                      HND, ICN, DOH, HKG)
                                         2004–2008                    11 (52.4%)                         10 (47.6%)                        21
        Review year                      2009–2014                     18 (3.3%)                        533 (96.7%)                       551
                                         2015–2019                     43 (5.6%)                        726 (94.4%)                       769
                                         Business                       6 (3.6%)                        159 (96.4%)                       165
                                       Couple leisure                 22 (15.8%)                        117 (84.2%)                       139
     Type of travelers
                                       Family leisure                  5 (3.0%)                         160 (97.0%)                       165
                                        Solo leisure                   10 (3.8%)                        252 (96.2%)                       262
                                  Arrival and departure                19 (7.3%)                        242 (92.7%)                       261
                                       Arrival only                     2 (2.2%)                        90 (97.8%)                        92
   Experience at airport
                                     Departure only                   20 (12.7%)                        137 (87.3%)                       157
                                          Transit                       2 (0.9%)                        219 (99.1%)                       221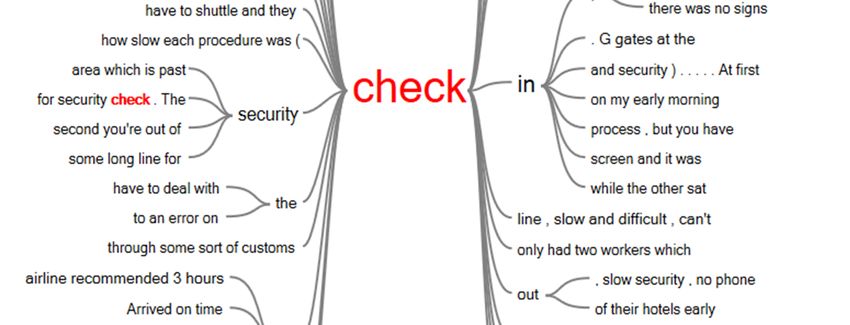
J. Risk Financial Manag. 2022, 15, 5                                                                                                 7 of 19

                                       Table 2. Cont.

                                                              Number of Reviews          Number of Reviews (SIN,
          Category                        Details                                                                            Total
                                                                  (HNL)                  HND, ICN, DOH, HKG)
                                        Rating 1–2                 42 (22.0%)                   149 (78.0%)                   191
                                        Rating 3–4                  20 (8.7%)                   209 (91.3%)                   229
    Overall satisfaction                Rating 5–6                   1 (0.4%)                   243 (99.6%)                   244
                                        Rating 7–8                   3 (1.6%)                   186 (98.4%)                   189
                                        Rating 9–10                  1 (0.2%)                   468 (99.8%)                   469
                                            Yes                     5 (0.7%)                    731 (99.3%)                   736
     Recommendation
                                            No                     67 (11.1%)                   538 (88.9%)                   605

                                       4. Results
                                       4.1. Themes and Concepts
                                              Using word frequency and co-occurrence counts, we identify themes and concepts,
                                        demonstrating how these words are related to each other. Figure 1 illustrates the themes
                                        and concepts in the passengers’ reviews for HIA. The overall satisfaction is rated based
                                        on a 1–10 rating scale. The concept maps display nine dominant themes: flight, airport,
                                        security, line, signage, departure, arrived, baggage, and check. The most important theme—
                                        flight—is related to the concepts of time, hour, terminal, gate, international, and shuttle.
                                       The second most import theme—airport—is related to the concepts of signage, worst, and
                                       place. Selecting the airport concept prompted Leximancer to automatically generate a list
                                        of related words and terms used by customers. The related word-like concepts included
                                        terms such as hours, signage, line, shuttle, and worst, indicating that customers frequently
                                        mentioned these words together with the word airport when they wrote comments on
J. Risk Financial Manag. 2022, 15, x FOR PEER REVIEW
                                                                                                                                  the
                                                                                                                              8 of 20
                                        airport services. The next important theme—security—is related to the concepts of better,
                                        staff, customs, gate, and long.

                                                   ConceptMaps
                                        Figure1.1.Concept
                                       Figure             Mapsand
                                                               andOverall
                                                                   OverallRatings
                                                                           Ratingsfor
                                                                                   forthe
                                                                                       theHonolulu
                                                                                          HonoluluInternational
                                                                                                   InternationalAirport.
                                                                                                                Airport.

                                             In terms our
                                            Turning    of overall satisfaction
                                                            attention          levels, the
                                                                       to the world’s   topbubble  containing
                                                                                             five airports      the rating
                                                                                                            (Figure         1 (not recom-
                                                                                                                      2), concept   maps
                                        mended)   is closely located between   the signage  and  security themes,  indicating   thatmost
                                       featured eight themes: airport, time, gate, hour, luggage, queue, clean, and duty-free. The   some
                                        passengers   had  unsatisfactory  experiences   with  signs and  security  at the  airport.
                                       important theme—airport—is related to the concepts of best, world, excellent, fast, and      These
                                       service. The next important theme—gate—is associated with transit, better, lounge, and
                                       area. The theme—hour—is related to long, line, and open. Regarding the overall satisfaction
                                       levels, the rating 1 bubble is located between the queue and hour themes, while the rating
                                       10 bubble is found among the concepts of clean, friendly, excellent, and efficient.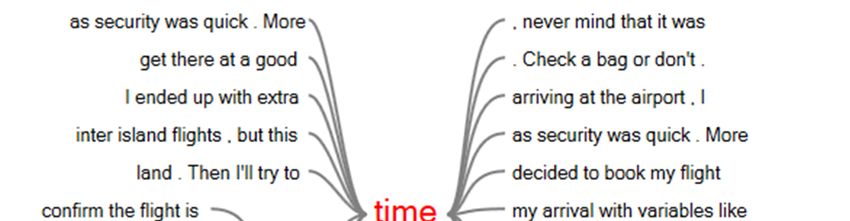
J. Risk Financial Manag. 2022, 15, 5                                                                                                    8 of 19

                                                results are consistent with Fodness and Murray’s (2007) findings showing that terminal
                                                signs are an important element of airport service quality. Rating 1 is also associated with
                                                other concepts such as line, bags, long, and check. Some negative comments are related to
                                                these concepts as follows:
                                                    “This is a horrible airport. It is disorganized and lacks signage. [..] Security is just
                                                    rude—my guy was quite thrilled when he found my oversized container of sun spray. I
                                                    won’t be back soon”. (July 2019, Business, United States)
                                                    “This airport was the worst part of our trip to Hawaii. [ . . . ] As others have noted,
                                                    indoor signage is poor. Amenities such as shopping, are limited. [ . . . ]. And no working
                                                    wifi. [ . . . ] I dreaded every minute at this airport”. (November 2017, Couple leisure,
                                                    United States)
                                                    On the contrary, the bubble containing the rating 9 (recommended) is positioned near
                                                    the flight theme and connected to the concepts of time, shuttle, hours, international, gate,
                                                    and area. These findings imply that on-time shuttle services help increase passengers’
                                                    satisfaction levels. For example, some satisfied passengers posted relevant comments as
                                                    follows:
                                                    “We arrived at Honolulu airport from [ . . . ] On arrival [ . . . ]. On leaving the airport
                                                    our prearranged shuttle was exactly where we were told it would be and we were on our
                                                    way in no time. On departure to NYC we once again got through the airport quickly and
                                                    easily. [ . . . ]. you will find your experience at Honolulu airport as pleasant as ours was”.
                                                    (April 2018, Couple leisure, Australia)
                                                  Turning our attention to the world’s top five airports (Figure 2), concept maps featured
                                             eight themes: airport, time, gate, hour, luggage, queue, clean, and duty-free. The most important
                                             theme—airport—is related to the concepts of best, world, excellent, fast, and service. The
                                             next important theme—gate—is associated with transit, better, lounge, and area. The theme—
                                             hour—is related to long, line, and open. Regarding the overall satisfaction levels, the rating 1
k Financial Manag. 2022, 15, x FOR PEER REVIEW                                                                               9 of 20
                                             bubble is located between the queue and hour themes, while the rating 10 bubble is found
                                             among the concepts of clean, friendly, excellent, and efficient.

                                             Figure 2. Concept Maps and Overall Ratings for the World’s Leading Airports.
                                Figure 2. Concept Maps and Overall Ratings for the World’s Leading Airports.
                                                 Some passengers’ comments include unfavorable sentiments:
                                4.2. Frequent Words and Word Trees
                                     The review data are further examined to identify the most frequently mentioned
                                words for two groups—satisfied and dissatisfied passengers—based on their intentions
                                to recommend the airport. Table 3 shows the word frequencies for satisfied and dissatis-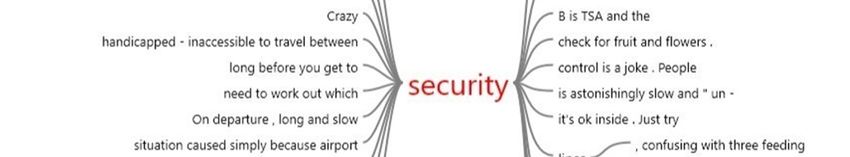
J. Risk Financial Manag. 2022, 15, 5                                                                                                      9 of 19

                                            “Seoul Incheon is the worst airport ever. [ . . . ] Long lines in all counters [..] Ridiculously
                                            long lines in baggage check and immigration [ . . . ] And, when you come back—surprise—
                                            another long waiting line for immigration check. From the moment you leave the plane
                                            till you finally get out of the airport it can be easily 2 hours [ . . . ] Good joke. ” (May
                                            2016, Solo leisure, South Korea)
                                            In contrast, some reviewers recognize favorable sentiments as follows:
                                            “Tokyo Haneda Airport was one of the most efficient and relaxing experiences in an
                                            airport in my life! Everything was fast and highly efficient. The airport design is really
                                            nice being open and easy to navigate. [ . . . ] definitely choose Haneda on my next trip to
                                            Tokyo!” (February 2017, Solo leisure, Australia)
                                            “The cleanliness of Incheon Airport is very clear and [ . . . ] The workers are also very
                                            friendly and have robots that match the names of high-tech airports. We will also look
                                            forward to the second passenger terminal, which will open in February.” (January 2018,
                                            Family leisure, South Korea)
                                            “Doha Hamad Airport is for me the best experience I could have in an airport. Clean,
                                            Comfortable, many seats, new with a dynamic and modern design. [ . . . ] Nothing else
                                            comparable. ” (January 2018, Business, Qatar)

                                       4.2. Frequent Words and Word Trees
                                           The review data are further examined to identify the most frequently mentioned
                                       words for two groups—satisfied and dissatisfied passengers—based on their intentions to
                                       recommend the airport. Table 3 shows the word frequencies for satisfied and dissatisfied
                                       passengers with HIA. It should be noted that words irrelevant to the analysis (e.g., the
                                       name of the airport) are excluded from the frequently occurring words.

                                       Table 3. Frequently Occurring Words for the Honolulu International Airport.

                Frequent Words for Satisfied Travelers                                 Frequent Words for Dissatisfied Travelers
                                                  Weighted                                                                 Weighted
      Word           Length      Count                                          Word         Length       Count
                                                Percentage (%)                                                          Percentage (%)
       time             4           6                1.65                      security          8          59                1.23
      flight            6           4                1.10                       check           5           46                0.96
    terminal            8           4                1.10                       flight          6           40                0.84
     airlines           8           3                0.82                         line           4          34                0.71
       area             4           3                0.82                        staff           5          33                0.69
     arrival            7           3                0.82                     terminal          8           32                0.67
    customs             7           3                0.82                        time           4           28                0.59
         far            3           3                0.82                        gate           4           26                0.54
      gates             5           3                0.82                   international       13          24                0.50
        like            4           3                0.82                        long           4           24                0.50

                                            The most frequent words associated with satisfied passengers (satisfiers) are time, flight,
                                       terminal, airlines, and area. Dissatisfied passengers use different keywords and phrases
                                       (dissatisfiers), such as security, check, flight, line, and staff. The most frequently occurring
                                       phrases for dissatisfied passengers are represented by security (59 counts) and check (46
                                       counts), as demonstrated in Table 3. It is found that security, terminal, flight, staff, and line
                                       are recognized as the performance factors that determine passengers’ experiences at HIA..
                                       As found in the following comments, the security check is frequently mentioned by HIA
                                       users:
                                            “Then we were ushered back outside into a pre-security line that didn’t move for 30
                                            minutes because they didn’t have enough staff available! By this point our flight was
                                            about to board!”. (September 2017, Couple leisure, United States)
                                            “The check in area at the inter-island terminal is a mess with 2 security check points both
                                            for mainland and international flights. So if your on a Hawaiian flight you must stay in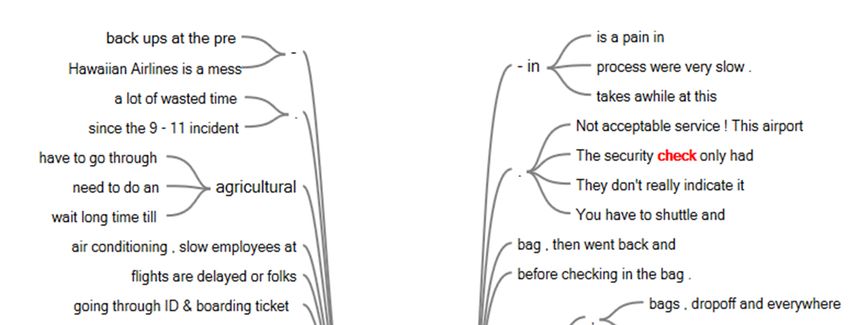
J. Risk Financial Manag. 2022, 15, 5 10 of 19
the queue which ends outside the door of the terminal at peak times with no signage. ”
(October 2007, Unidentified traveler)
A similar text analysis is carried out to identify frequently occurring words for the
world’s top five airports (Table 4). The most frequently occurring words for dissatisfied
passengers include terminal (266 counts), immigration (246 counts), security (245 counts),
staff (239 counts), long (225 counts), and time (225 counts). On the other hand, the frequent
occurring words for satisfied passengers include staff (336 counts), terminal (335 counts),
clean (331 counts), time (329 counts), immigration (289 counts), and free (284 counts). The
words terminal, immigration, staff, and time have been recognized as the performance factors
that significantly affect passengers’ satisfaction and dissatisfaction with the world’s leading
airports. A large number of comments include these performance factors:
Table 4. Frequently Occurring Words for the World’s Leading Airports.
Frequent Words for Satisfied Travelers Frequent Words for Dissatisfied Travelers
Weighted Weighted
Word Length Count Word Length Count
Percentage (%) Percentage (%)
staff 5 336 0.87 terminal 8 266 0.88
terminal 8 335 0.87 immigration 11 246 0.81
clean 5 331 0.86 security 8 245 0.81
time 4 329 0.85 staff 5 239 0.79
immigration 11 289 0.75 long 4 225 0.74
free 4 284 0.74 time 4 225 0.74
good 4 268 0.69 transit 7 216 0.71
security 8 266 0.69 flight 6 196 0.65
flight 6 260 0.67 check 5 173 0.57
food 4 240 0.62 passengers 10 164 0.54
“Super amazing airport. Staff on the ground are very courteous. Entertainment is
endless and for free!!! Best toilets, best restaurants, absolutely wow on everything!”
(September 2018, Solo leisure, United Kingdom)
“Horribly overpriced, the most expensive airport I have been at. Rude staff and limited
food options. Wifi hardly works and takes too long to log in. Really makes you not want
to fly Qatar air just to avoid a stop over here.” (August 2019, Couple leisure, Australia)
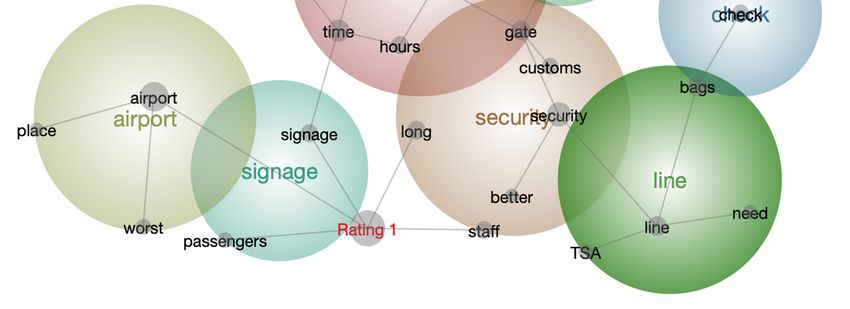
NVivo’s word tree displays a branching view of the results showing the various
contexts in which a frequently mentioned word occurs. For this study, we choose the most
frequently occurring words for satisfied and dissatisfied passengers. Figure 3 displays
word trees for time for satisfied HIA passengers and security for dissatisfied HIA passengers.
The word tree security, for example, is related to long and slow security check and no
signage at HIA.
Similarly, word trees display the words used most frequently by passengers at the
world’s leading airports (Figure 4). The word trees for staff and terminal demonstrate
recurring phrases that surround the frequently occurring words. Satisfied passengers
frequently mentioned friendly and helpful staff at the airports. The word terminal is
frequently used by both satisfied and dissatisfied passengers. The word tree for terminal
often shows relationships with an inconvenient terminal location and long, crowded transit
to the concourse terminal.J. Risk Financial Manag. 2022, 15, x FOR PEER REVIEW 11 of 20
J. Risk Financial Manag. 2022, 15, 5 11 of 19
Figure
Figure 3.
3. Word
Word Trees “Time” and
Trees “Time” and “Security”
“Security” for
for the
the Honolulu
Honolulu International
International Airport.
Airport.
Similarly, word trees
Note that Skytrax hasdisplay the words
a relatively used most
small sample sizefrequently
for HIA and bysmall
passengers
sampleatsizes
the
may skew
world’s data by
leading making
airports rare occurrences
(Figure 4). The word more
treescommon
for staff than
and they actually
terminal are. To
demonstrate
address this
recurring issue, that
phrases we collect
surroundadditional passengers’
the frequently reviews
occurring for HIA
words. from Yelp,
Satisfied posted
passengers
between 2006
frequently and 2019friendly
mentioned (2286 reviews, 273,614staff
and helpful words) andairports.
at the conductThe a content
word analysis
terminalforis
HIA (see Appendix A). In this paper, we use the overall rating scores of
frequently used by both satisfied and dissatisfied passengers. The word tree for terminal 1–2 and 4–5 to
identify
often dissatisfied
shows and satisfied
relationships with anpassengers, respectively.
inconvenient terminal The results
location including
and the Yelp
long, crowded
data show
transit that
to the frequent words associated with satisfied passengers are flight, time,
the most terminal.
concourse
terminal,
Noteandthatopen. On the
Skytrax hasother hand, the
a relatively most
small frequent
sample sizewords
for HIAassociated
and smallwith dissatisfied
sample sizes
passengers
may are check,
skew data terminal,
by making people,
rare and security.
occurrences more These findings
common thanarethey
generally
actuallyconsistent
are. To
with thethis
address results of the
issue, we content analysis using
collect additional the Skytrax
passengers’ data,for
reviews suggesting
HIA from that there
Yelp, is no
posted
significant small-sample bias derived from the analysis.
between 2006 and 2019 (2286 reviews, 273,614 words) and conduct a content analysis for
HIA (see Appendix A). In this paper, we use the overall rating scores of 1–2 and 4–5 to
identify dissatisfied and satisfied passengers, respectively. The results including the Yelp
data show that the most frequent words associated with satisfied passengers are flight,
time, terminal, and open. On the other hand, the most frequent words associated with
dissatisfied passengers are check, terminal, people, and security. These findings are generally
consistent with the results of the content analysis using the Skytrax data, suggesting that
there is no significant small-sample bias derived from the analysis.J. Risk
nancial Manag. Financial
2022, Manag.
15, x FOR 2022,
PEER 15, 5
REVIEW 12 of 20 12 of 19
Figure 4. WordFigure
Trees 4. Word Trees
“Staff” “Staff” and “Terminal”
and “Terminal” for theLeading
for the World’s World’s Leading Airports.
Airports.
4.3. Attribute Ratings
4.3. Attribute Ratings
To measure customer satisfaction levels, the mean scores of eight attribute ratings are
To measure customer satisfaction levels, the mean scores of eight attribute ratings are
compared. Table 5 provides the average scores of HIA and the world’s leading airports.
compared. Table 5 provides
These attributethe average
ratings scoreson
are based of aHIA
1–5 and thescale
rating world’s leadingexpressed
and directly airports. by passengers.
These attributeInratings
all cases, HIA exhibits lower mean scores compared to the scores of by
are based on a 1–5 rating scale and directly expressed the world’s most
passengers. In favorable
all cases, HIA exhibits
airports. lower for
T-values meanthescores
equal compared
means betweento the HIA
scores of the
and the global leading
world’s most favorable
airports airports. T-values
are statistically for the equal
significant at themeans between HIA
5% significance and
level. theHIA,
For global
airport staff (1.68)
leading airportsreceives
are statistically significant at the 5% significance level. For HIA, airport
the lowest rating; terminal sign (1.69) is the second-lowest; and queuing time (1.86)
staff (1.68) receives
is tiedthe
withlowest rating;
WIFI (1.86) forterminal sign (1.69) is the second-lowest; and
the third-lowest.
queuing time (1.86) is tied with WIFI (1.86) for the third-lowest.
Among the eight attributes, terminal cleanliness (2.21) and terminal seating (2.13)
achieve relatively higher satisfaction ratings. These outcomes indicate that possibleJ. Risk Financial Manag. 2022, 15, 5 13 of 19
Table 5. Attribute Ratings of the Honolulu International Airport and the World’s Leading Airports.
Airport Queuing Terminal Terminal Terminal Food and Airport Airport
WIFI
Code Time Cleanliness Seating Sign Beverage Shopping Staff
HNL 1.86 2.21 2.13 1.69 2.09 2.11 1.86 1.68
Average of the
3.66 4.50 4.00 4.17 3.68 3.99 4.05 3.70
five airports
SIN 4.13 4.72 4.31 4.48 4.20 4.50 4.03 3.99
HND 4.10 4.85 4.32 4.57 4.00 4.18 4.67 4.52
ICN 3.28 4.48 3.63 3.71 3.02 3.94 3.82 2.98
DOH 3.04 4.07 3.81 3.78 3.46 3.27 3.48 3.35
HKG 3.75 4.39 3.95 4.30 3.73 4.08 4.23 3.65
Notes: T-values for the equal means between HIA and the top 5 airports are 8.67 for queuing time, 17.59 for
terminal cleanliness; 9.43 for terminal seating; 12.92 for terminal sign; 6.78 for food and beverage; 10.14 for airport
shopping; 7.28 for WIFI; and 7.90 for airport staff.
Among the eight attributes, terminal cleanliness (2.21) and terminal seating (2.13)
achieve relatively higher satisfaction ratings. These outcomes indicate that possible im-
provements are required to increase overall airport service quality, primarily focusing on
airport signs, staff, queuing times, and WIFI. Among the attribute ratings of the world’s
leading airports, terminal cleanliness (4.50) receives the highest score, terminal sign (4.17)
is the second-highest, and WIFI (4.05) is the third-highest score in terms of airport customer
satisfaction. The largest average difference between HIA and the world’s leading airports
is in the area of terminal signs, with HIA’s score of 1.69 being 2.48 less than the average
airport score of 4.17. The second-largest difference in attributes occurs in terms of termi-
nal cleanliness. These two factors represent the largest areas for discrepancies (terminal
sign and terminal cleanliness) between HIA and the world’s leading airports, suggesting
possible areas for significant improvements at HIA.
4.4. Discussion of Results
Both Leximancer and NVivo identify keywords for satisfied and dissatisfied passen-
gers, and their results appear to be generally consistent. For HIA, Leximancer results show
that passengers are satisfied with the flight theme, which is connected to the concepts of
time, shuttle, hours, international, gate, and area. NVivo results also indicate that words most
frequently mentioned by passengers are time, flight, gate, international, and area. Among
dissatisfied passengers, both Leximancer and NVivo show the same key dissatisfying
comments related to signage, security, staff, gate, and long.
Signage is one of the key dissatisfaction factors for HIA. Unclear or missing airport
signs (e.g., baggage claim area and gate signs) may result in people getting lost, missing their
flights, and wasting their time at the airport. Previous studies suggested that airport signs
influence customer satisfaction (Fodness and Murray 2007; Moon et al. 2017; Pantouvakis
and Renzi 2016). For example, Moon et al. (2017) considered that layout accessibility, such
as clear airport signage, can reinforce customers’ satisfaction. Additionally, Pantouvakis
and Renzi (2016) discovered three essential dimensions for estimating airport service
quality: signage, servicescape, and service. Therefore, it is logical to suggest that signage at
HIA should be upgraded to prevent confusion and improve customer satisfaction.
For the world’s top five airports, Leximancer and NVivo display long, wait, and hours
as keywords for dissatisfied passengers. We also identify key enhancers of passenger
satisfaction. The common words clean, facilities, excellent, efficient, staff, and shopping are
shown as satisfaction factors in the results of both Leximancer and NVivo. This study
confirms that the cleanliness of the terminal environment is an important factor in increasing
passenger satisfaction. Elias Gonçalves and Caetano (2017) found that the cleanliness of
airport facilities is related to air passengers’ comfort dimension. Oh and Park (2014) also
indicated that facility cleanliness is associated with airport image as well as airport selection.
According to the Airports Council International, many airport users are sensitive to theJ. Risk Financial Manag. 2022, 15, 5 14 of 19
cleanliness of environments like bathroom facilities. Restroom cleanliness and maintenance
can be essential factors affecting passenger experiences and can encourage them to visit the
airport again.
While shopping is revealed as a key satisfier for the world’s leading airports, passengers
rarely mention their shopping experiences at HIA. Our results show that the users of the
world’s top five airports give high satisfaction ratings to duty-free shops. Consistent with
previous research (Bogicevic et al. 2013; Ghazi and Ammar 2018; Moon et al. 2017), duty-
free facilities and services can enhance international visitors’ satisfaction and attitudes
toward an airport. According to the Hawaii Tourism Authority (2019), Chinese, Korean,
and Japanese visitors spend notably higher amounts of money than the average shoppers
visiting from North America. In 2018, tourists from Japan, South Korea, and China spent
$66, $79, and $115 per person per day on shopping, respectively. Meanwhile, visitors
from Canada, the U.S. West, and the U.S. East spent $14, $17, and $19 per person per day,
respectively (Hawaii Tourism Authority 2019). Enhancing duty-free selections may increase
visitors’ satisfaction as well as the airport’s commercial revenues.
Our results also indicate that while staff is one of the satisfaction factors for the
world’s top five airports, it is a crucial dissatisfaction factor for HIA. Fodness and Murray
(2007) claimed that staff courtesy helps improve airport service quality. Elias Gonçalves
and Caetano (2017) also highlighted the importance of security staff in terms of overall
customer satisfaction. Well-trained staff could help to increase the airport’s efficiency and
productivity (Pantouvakis and Renzi 2016).
5. Conclusions
The contribution of this paper is to conduct a content analysis using the case of HIA in
comparison to the world’s leading airports. Since no previous study has explored online
reviews about HIA’s service quality, the findings of this paper help improve understandings
about air passengers’ perspectives using actual airport customer feedback. Qualitative
analysis identifies key drivers of satisfaction and dissatisfaction with airport services of the
world’s leading airports compared to HIA. The key findings and implications of the paper
are as follows.
First, examination of the attribute ratings indicates that the mean scores of the world’s
leading airports’ eight attribute ratings were significantly higher than HIA’s average scores.
Specifically, airport cleanliness and facilities (e.g., duty-free shops) are significant factors
that influence air passengers’ satisfaction at the five major airports and encourage customers
to write positive reviews. A content analysis revealed that terminal, immigration, staff, and
time are key performance factors that determine passengers’ experiences at the world’s
leading airports. Meanwhile, long lines, security processes, queuing times, and flight
delays are closely related to customer dissatisfaction at at HIA. Our results suggest that
security check, immigration process, signage, and staff courtesy should be improved at
HIA.
Second, we find that Leximancer and NVivo work in different ways. Leximancer de-
termines the number of themes and concepts and identifies their interrelationships without
the need for researcher input (Richards and Richards 1994). The easy-to-implement method
does not require manual coding and data management, helping to reduce researcher bias
and subjectivity (Sotiriadou et al. 2014). However, the first run of Leximancer did not
produce sufficient information to draw conclusions from this study. For example, Lexi-
mancer’s concept map automatically identified only two themes (signage and security)
and a few concepts related to dissatisfied HIA users. On the other hand, the results of
NVivo further revealed that time and security are also related to dissatisfaction. NVivo
required manual handling of data, but it was more suitable than Leximancer to help us
identify satisfiers, dissatisfiers, and performance factors. In this research, general concepts
were collected from Leximancer and more detailed concepts were obtained from NVivo to
improve accuracy and reliability. Our findings suggest that a combination of automaticJ. Risk Financial Manag. 2022, 15, 5 15 of 19
and manual analyses could provide more reliable data interpretations and an in-depth
understanding of satisfying and dissatisfying factors.
Finally, our results offer theoretical and practical contributions. Rahim (2016) and
Yunus et al. (2013) proposed a conceptual framework using the interrelationships between
service quality dimensions, passenger satisfaction, and customer loyalty. Their findings
supported that perceived service quality can affect both passenger satisfaction and loyalty.
Our results help improve understanding of satisfiers and dissatisfiers to enhance customer
satisfaction and loyalty. Additionally, our findings provide practical managerial impli-
cations to the Airports Division of Hawaii Department of Transportation. For example,
the content analysis results showed that signage, airport cleanliness, duty-free shopping,
and airport staff seem to be key areas in which HIA can make improvements to achieve
higher customer satisfaction. Based on actual passengers’ reviews, this paper presents
valuable information about the world’s leading airport service quality benchmark and
helps airport management teams develop appropriate airport operation strategies to meet
customers’ needs and wants. HIA is currently undergoing major renovations as part of the
statewide Hawaii Airports Modernization Program and the improvements will include a
new commuter terminal, the new Mauka concourse, a consolidated rental car facility, and
pedestrian bridge replacement. Our findings provide important managerial implications
for the airport management teams regarding airport service improvements and facility
renovations.
We acknowledge several limitations of this study. First, since this paper used online
reviews from Skytrax, we are unable to analyze passenger profile variables, such as age,
gender, and nationality. To treat this issue, future studies may use both online reviews
and traditional surveys to further analyze passenger satisfaction. Second, we collected
English language reviews only, which are unlikely to reflect international perspectives
from non-English speaking travelers. In the case of Hawaii tourism, it is crucial to include
non-English reviews to capture the diverse perceptions of visitors from Asian countries. For
example, future research could expand to include review comments in various languages to
analyze the nuances associated with the language and understand travelers’ perceptions by
country. Third, a limited number of reviews were available for HIA and the entire Skytrax
attribute rating system was not consistent from 2004 to 2019. Although Skytrax provided
specific attribute ratings to measure airport service qualities, some attribute ratings (e.g.,
terminal seating, WIFI, and airport staff) have been available only since 2015. To address
this issue, future studies should collect larger samples from various sources (e.g., Google,
Yelp, TripAdvisor, Twitter, Instagram, and other social media channels) and identify deeper
aspects of customer preferences and expectations as they change over time. Lastly, as
airports face the unprecedented challenges and risks of the COVID-19 pandemic, future
research should analyze the impact of the COVID-19 on air passengers’ perceptions toward
airport service regarding health and safety levels within the airport environment.
Author Contributions: Conceptualization, W.B. and J.C.; methodology, W.B. and J.C.; software, W.B.;
visualization, W.B.; formal analysis, W.B. and J.C.; investigation, J.C.; writing—original draft prep,
W.B. and J.C.; writing—review and editing, J.C. All authors have read and agreed to the published
version of the manuscript.
Funding: This research received no external funding.
Institutional Review Board Statement: Not applicable.
Informed Consent Statement: Not applicable.
Data Availability Statement: Publicly available datasets were analyzed in this study. This data can
be found here https://www.airlinequality.com (accessed on 15 October 2021).
Conflicts of Interest: The authors declare no conflict of interest.J. Risk Financial Manag. 2022, 15, 5 16 of 19
Appendix A. Frequently Occurring Words and Word Trees for HIA Including the Yelp
Data (2006–2019)
Table A1. Frequently Occurring Words for the Honolulu International Airport.
Frequent Words for Satisfied Travelers Frequent Words for Dissatisfied Travelers
Weighted Weighted
Word Length Count Word Length Count
Percentage (%) Percentage (%)
time 4 233 0.82 people 6 422 0.84
open 4 191 0.67 check 5 367 0.73
security 8 182 0.64 security 8 357 0.71
flight 6 175 0.61 time 4 325 0.65
nice 4 173 0.61 TSA 3 314 0.63
terminal 8 168 0.59 terminal 8 301 0.60
people 6 164 0.58 food 4 272 0.54
honolulu 8 163 0.57 long 4 242 0.48
easy J. Risk
4 Financial Manag.
161 2022, 15, x FOR PEER
0.56 REVIEW international 13 226 0.45 17 of 20
food 4 159 0.56 walk 4 215 0.43
Figure A1. Word Trees “Flight” and “Time” for Satisfied Travelers at HIA.
Figure A1. Word Trees “Flight” and “Time” for Satisfied Travelers at HIA.J. Risk Financial Manag. 2022, 15, x FOR PEER REVIEW 18 of 20
J. Risk Financial Manag. 2022, 15, 5 17 of 19
Figure A2. Word Trees “Check” and “Security” for the Dissatisfied Travelers at HIA.
References Figure A2. Word Trees “Check” and “Security” for the Dissatisfied Travelers at HIA.
Allen, Jaime, Maria Grazia Bellizzi, Laura Eboli, Carmen Forciniti, and Gabriella Mazzulla. 2020a. Latent factors on the assessment of
References
service quality in an Italian peripheral airport. Transportation Research Procedia 47: 91–98.
(Allen
Allen, et al. 2020a)
Jaime, MariaAllen,
GraziaJaime, Maria
Bellizzi, Grazia
Laura Bellizzi,
Eboli, Carmen Laura Eboli,and
Forciniti, Carmen Forciniti,
Gabriella and Gabriella
Mazzulla. Mazzulla.
2020b. Service 2020a.
quality in aLatent factors
mid-sized air
on the assessment
terminal: of service
A SEM-MIMIC qualityprobit
ordinal in an accounting
Italian peripheral airport.
for travel, Transportation Research
sociodemographic, Procediaheterogeneity.
and user-type 47: 91–98. Journal of Air
(AllenTransport
et al. 2020b) Allen, Jaime,
Management Maria Grazia Bellizzi, Laura Eboli, Carmen Forciniti, and Gabriella Mazzulla. 2020b. Service quality
84: 101780.
Allen,inJaime,
a mid-sized
Maria air terminal:
Grazia A SEM-MIMIC
Bellizzi, Laura Eboli,ordinal
Carmenprobit accounting
Forciniti, for travel,
and Gabriella sociodemographic,
Mazzulla. and user-type
2021. Identifying strategiesheterogeneity.
for improving
Journal
airportofservices:
Air Transport Management
Introduction of the84: 101780.to an Italian airport case study. Transportation Letters 13: 243–53.
Gap-IPA
(Allen
Aureli,etSelena.
al. 2021)2017.
Allen,AJaime, Maria Grazia
comparison Bellizzi,
of content Laurausage
analysis Eboli,and
Carmen
text Forciniti,
mining inandCSRGabriella Mazzulla.
corporate 2021.International
disclosure. Identifying strategies
Journal of
for improving
Digital airport
Accounting services:
Research 17: Introduction
1–32. of the Gap-IPA to an Italian airport case study. Transportation Letters 13: 243–53.
(Aureli
Azeem,2017) Aureli, Selena.
Muhammad, Naseer2017. A comparison
Ahmad of content
Salfi, and A. analysis
H. Dogar. usage and
2012. Usage text mining
of NVivo in CSR
software corporate disclosure.
for qualitative International
data analysis. Academic
Journal
Research of International
Digital Accounting Research 17: 1–32.
2: 262–66.You can also read