CONTRA COSTA COMMUNITY COLLEGE DISTRICT: TABLEAU VIEWER TRAINING - Contra Costa College
←
→
Page content transcription
If your browser does not render page correctly, please read the page content below
Prepared by: Heather Hutchings
                         ASR Analytics, LLC           E-mail: heather.hutchings@asranalytics.com
                                                      Web: http://www.asranalytics.com/

CONTRA COSTA COMMUNITY COLLEGE
DISTRICT: TABLEAU VIEWER
TRAINING
Analytics and Visualization Support

Version: 1.0
Last updated: August 6, 2020

© 2020 ASR Analytics, LLC for exclusive use by Contra Costa Community College District, Martinez,
CA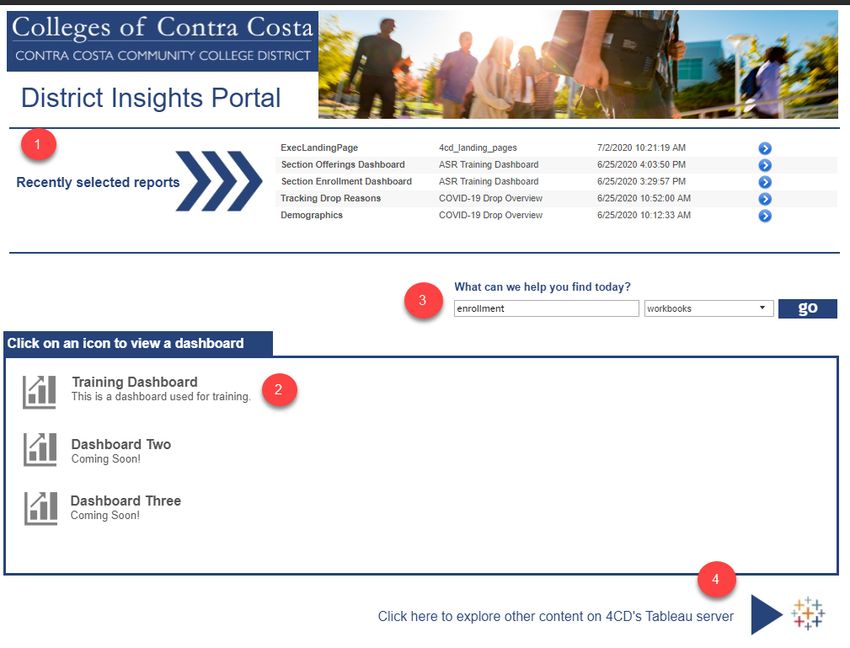
DOCUMENT CHANGE HISTORY

Document   Date             Description of Change                 Affected
Version                                                           Sections
1.0        June 25, 2020    Baseline – beginning of all content   All

2.0        August 6, 2020   Adjusted for Viewer Training          All

                                       ii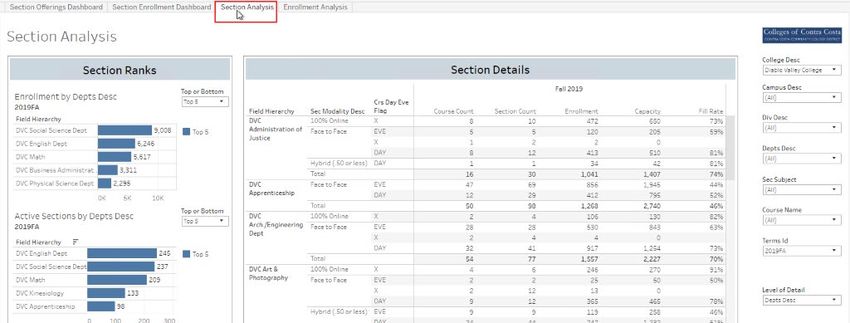
4CD Tableau Viewer Training                                                                      Prepared by ASR Analytics, LLC

CONTENTS
Document Change History ........................................................................................................... ii
Contents.................................................................................................................................... 1
Introduction ............................................................................................................................... 2
Understanding the Tableau System ............................................................................................... 2
     Introduction to Tableau Server ........................................................................................ 2
     System Architecture ...................................................................................................... 2
     Data Sources and Data Flow ........................................................................................... 3
     Tableau Security ........................................................................................................... 4
Navigating the Tableau Server Site ............................................................................................... 7
     Logging in to Tableau Server .......................................................................................... 7
     Navigating Content from the Home Page .......................................................................... 9
     Exploring Projects, Workbooks, and Views ...................................................................... 10
     Searching for Content .................................................................................................. 12
     Using Help ................................................................................................................. 14
Navigating Views ...................................................................................................................... 17
     Toolbars .................................................................................................................... 17
     Content with Multiple Tabs ........................................................................................... 18
     Sharing Content .......................................................................................................... 18
     Downloading Content................................................................................................... 19
Exploring Data with Charts and Tables......................................................................................... 21
     Filtering ..................................................................................................................... 21
     Sorting ...................................................................................................................... 23
     Tooltips ..................................................................................................................... 24
     Viewing Data .............................................................................................................. 25
     Legends..................................................................................................................... 26
     Panning and Zooming .................................................................................................. 26
     Parameters ................................................................................................................ 28
Additional References ................................................................................................................ 33
     Tableau Documentation ............................................................................................... 33
     Glossary .................................................................................................................... 33

                                                                      1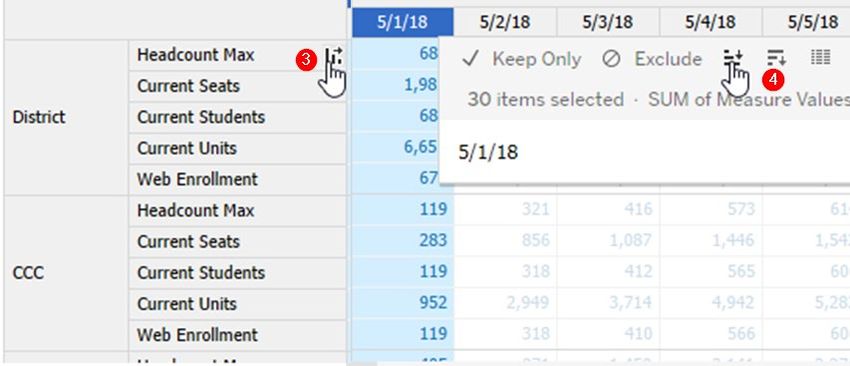
4CD Tableau Viewer Training                                          Prepared by ASR Analytics, LLC

INTRODUCTION
This document provides an overview of site navigation and interactive reporting activities in the
Tableau Server reporting tool that is part of the Contra Costa Community College District (4CD)
Business Intelligence (BI) implementation. The material is designed to accompany structured
training and as a reference when working independently. The goal of this guide is to provide
users with the basic skills to understand and navigate the Tableau site and interact with
developed content to answer business questions. This document does not cover report
development or modifications to the data sources.

UNDERSTANDING THE TABLEAU SYSTEM

    Introduction to Tableau Server
Tableau Server is a web application used to give enterprise access to Tableau workbooks and
data sources. Tableau Server provides the ability for users to view, interact, and edit Tableau
workbooks and data sources without the need to download and install the Tableau Desktop or
Tableau Viewer application. Furthermore, it provides this in a safe, secure, and scalable solution
that fosters data governance and collaboration between enterprise users. Tableau Server can be
installed on-premise at an institution (this is the version 4CD has), hosted on a cloud provider
like Amazon Web Services, or it is also available as a software-as-a-service (SAAS) application at
tableauonline.com.

    System Architecture
Tableau Server can be installed on a single server or across multiple servers (nodes). Tableau is
essentially a collection of services that provide the functionality necessary to deliver data
visualizations to end users whether they are using Tableau Desktop, Tableau Mobile, or a web
browser. The server provides connectivity to back-end data resources in real-time or as
scheduled extracts, integration to enterprise authentication services (Active Directory, SAML,
etc.), user/group permissions to resources (projects, workbooks, data sources), and
collaboration.

                                                 2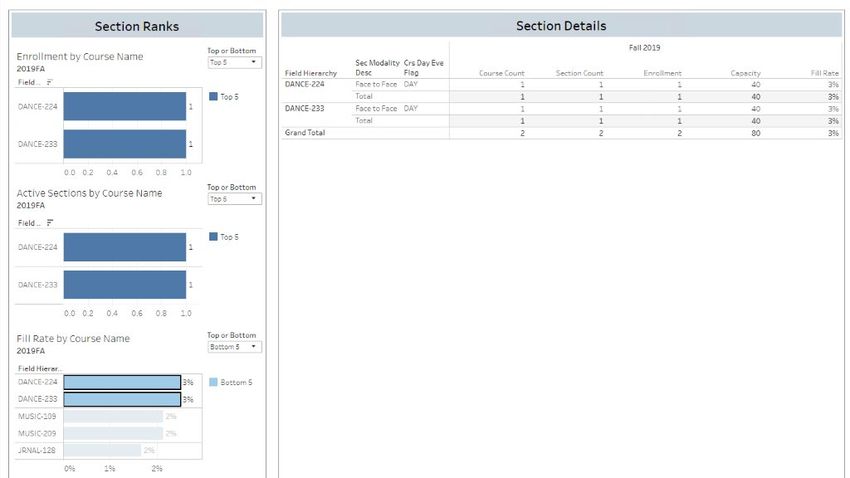
4CD Tableau Viewer Training                                           Prepared by ASR Analytics, LLC

                              Figure 1: Tableau Server Architecture

    Data Sources and Data Flow
Tableau Server accesses data from your data sources in two ways: live connection or Tableau
Data Extract (TDE). Depending on how the creator of the workbook sets up the data connection,
the data from your data source will flow in “real time” from the database every time you refresh
the workbook or the data will be extracted from the data source on a scheduled or manual
basis. Generally, for most analytical purposes, TDE is the preferred method. The extract can be
scheduled after hours to reduce load on the Tableau server as well as reducing the load on
enterprise databases.

                                                3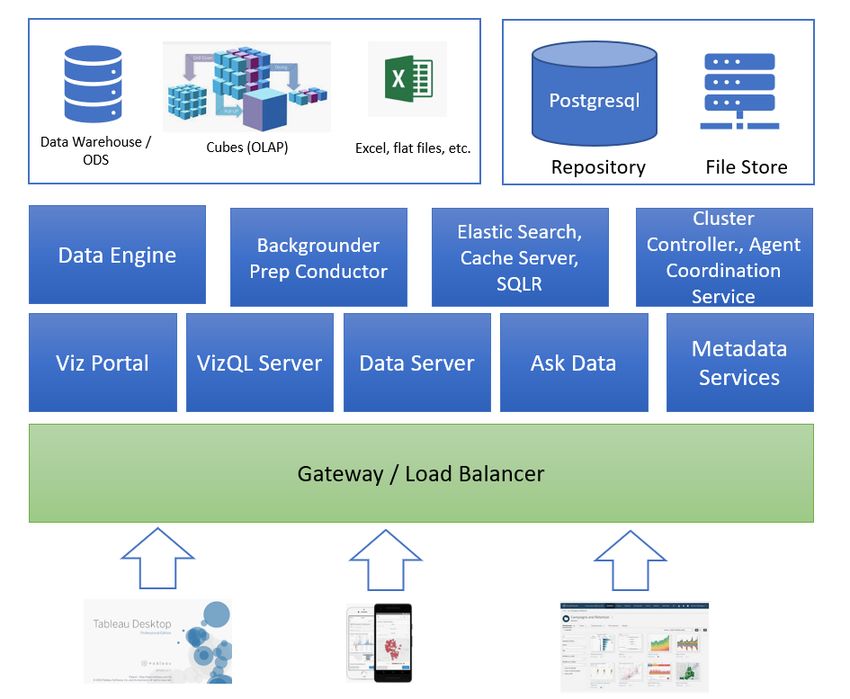
4CD Tableau Viewer Training                                      Prepared by ASR Analytics, LLC

   Tableau Security
On Tableau Server (and most applications), security is managed in two ways: authentication and
authorization. Authentication guarantees you are who you say you are by requiring a login name
and password. At 4CD this is managed by your Active Directory credentials, i.e. your Windows
username and password. Once you have authenticated on the system your Group determines
what you will be authorized to do on the system, e.g. what projects, workbooks, and data
sources you can view as well as how you can interact with them. On Tableau1, there are
currently the following groups with different capabilities. The workbook permissions assigned
to the groups are summarized below.

                                               4
4CD Tableau Viewer Training                                               Prepared by ASR Analytics, LLC

                  Group                                                   Notes
                                            Users can create, modify, and publish workbooks and
Tableau Research_Publishers                 data sources in all folders

Tableau Research_Power_Users                Users with Explorer interactive capability

Tableau_Research_Viewers                    Users with Viewer interactive capability
Tableau_Research_DSPS_Privacy_User Users will be added to these as an additional group to
                                            give them access to analyses that might have sensitive
Tableau_Research_FA_Privacy_User            info: DSPS, FERPA, HIPPA, etc

    Workbook Permissions
 Interactions                 Viewer                   Power_User                 Publisher
 View Vizzes                  X                        X                          X
 Use Filters                  X                        X                          X
 View Comments                X                        X                          X
 Add Comments                                          X                          X
 Download Image/PDF           X                        X                          X
 Download Summary             X                        X                          X
 Data
 Share Customized Views                                X                          X
 Download Full Data                                                               X
 Web Edit Vizzes

    Workbook Icons

    View allows a user to see the workbook or view. If a user hasn’t been granted the view
capability, the workbook won’t be visible to them.
    Filter allows a user to interact with filters in the view, including keep only and exclude
filters. Users lacking this capability won’t see filter controls in the view.

    View Comments allows a user to view the comments associated with the views in a
workbook.

    Download Image/PDF allows a user to download each view as a PNG, PDF, or PowerPoint.

    Download Summary Data allows a user to view the aggregated data in a view, or in the
marks they’ve selected, and download that data (as a CSV).

                                                   5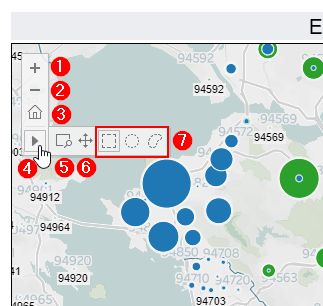
4CD Tableau Viewer Training                             Prepared by ASR Analytics, LLC

                    This Page Intentionally Left Blank for Notes

                                         6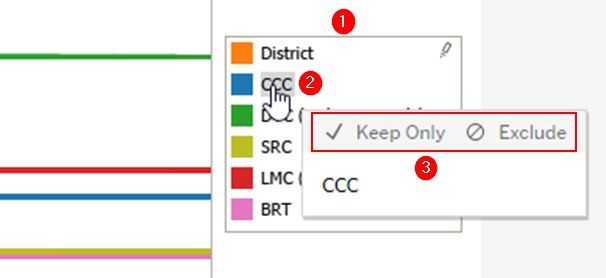
4CD Tableau Viewer Training Prepared by ASR Analytics, LLC
NAVIGATING THE TABLEAU SERVER SITE
Your Tableau Server site contains shared content that you can use to explore your data and
answer your business questions. In this section, you will learn how to access and navigate the
4CD Tableau Server site.
Logging in to Tableau Server
You will access content on your Tableau Server site using a web browser. Tableau Server
currently supports Google Chrome, Microsoft Edge and Internet Explorer 11, Mozilla Firefox,
and Apple Safari. 4CD’s Tableau Server site is only accessible from within the 4CD network.
From off campus, you must establish a VPN connection to the 4CD network prior to accessing
Tableau Server.
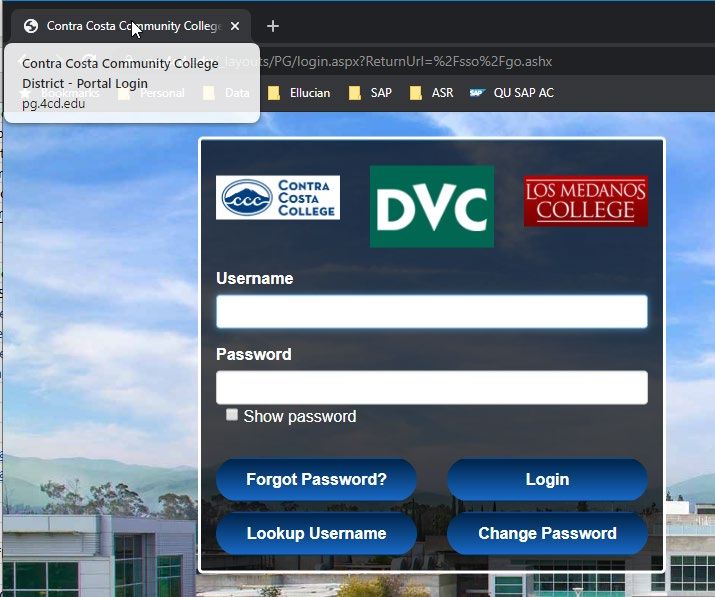
You can access the 4CD Tableau Server site via the Insite page by clicking on the tile named
"District reports" or by entering the URL https://tableau1.4cd.edu/ into your web browser. You
will be directed to the Contra Costa Community College District – Portal Login page. Enter your
4CD Username and Password and click “Login” to access the 4CD Tableau Server site in using
Single Sign On.
The Tableau Landing page provides a quick access to content relevant to your role. There will be
links to the Tableau Landing pages accessible from the district portal. In this guide, we will use a
sample the Training landing page to illustrate features of the landing pages.
7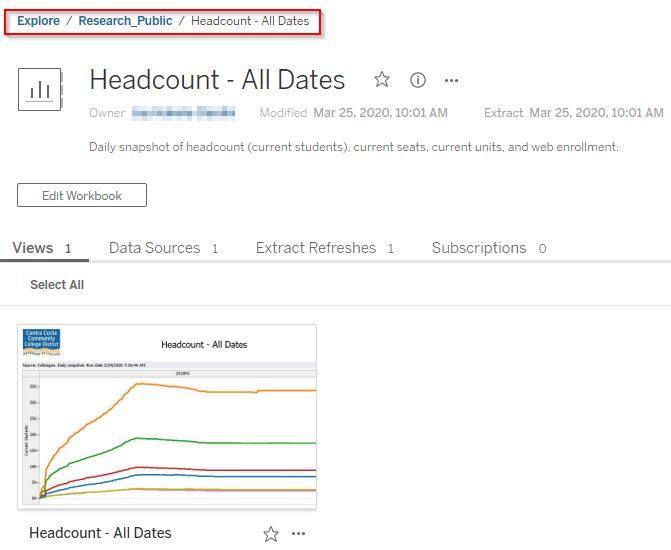
4CD Tableau Viewer Training                                       Prepared by ASR Analytics, LLC

 #     Features of the   Description
       Landing Page
 1     Recently          The top of the page shows recently accessed views. Clicking on a row
       Selected          in the table, opens the view in a new tab. This provides quick access
       Reports           to your frequently used items.
 2     Dashboards        The bottom of the page shows dashboards selected for your role. To
                         access a dashboard, you click the icon next to its name.

 3     Searching for     You can find a content in the Tableau Server using the search box.
       Content           The drop-down button gives you the option of limiting your search to
                         “workbooks”, “projects”, or “views”.
                         (For more information, see the Exploring Projects, Workbooks, and
                         Views section)
 4     Link to Tableau   Clicking this link will direct you to the Tableau Server home page.
       Server

                                               8
4CD Tableau Viewer Training Prepared by ASR Analytics, LLC
Navigating Content from the Home Page
When you first log in to your Tableau server environment, it will open on the default starting
page, known as the Home Page. The left-side navigation bar provides five ways to quickly
explore and access content (projects, workbooks, views, and data sources):
Option Description
Home Returns to your home page (either the system default or a page you’ve
selected)
Explore Provides file-structure access to top-level folders and all types of
content
Favorites Provides access to content you’ve marked as those you’ll frequently use
Recents Provides access to content you’ve recently viewed
Recommendations Provides access to recommended content, based on the most
frequently used content by your organization
If there is another page or a particular piece of content that is most important to you, you can
make that page or content your start page. With the page or content open, click on your user
profile avatar (initials or picture) in the upper right-hand corner, then choose “Make This My
Start Page.”
94CD Tableau Viewer Training Prepared by ASR Analytics, LLC
Exploring Projects, Workbooks, and Views
The Explore tab on the Home Page provides file-structure access to top-level folders and all
types of content: Projects, workbooks, and views. You can also view the data sources to which
you have access.
Exploring Elements Description
Projects Projects are like folders on your computer. They are used to organize
and manage permissions on the project and the content it contains,
such as workbooks and views.
Workbooks Workbooks may contain one or more tabs, analogous to an Excel
document.
Views Views can be any one of three types of visualized data created in
Tableau: a worksheet, a dashboard (two worksheets arranged
together), or a story (a sequence of worksheets and dashboards).
Content can be viewed on the Explore page either in grid mode (icons and images of content) or
list mode (content names only). Select the drop-down arrow to the left of the filter icon on the
right-hand side of your screen, below your user profile avatar, to toggle between grid mode and
list mode.
104CD Tableau Viewer Training Prepared by ASR Analytics, LLC
When exploring content, Tableau creates a string of breadcrumbs across the top of the screen.
This allows you to easily navigate back to a previous page.
114CD Tableau Viewer Training Prepared by ASR Analytics, LLC
Searching for Content
The quick search bar at the top of the Home Page searches all content across your site. You can
search for item names, metadata, owners, tags, captions, comments, and other attributes.
Quick search looks for your search criteria in titles, tags, desc, field names, and other text within
the content.
For example, a search for “accreditation” returns the following results:
Note that there are five views that meet this criterion, but only three are displayed. To see
additional matching results, click “See All”. This will take you to the more detailed Explore page
filtered by your search results, where you can sort or filter by additional criteria, or explore by
content type using the tabs.
124CD Tableau Viewer Training Prepared by ASR Analytics, LLC
Below the quick search bar, you will find a funnel icon. Selecting this icon opens more detailed
filtered search options. Note that a filtered search applies only to the items on the page you’re
currently viewing (such as views and project pages); it does not search across the entire site.
134CD Tableau Viewer Training Prepared by ASR Analytics, LLC
Using Help
The Help icon is always located at the top right of your screen near your profile icon. Clicking on
any of the options within the Help feature will take you to a new browser window. To search for
a specific topic, enter the text in the search box and press the Enter key. This will open a new
tab and navigate to the Support page of Tableau’s website. Note that depending on your
browser settings, you may need to allow pop-up windows from your Tableau site to allow the
Support page to open.
144CD Tableau Viewer Training Prepared by ASR Analytics, LLC
154CD Tableau Viewer Training Prepared by ASR Analytics, LLC
This Page Intentionally Left Blank for Notes
164CD Tableau Viewer Training Prepared by ASR Analytics, LLC
NAVIGATING VIEWS
Tableau views are visual representations of your data contained within worksheets and
dashboards. You can access Tableau views from a project workbook, by navigating to “All
Views” in the Explorer menu, or through the site search feature.
Toolbars
When navigating content, you will see two sets of toolbars at the top of the page: one on each
side. Below is an overview of both toolbars. Certain functions are called out specifically in this
section and with more detail.
The left-side toolbar includes the following functions:
Function Description
Undo Undoes the last action taken in the content
Redo Redoes the last action taken in the content
Revert Similar to undo, but undoes all actions taken in the content (e.g. resets all
filters)
Refresh Connects to the server to refresh data
Pause/Resume Allows you to make multiple changes to filters without waiting for the view
to refresh every time; click Resume to repaint the view once all desired
filtering is in place.
The right-side toolbar includes the following functions:
Function Description
View Create a custom view with specific filters
Alerts Create an email alert when the data in the view meets certain conditions
Share Share a view through via email or a link
Download Download the view in a variety of formats: image, data, crosstab, PDF,
PowerPoint, Tableau Workbook
Comments View comments on a view
Full Screen Makes the view full screen on your device; press ESC to exit full screen
mode
174CD Tableau Viewer Training Prepared by ASR Analytics, LLC
Content with Multiple Tabs
Some content may contain more than one view which are published on separate tabs. In this
case, you will navigate between the views by clicking on the tabs at the top of your screen.
Sharing Content
To share content, select the Share icon from the right-side toolbar.
The Share View dialog box will open. There are two ways to share content: Via email, or via a
link that can be copied and pasted into another application.
To share the content via email, enter the name(s) or username(s) of the user(s) with whom you
wish to share the content, and click to select.
Once you have entered all the names, enter an optional message and click Share. This will
generate an email to the selected users.
184CD Tableau Viewer Training Prepared by ASR Analytics, LLC
Alternately, you may choose to share the content using a link. Within the Share View dialog,
copy the auto-generated link to share via email or another communication method.
Downloading Content
To download content, click the Download icon on the right-side toolbar.
194CD Tableau Viewer Training Prepared by ASR Analytics, LLC
The Download dialog box will open. While all Tableau download options are listed, some may be
grayed out and unavailable depending on your permissions.
Option Description
Image Downloads an image of the view in .png format
Data Opens a new tab in the browser window and displays the view’s
data in summary and detail; downloadable .csv file
Crosstab Downloads the view, or a selected sheet from a dashboard, as a
.csv file
PDF Downloads a PDF of the view, or user-specified sheets from a
dashboard or workbook
PowerPoint Downloads user-specified sheets as static images in a new
PowerPoint document
204CD Tableau Viewer Training Prepared by ASR Analytics, LLC
EXPLORING DATA WITH CHARTS AND TABLES
Tableau views provide interactive access to your data. When you interact with Tableau views,
you can analyze and explore information without impacting the data source or modifying the
original view accessed by other users. In this section, you will learn how to interact with
elements of a view to configure your view to answer your business questions.
Filtering
Filters are controls that limit the data shown in a view. You can use filters focus the view on the
data related to your business questions. In the example below, selecting the “LMC” Location
from the drop-down filter limits the data displayed in the bar chart to the “PIT” and “BRT”
campuses.
Filter controls allow you to select values to include or exclude in a view. The types of filter
controls vary by the data type. Filter controls are created by the view author.
214CD Tableau Viewer Training Prepared by ASR Analytics, LLC
Filter Controls Filter Data Type Description
Type
Drop- Categorical Select a single value from a
down List list (1). Click the filter arrow
(2) to change the behavior to
include or exclude the
selected value (3).
Single- Categorical Click the radio button to
select List select a single value or all
values from a list (1). Click
the filter arrow to change
filter from single value to
multiple values (3) or to
include or exclude the
selected value (4).
Multi- Categorical Click a check box to a select a
select List single value or multiple
values from a list (1). Click
the filter arrow to change
filter from single value to
multiple values (3) or to
include or exclude the
selected value (4).
Slider Numeric Slide handles (1) or click the
arrow buttons (2) to select a
value. Sliders with multiple
handles allow you to select a
range.
Text box Categorical Type a value in the text box
or Numeric to include it in your filter.
224CD Tableau Viewer Training Prepared by ASR Analytics, LLC
In addition to filtering using controls, you can also filter by clicking on different elements of a
view. Marks are visual representations of data in a Tableau view. You can click on a mark or
table header to select data to include or exclude from a view.
In a table, click on the header or data cell (1) and choose the filter option to “Keep Only” (2) or
“Exclude” (3) the selected category or data point from a view. In a chart, click on a data mark or
categorical axis label (4) and choose the filter option to “Keep Only” (5) or “Exclude” (6) the
selected category or data point from a view.
Sorting
Tableau Web Views support multiple sorting options. In a chart, you can sort by clicking on the
axis header or category label. When sorting, the first click sorts in ascending order, a second
click sorts in descending order, and a third click clears the sort.
234CD Tableau Viewer Training Prepared by ASR Analytics, LLC
# Sort Type Description
1 Chart single- Activate by hovering over axis title. Click icon to change the sort
click sort direction or clear the sort based on the measure values. Categorical
data is sorted alphabetically.
2 Chart sort menu Activate by clicking on the axis. Click the ascending or descending
icon to select the sort direction for the measures. Categorical data
is sorted alphabetically.
3 Table single- Activate by hovering over a row or column header. Click icon to
click sort change the sort direction or clear the sort based on the measure
values. Categorical data is sorted alphabetically.
4 Table sort menu Activate by clicking on the axis. Click the ascending or descending
icon to select the sort direction for the measures in that row or
column. Categorical data is sorted alphabetically.
Tooltips
Tooltips include text or embedded visualizations that provide information about a datapoint.
Hovering over a mark in a visualization activates a tooltip (1). Clicking on a mark or hovering for
multiple seconds enables tooltip commands for filtering or viewing data (2).
244CD Tableau Viewer Training Prepared by ASR Analytics, LLC
Selecting mulitple marks in a view adds summary information to the tooltip (1). You can select
multiple marks by holding down the CTRL key while clicking on the marks. Clicking and dragging
over a visualization activates the default selection tool to select multiple marks in a chart (2) or
table (3). You can also select a group of marks to inspect by clicking on a categorical axis label, or
a table header.
Report authors can create filter actions to make a chart act as a filter for other views in a
dashboard. For example, clicking a state on a map could filter the other tables and charts to
only show data from that state.
Viewing Data
When you select marks on a view, you may see the View Data option in the tooltip commands.
Clicking on View Data opens a new window displaying the underlying data from the data source.
254CD Tableau Viewer Training Prepared by ASR Analytics, LLC
# View Data Description
Element
1 View data Click on the view data button from a tooltip in a chart or table to
button inspect selected data in a new window.
2 Summary tab The summary tab of the View Data window shows the summarized
rows of data for the selected data points.
3 Download link Click to download rows.
4 Summary table Summarized data for selected rows.
Legends
Chart legends show how the data categories or ranges of numeric values map to colors in a
chart. You can select categories in a legend to interact with the data.
# Legend Element Description
1 Legend Maps categorical data or numerical ranges to colors in a chart.
2 Selection Click on a category or use CTRL + click to select multiple categories.
3 Commands Use commands to filter data from the selected categories in the
chart.
4 Highlight Click the highlight button to highlight the selected categories and
dim the unselected categories in the chart.
Panning and Zooming
Maps and charts with a continuous axis have pan and zoom tools to let users focus on subsets of
a chart. Activate the pan and zoom toolbar by hovering over the top left side of the chart.
264CD Tableau Viewer Training Prepared by ASR Analytics, LLC
# Pan and Zoom Description
Element
1 Zoom In Click the + button to zoom in on the center of the chart. You can also
double-click the chart to zoom in on the point where you click.
2 Zoom Out Click the - button to zoom out on the chart. You can also hold down
Shift and double-click to zoom out.
3 Zoom Home Click the home button to reset the chart to the original pan and zoom
4 Additional Hover over the triangle to bring up additional actions
Actions
5 Zoom Area Click the Zoom Area button then drag the mouse to define a zoom
area on the chart. You can also activate the zoom area tool by holding
down Ctrl + Shift.
6 Pan Select the Pan tool and click and drag the mouse on the chart to pan.
You can also hold down Shift while dragging the mouse to Pan.
7 Mark Selection Additional mark selection tools for map areas.
Tools
274CD Tableau Viewer Training Prepared by ASR Analytics, LLC
Parameters
We have seen how filters let report viewers focus their analysis on a subset of the data available
in a view. In this section, we will learn how to use parameter controls to select what fields are
displayed in a views and effect how the selected data is displayed.
Parameter controls in Tableau increase the flexibility of a report by allowing report viewers to
choose which fields to display in a view. Parameter cards function like view filters, letting users
select available fields from a list.
# Parameter Description
Element
1 Dimension Select a dimension to display in the corresponding table row.
Parameters
2 Measure Select multiple measures to display in the corresponding table
Parameters columns.
On the view shown below, the Level of Detail control allows viewers to choose whether to
analyze section enrollment at the College, Division, Department, Subject or Course level.
Selecting a value from the Level of Detail control impacts the display of all visualizations on the
view. In the screenshots below, we can see how changing the Level of Detail selection from
“Depts Desc” to “Course Name” impacts the data shown in the view.
284CD Tableau Viewer Training Prepared by ASR Analytics, LLC
Parameter controls can also allow viewers to choose how the data is displayed in a view. On the
view shown below, the Top or Bottom parameter controls enable users to choose whether the
“Top 5”, “Bottom 5”, or “Others” values are displayed in the Section Ranks charts.
In the following example, we will use the filters and parameter controls in the Section Analysis
view to identify courses with low fill rates and plan actions that we can take to increase
enrollment in the upcoming term.
We will focus on courses offered at Diablo Valley College in Fall 2019. We use the College Desc
filter to select “Diablo Valley College” and the Terms Id filter to select “2019FA”. We use the
Level of Detail control to display the “Course Name” in the table and charts in the view.
294CD Tableau Viewer Training Prepared by ASR Analytics, LLC
The resulting view should resemble the screenshot below with course names displayed under
the Field Hierarchy header in the charts and table.
We can use the Fill Rate by Course Name chart to identify courses with low fill rates at DVC in
Fall 2019. We select “Bottom 5” from the Top or Bottom parameter control on the Fill Rate by
Course Name chart to identify these courses.
We see that multiple “DANCE” courses appear on our list. To focus these courses, we hold
down the CTRL key and click on the bar for each of these courses in the Fill Rate by Course
Name chart.
304CD Tableau Viewer Training Prepared by ASR Analytics, LLC
This action filters the other charts and the table in the Section Analysis view to show
information about the selected courses. The view should resemble the screenshot below.
We can use this focused information to target efforts to increase enrollment in the identified
courses with unfilled capacity for the upcoming semester.
314CD Tableau Viewer Training Prepared by ASR Analytics, LLC
This Page Intentionally Left Blank for Notes
324CD Tableau Viewer Training Prepared by ASR Analytics, LLC
ADDITIONAL REFERENCES
Tableau Documentation
Tableau Server Support Site –
https://www.tableau.com/support/server
Navigating your Tableau Site –
https://help.tableau.com/current/pro/desktop/en-us/navigating.htm
Role-based Getting Started Guide –
https://www.tableau.com/learn/get-started
Using Tableau on the Web –
https://help.tableau.com/current/pro/desktop/en-us/web_author_home.htm
Glossary
Term Definition
Dashboard A collection of views from multiple worksheet shown in a single
location where you can view a variety of data simultaneously.
Data source The underlying data that Tableau Reader is connected to. You can't
change the data source in Tableau Reader.
Filter A control on a view that limits the data shown in a view. For example,
a filter on Region that only includes the West.
Marks A visual representation of one or more rows in a data source. Mark
types can be bar, line, square, and so on.
Story A collection of sheets, arranged in a sequence, to convey information.
View The visual representation of your data in a worksheet or dashboard.
Workbook A collection of one or more worksheets and dashboards.
Worksheet A single view of data. Each worksheet can be connected to a single
data source.
Source: Tableau Reader Help. “Useful Tableau Terms”
https://help.tableau.com/current/reader/desktop/en-us/terms.htm
33You can also read