Copper opportunities in low carbon megatrends - Richard Wilson October 2017 - MMG
←
→
Page content transcription
If your browser does not render page correctly, please read the page content below
woodmac.com            1

Copper opportunities in low carbon megatrends
Richard Wilson
October 2017

Trusted commercial intelligence                               woodmac.com
Legal Statement

The purpose of the information in the following presentations is to guide
ICA programs and provide members with information to make independent
business decisions.

2

Antitrust Guidelines for Copper Industry
Trade Association Meetings

The following guidelines with respect to compliance with antitrust laws of the United States, Japan and European Community1 are intended
to govern the conduct of participants in copper industry trade association meetings, both at the meeting itself and in informal discussions
before or after the formal meeting.

Price: Competitors should not discuss future prices (including terms of sale) of their products. There is no blanket prohibition against the
mention of or reference to current or past prices but limits must be observed. Such references or mentions should occur only when
necessary in connection with the development of association programs. For example, reference to a particular price level in comparing the
cost of a copper product to a competing product is permitted. Whenever possible, such references should be discussed in advance with
legal counsel.

Competitive Information: Competitors should not discuss the market share of a particular copper producer or copper fabricator’s
products. Furthermore, nothing should be said at a meeting which could be interpreted as suggesting prearranged market shares for such
products or producer production levels. The overall market share of copper products may be discussed with regard to competition with non-
copper products and general market acceptance.

New Products: Competitors should not encourage or discourage the introduction of a new product by another competitor or reveal a
particular copper company’s plans to change the production rate of an existing product or to introduce a new product. No company should
disclose to another company whether it is in a position to make or market a new product. New products may be discussed in a technical
manner or from the standpoints of competition with non-copper products and general market acceptance.
In addition, proposed methods for and results of field and laboratory testing can be considered.

The Role of Legal Counsel: Legal counsel attends association meetings to advise association staff and other meeting attendees
regarding the antitrust laws and to see that none of the matters discussed or materials distributed raise even the appearance of antitrust
improprieties. During the course of a meeting, if counsel believes that the discussion is turning to a sensitive or inappropriate subject,
counsel will express that belief and request that the attendees return the discussion to a less sensitive area.

A paper entitled ‘Copper Industry Trade Associations and Antritrust Laws’ is available upon request. 10/92, 5/93, 10/10

       1. Other foreign competition laws apply to International Copper Association, Ltd. (ICA)’s activities worldwide.
3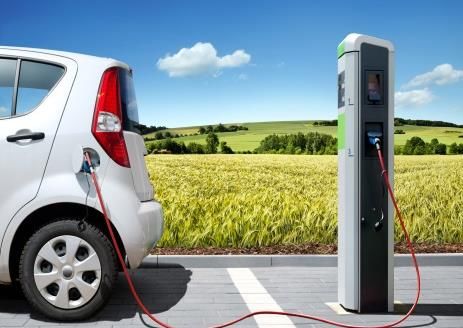
woodmac.com   4

This report analyses copper demand from three sectors linked
to decarbonisation trends
The report has been compiled by Wood Mackenzie and MetalsPlus

                  Renewable Energy
                  1. Solar
                  2. Wind

                  Electromobility
                  1. Electric vehicles
                  2. Charging Infrastructure

                  Energy Efficiency
                  1. Electric motors
                  2. Distribution Transformers
                  3. Air conditioners

 4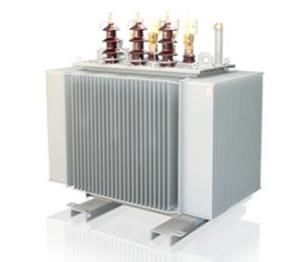
woodmac.com 5
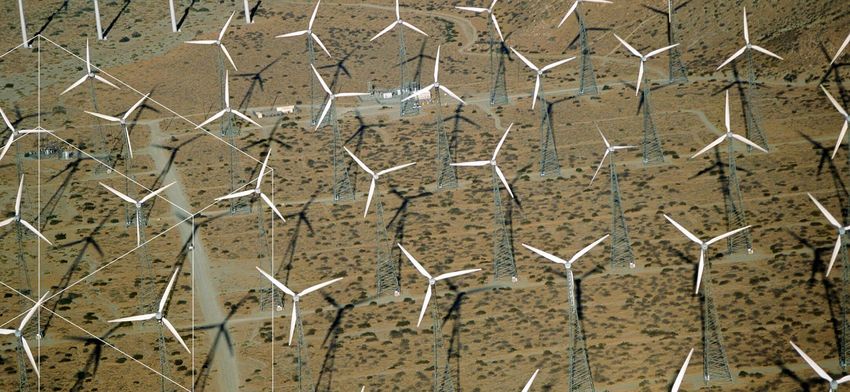
Wind power notably involves high levels of copper intensity of
use with the transformer and cabling
Ground mounted utility solar uses more copper roof mounted types, but has also
experienced more substitution from aluminium
Typical wind and solar copper intensities by installation type Offshore wind involves higher
copper intensity per MW owing
to the greater amount of
cabling required
15.3
Rooftop solar typically use
copper wiring for all DC wiring
Copper intensity (t Cu / MW)
» However, limited interconnection
means they use less copper
relative to utility ground mount
solar
Utility solar historically used up
5.35 to 6 t Cu per MW but
substitution from aluminium has
3.26
reduced the intensity over time
1.43 1.38
0.51 0.54 On average, wind is much
higher than traditional coal fired
Onshore Offshore Residential Commercial Utility Utility Utility
Wind Wind Solar Solar String Central Central power at 1 – 2 t Cu per MW
Inverter Inverter Inverter
Solar Solar Solar*
5 *Japan and South Korea Rooftop Ground Mount
Source: Wood Mackenziewoodmac.com 6
Global solar and wind power will each account for over 1 TW of
capacity by 2035
Asia, particularly China, drives rapid near and mid term growth due to falling
technology costs, policy incentives and development of transmission infrastructure
Solar power generation capacity by region Wind power generation capacity by region
1,200 35% 1,200 12%
30%
1,000 1,000 10%
25%
Generation Capacity (GW)
Generation Capacity (GW)
800 800 8%
YOY global % change
YOY global % change
20%
600 600 6%
15%
400 400 4%
10%
200 200 2%
5%
0 0% 0 0%
2015 2020 2025 2030 2035 2015 2020 2025 2030 2035
Asia Europe Asia Europe
North America ROW North America ROW
YOY global % change YOY global % change
6
Source: Wood Mackenziewoodmac.com 7
Rapid growth of wind power installations consume on average
359 ktpa of copper up to 2020 and 339 ktpa to 2025
The contributions from solar installations is more modest, owing to the lower
copper intensity, averaging ~50 ktpa through the Base Case forecast period
Forecast global copper demand from Forecast global copper demand from
installed solar power installed wind power
70 450
Gradual slowing of installed capacity and
copper demand due to maturing
2.5 400 renewables growth in our Base Case
60 3.2
scenario
59.2
2.8 350 163
50 2.6 66 142
2.6
49.3 300
Copper Demand (kt)
Coppe Demand (kt)
2.3 2.8
43.8 125
40 2.7 276
250
39.2
30 200
198
150 163
20
100 197
10
50
0 0
2016 2018 2020 2022 2024 2026 2028 2030 2032 2034 2016 2018 2020 2022 2024 2026 2028 2030 2032 2034
Utility Commercial Residential Onshore Offshore
7
Source: MAKE, Wood Mackenziewoodmac.com 8
Copper use in batteries increases copper intensity for electric
vehicles over internal combustion engine vehicles
The use of copper in electric motors is another notable contribution to increased
intensity of use
Copper intensity per vehicle (kg) by type
Heavy
Passenger Light Commercial Vehicles Commercial
Component Vehicles
ICE HEV PHEV BEV ICE HEV PHEV BEV ICE BEV Bus
Battery1 1 15 38 5 32 60 173
Rest of Vehicle 22 39 40 42 26 47 48 50 42 80
Total 22 40 55 80 26 52 80 110 42 253
Battery contributes significantly to higher copper intensity moving from ICE through to EV
Higher the copper usage within the rest of the vehicle are largely attributable to the electric motor
windings and the wiring harness/electrical distribution system (to accommodate higher voltages)
Aside from additional electrical components, the need for improved heat exchanger equipment to
deal with higher running temperatures also serves to boost copper consumption in xEV
There are some losses in engine hardware in BEV versus ICE/HEV/PHEV as no combusting engine
is incorporated, however these are small overall and comfortably outweighed by gains elsewhere
1The copper content of an average sized battery for the particular propulsion type has been used
8
Source: Wood Mackenzie, IDTechExwoodmac.com 9
WM expects EVs to account for 34% of global passenger
vehicle sales by 2035 with over 50% being hybrid types
The split of EV type is heavily dependent on region – a BEV is not currently viable
in regions with limited charging infrastructure
WM passenger EV forecast (base case), 2015 - 2035 Uptake of EVs is dependent
on:
35 40% » Regional policy & subsidies
» Battery, oil & electricity prices
30 35%
» Vehicle range and cost
30% » Infrastructure
25
» Vehicle stock saturation
Million vehicle sales
25%
20
China has had the latest surge
in electric vehicle sales with
20%
strong government subsidies
15
15% » Growth will continue to come from
Europe, US and developed Asian
10 markets
10%
Overall HEVs are the preferred
5 5% vehicle type as they do not
have the price tag of a
0 0% BEV/PHEV and do not require
2015 2020 2025 2030 2035 infrastructure, while offering the
consumer a more efficient,
HEV PHEV BEV % sales EV
environmentally friendly option
9
Source: Wood Mackenziewoodmac.com 10
Copper demand from passenger car EVs overtakes ICE vehicles
after 2033, accounting for over 1.9 million tonnes by 2035
The offset from fewer ICE sales through the forecast is minimised due to the much lower
copper intensity
Passenger car copper demand by vehicle type, 2017 - 2035
4000
CAGR 2016-35
3500
By 2029, BEV/PHEV copper demand
becomes larger than HEV demand
and by 2033, EVs in total will
3000 consume more copper than ICE 20%
vehicles
2500
13%
kt Cu
2000
12%
1500
1000
0.1%
500
0
2015 2020 2025 2030 2035
ICE HEV PHEV BEV
10
Source: Wood Mackenziewoodmac.com 11
The three energy efficiency sectors are major sources of
generated electricity loss
Reducing electricity loss in major consuming sectors is therefore a major area of
importance for carbon emission reductions
Breakdown of Electricity Generation, Consumption and
Losses
From generation to use
about 17% of electricity is
Losses lost, much of it from
17% network transformers
In use, motors and motor
driven systems account for
Electricity 45% of all electricity use,
Production Other Uses and a similar share of loss
Electricity
100% Air conditioners are a major
Consumption
83% application for electric
motors
Energy Losses
Electric Motors
45%
Energy Used
11
Source: MetalsPlus, IEA 2011woodmac.com 12
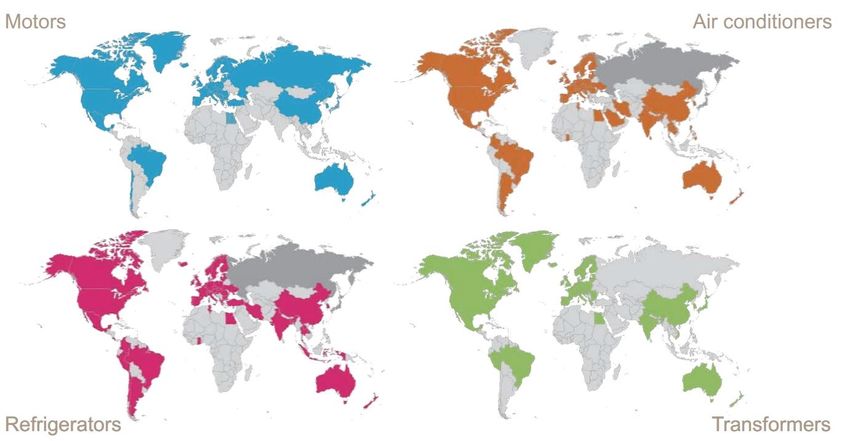
Energy efficiency is enforced through minimum energy performance
standards (MEPS) which are present in most major markets
MEPS are the key to product upgrades and most developed regions have them in
place, although developing markets are where the future gains will be made
MEP Presence by Country and Sector
Motors Air Conditioners
Refrigerators Mandatory Voluntary Transformers
12 No Policy or no data
Source: MetalsPluswoodmac.com 13
Copper intensity per unit of capacity increases for all sectors,
as efficiency gains require higher material intensity
Copper in energy efficiency sectors is mainly present as winding wire and additional tubing for
air conditioners, and more copper will be required per unit to achieve higher efficiency
Copper Copper
Sectors
forms Intensity
0.90
Distribution Transformers CAGR
2017-35
kg Cu / kVA
0.85
0.80 0.3%
0.75
0.70
2005 2010 2015 2020 2025 2030 2035
1.1
Electric motors
1.0
Kg Cu / kW
0.4%
0.9
0.8
0.7
0.6
2005 2010 2015 2020 2025 2030 2035
2.5
Air Conditioners
2.3
kg Cu/ kW
2.1 0.2%
1.9
1.7
1.5
2005 2010 2015 2020 2025 2030 2035
13 Copper Tube Winding Wire Other Forms
Source: MetalsPluswoodmac.com 14
Copper demand in energy efficiency sectors almost doubles
from 4.7 Mt in 2017 to reach 9.7 Mt by 2035
Increases in stock added and replacement, particularly in India and Other Asia, drives growth
at CAGR of 4.0%, 3.9% and 4.3% for transformers, motors and AC respectively
Copper demand by energy efficiency sector Global distribution of copper demand for
energy efficiency sectors
10,000 100%
Latin America
9,000 90%
8,000 80% North America
4,029
7,000 70%
Other Asia &
Oceania
6,000 60%
5,000 50% China
kt Cu
kt Cu
4,000 40%
1,823 3,859 India
3,000 30%
2,000 20% Other Europe &
1,843 Africa
1,000 1,842 10%
European Union
865
0 0%
2005
2007
2009
2011
2013
2015
2017
2019
2021
2023
2025
2027
2029
2031
2033
2035
2005 2010 2015 2020 2025 2030 2035
Distribution Transformers Electric Motors Air Conditioners
14
Source: MetalsPluswoodmac.com 15
The energy efficiency sector will contribute most to copper demand
for the megatrends analysed but electromobility grows faster
Energy efficiency contributes 80% of demand but the rapid growth in electric vehicle
production sees electromobility increases at 14.2% CAGR vs 4.1% for energy efficiency
Forecast copper demand by sector
CAGR 2016-35
14,000
12,840 4.9%
344 -0.9%
12,000
10,207 2,767 14%
10,000
390
Copper Demand (kt)
1,834
8,059
8,000
404
6,394
1,043
6,000 5,161 415
542 9,730 4.1%
223
406 7,983
4,000 6,611
5,436
4,531
2,000
0
2016 2017 2018 2019 2020 2021 2022 2023 2024 2025 2026 2027 2028 2029 2030 2031 2032 2033 2034 2035
Energy Efficiency Electromobility Renewables Total
15
Source: Wood Mackenzie, MetalsPluswoodmac.com 16 Disclaimer Confidential This report has been prepared for International Copper Association by Wood Mackenzie Limited. The report is intended solely for the benefit of International Copper Association and its contents and conclusions are confidential and may not be disclosed to any other persons or companies without Wood Mackenzie’s prior written permission. The information upon which this report is based has either been supplied to us by International Copper Association or comes from our own experience, knowledge and databases. The opinions expressed in this report are those of Wood Mackenzie. They have been arrived at following careful consideration and enquiry but we do not guarantee their fairness, completeness or accuracy. The opinions, as of this date, are subject to change. We do not accept any liability for your reliance upon them. 16
You can also read