Innovative grid-impacting technologies for pan-European system analyses: key GridTech results on Demand Response application
←
→
Page content transcription
If your browser does not render page correctly, please read the page content below
Innovative grid-impacting technologies for pan-European
        system analyses: key GridTech results on
              Demand Response application
                             Angelo L'Abbate
                                RSE SpA

   EC JRC Smart Mediterraneo workshop
   Bari, 24 June 2016
                                  The sole responsibility for the content of this presentation lies with the authors. It does not necessarily
                                  reflect the opinion of the European Union. Neither the EACI nor the European Commission are responsible
                                  for any use that may be made of the information contained therein.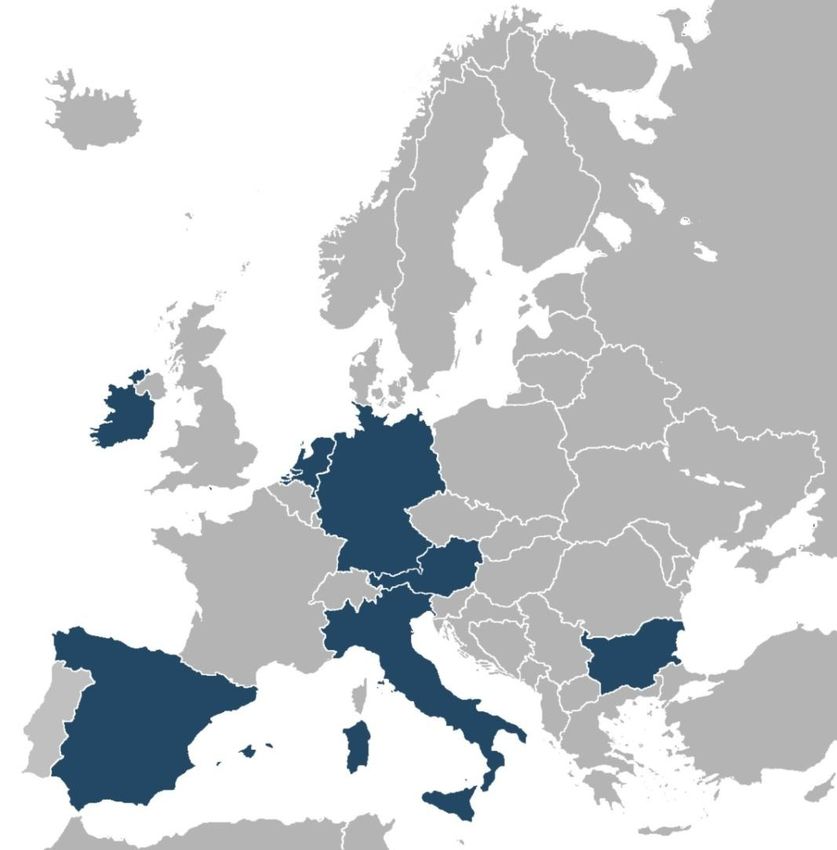
Outline
   GridTech project overview
   Technology focus and tool
   Demand Response (DR) inclusion
   Pan-European study: key assumptions and data
   Pan-European study: main scenario results with/without DR
   Discussion
About the                 GridTech is a project co-funded by the
project                   European Commission under the
                          Intelligent Energy Europe Programme.
Contract number:          Duration:
IEE/11/017 / SI2.616364   May 2012 - April 2015

                           Full title: Impact Assessment of
                           New Technologies to Foster RES-
                           Electricity Integration into the
                           European Transmission System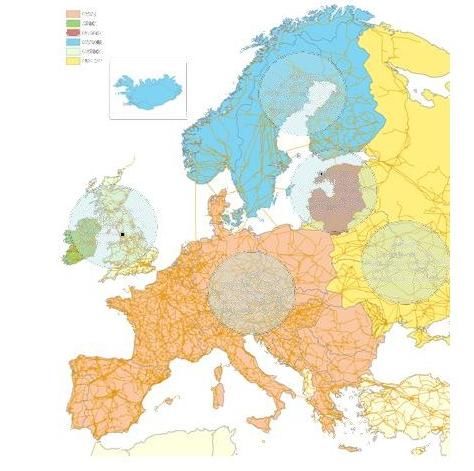
About the GridTech’s main goal:
project
Conduct a fully integrated
assessment of new grid-impacting
technologies and their
implementation into the European
electricity system.
This will allow comparing different
technological options, towards the
exploitation of the full potential of future
electricity production from renewable
energy sources (RES-E), with the lowest
possible total electricity system cost.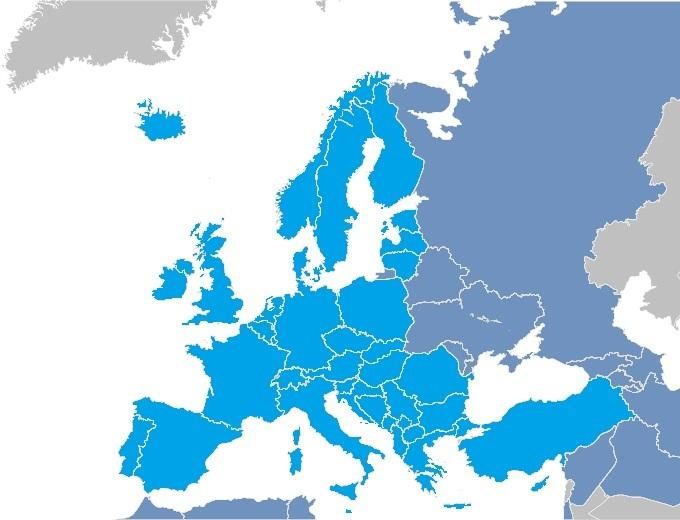
Project objectives
   Assess the non-technical barriers for transmission expansion and
   market compatible renewable electricity integration in Europe.
   Develop a robust cost-benefit analysis methodology on
   investments in most suitable new technologies fostering large-
   scale renewable electricity integration into the European
   transmission grid.
   Apply and verify the cost-benefit analysis methodology for
   investments in the transmission grid, on national and European
   level.
   Achieve a common understanding among key actors and target
   groups on best practise criteria for the implementation of new
   technologies fostering large-scale renewable electricity and
   storage integration.
   Deliver tailor-made recommendations and action plans, taking
   into account the legal, regulatory, and market framework.
Technology focus
The analysis focuses on
the most promising and
innovative technologies
that directly or
indirectly impact on the
transmission system.
Innovative grid-impacting technologies
        EGT                             EST                              TGT
• Onshore and offshore wind    • Pumped Hydro Energy     • HVDC - High Voltage Direct Current,
  energy                         Storage                   both VSC (Voltage Source Converter)-
• Large-scale solar            • Compressed Air Energy     based and CSC (Current Source
  technologies: Concentrated     Storage                   Converter)-based
  Solar Power (CSP) and                                  • FACTS - Flexible Alternating Current
  Photovoltaics (PV)              Bulk energy              Transmission System
                                  storage                • PST - Phase Shifting Transformers
   Electricity                                           • WAMS - Wide Area Monitoring System
                                  technologies
                                                         • DLR - Dynamic Line Rating-based OHLs
   generation
                                                         • HTLS - High Temperature Low Sag
   technologies,                                           Conductor-based OHLs
   with a focus                         EDT
   on variable                                             Transmission
   RES-E                           Demand                  technologies
                                   Response                directed at
                                   Technologies/           improvements in
                                   Measures and            network control and
                                   electric                flexible electricity
                                   vehicles                system operation
Within the 2020, 2030 and 2050 time horizons, the aim is to
2020         assess, among innovative technologies, i) which, ii) where,
and beyond   iii) when, and iv) to which extent they could effectively
             contribute to the further development of the European
             transmission system
                 … fostering the integration of an ever-
              increasing penetration of RES-E generation

                                                       2050
                                    2030
                                         … and boosting the creation of a
                     2020               pan-European electricity market,
                                       while maintaining competitive and
                                            sustainable electricity supply.
Pan-European system
Pan-European
system

                              Source: JRC (2010)
Target In addition to top-down modelling on EU30+ and taking
stock from it in a consistent data input-output flow,
countries GridTech focuses on 7 countries, representative of the
existing and future European electricity systems, studied
AUSTRIA
at 2020, 2030 and 2050 by detailed grid/zonal analyses.
BULGARIA
GERMANY
IRELAND
ITALY
NETHERLANDS
SPAINThe Pan-European study in the project
Transmission
expansion: RES integration:
non-technical market issues
barriers
Innovative
Cost-benefit
technologies
methodology
screening
Pan-European study Regional case studies
(top-down approach) (bottom-up approach)
Results and recommendationsPan-European The goals of the Pan-European study are threefold:
study aims -Setting the boundary conditions for the regional
and tool case studies in a tightly correlated manner at 2020,
2030, 2050
-Analyzing the 2020, 2030, 2050 Pan-European
scenarios including the effects of new technologies
-Applying a techno-economic assessment
methodology to the 2020, 2030 and 2050 Pan-
European scenarios including the effects of new
technologies fostering large-scale RES-E integration.
The Pan-European study is based on a top-down
approach by including the entire European system
(EU30+) in the model: the tool for conducting this
kind of scenarios analyses is MTSIM (Medium Term
SIMulator), developed by RSE over the years.MTSIM is a medium-term simulator of a generic day-ahead zonal
Main features market (DAM).
The model is devised to carry out system-wide energy evaluations
of MTSIM (i.e. fuel consumption) and emission evaluations (CO2 and other
pollutants).
MTSIM calculates a hourly clearing price all over the year, by
means of a DC Optimal Power Flow minimizing the energy price,
considering variable fuels costs, environmental costs and hourly bid-
up of each group (input of the model), taking account of constraints
related to: thermal power units limits, thermal must-run units
operation, thermal generation bounds, thermal power units
ramping, fuel consumption, CO2 emissions bounds, hydropower
plants limits, hydro reservoirs volume limits, total power balance,
inter-zonal power transit bounds, non-supplied energy (load
shedding), excess energy.
The transmission network among zones is modeled by an inter-zonal
equivalent system including both HVAC corridors (whose physical
constraints are represented through a PTDF matrix) and HVDC
interconnectors, operated independently of HVAC.
A key feature of MTSIM relates to the so-called planning modality
allowing to calculate the optimal dispatch whenever it is possible
to install additional interconnection capacity between the market
zones.MTSIM provides main outputs for techno-economic
assessments:
Main features Hourly zonal generation dispatch
of MTSIM Dispatch cost
Inter-zonal flow transits
Load shedding (EENS)
RES curtailment (EIE)
CO2 emissions
Hourly zonal marginal costs/prices
Fuel consumption
Revenues, margins and market quotas
MTSIM provides also the possibility of including in the
model innovative technologies, such as
HVDC
PST/FACTS
Storage
DSM/DRThe Pan-European study, based on EU30+ zonal model,
endogenously includes:
Pan-European • EU28 countries -> 30 systems (including 2 German
study zones + Northern Ireland)
• EEA countries -> 3 systems
• Western Balkans -> 5 systems
• Turkey
• additional 5-7 potential offshore islands (after 2030)
Pan-European study exogenously includes:
• Bordering systems of North Africa
• Bordering systems of Middle East
• Bordering systems of eastern edge (Russia, Belarus,
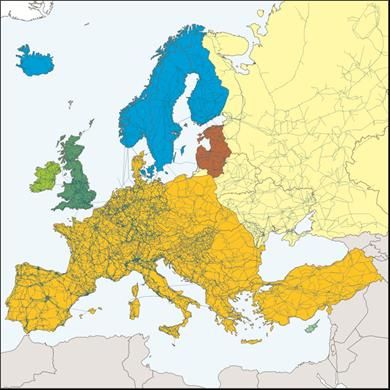
Ukraine, Moldova)Geographic perimeter of the Pan-European study Pan-European study
European transmissionsystem (2020, planned)
Pan-European
study
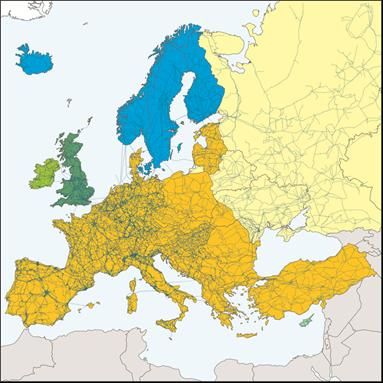
Source: JRC-IET (based on ENTSO-E and PLATTS data)European transmissionsystem (2030, preliminary)
Pan-European
study
Source: JRC-IET (based on ENTSO-E and PLATTS data)Pan-European zonal model (2020, planned) Pan-European study
Pan-European zonal model (2030, updated)
Pan-European
study
Pan-European zonal model (2050, updated)
Pan-European
study
Pan-European
study: baseline
scenarios (S0)
Pan-European
study: baseline
                      EU30+              2020 (GW)      2030 (GW)   2050 (GW)
scenarios (S0)
                      Nuclear              126.9          108.6       102.1

                     Hard coal             105.5          76.5*       53.0*

                      Lignite               65.6          56.6        19.8*

                        Gas                245.1         311.2*      349.9*

                   Oil / oil shale          20.4          16.6         0

                  Other non RES             57.3          53.0        50.8

                    Total Hydro            260.7          297.0       335.1

                  Wind (onshore)           179.9          276.8       380.8

                  Wind (offshore)           37.9          96.9        154.3

                       Solar               126.7          243.2       416.8

                   RES Biomass              38.8          69.6        113.7

                    Other RES               2.5            8.5        26.9

                                     *: including CCS
2020 2020 2030 2030 2050 2050
Country/
Load demand Load Load demand Load Load demand Load
zone
(TWh) shifting (TWh) shifting (TWh) shifting
AL 10.424 1.0% 15.431 5.0% 25.28 7.0%
AT 73.67 3.5% 91.81 6.4% 90.70 10.1%
BA 14.96 3.0% 17.95 3.0% 20.10 5.0%
Pan-European BE
BG
CH
95.40
41.75
69.17
3.1%
0.6%
1.0%
104.80
40.50
78.60
5.8%
2.3%
3.0%
115.40
35.52
85.90
9.2%
3.6%
6.0%
study scenarios % RES-E/load:
CY
CZ
DE1
8.055
69.41
483.49
0.7%
0.7%
2.8%
8.958
82.09
546.10
2.9%
2.6%
5.2%
10.41
104.90
563.69
4.6%
4.1%
8.2%
• 39% (2020)
DE2 78.71 2.8% 88.90 5.2% 91.76 8.2%
DK 36.36 3.5% 44.82 6.4% 49.01 10.1%
EE 9.67 1.7% 13.19 3.9% 13.76 6.1%
• 49-50% (2030) ES
FI
292.17
98.30
10.1%
10.1%
364.00
104.40
10.1%
10.1%
419.16
106.26
16.1%
16.1%
• 62-64% (2050)
FR 489.16 10.1% 516.30 10.1% 573.20 16.1%
GB 326.45 10.1% 357.02 10.1% 461.70 16.1%
GR 64.57 3.1% 87.02 5.8% 88.43 9.2%
HR 21.20 0.7% 24.00 2.6% 30.50 4.1%
HU 49.20 2.0% 51.60 3.9% 67.80 6.1%
IE 30.42 10.1% 33.34 10.1% 34.06 16.1%
IS 18.899 4.2% 24.65 4.2% 33.20 6.0%
IT 339.00 10.1% 460.45 10.1% 481.01 16.1%
LT 12.43 0.7% 17.80 2.3% 19.14 3.6%
LU 6.78 0.6% 7.33 2.3% 8.50 3.6%
LV 8.80 0.6% 9.20 2.3% 10.02 3.6%
ME 5.00 0.1% 5.97 0.1% 7.40 2.0%
MK 12.29 0.1% 14.53 0.1% 14.20 2.0%
MT 2.542 10.1% 2.81 10.1% 3.43 16.1%
NI 9.76 10.1% 12.55 10.1% 12.66 16.1%
NL 124.36 10.1% 163.01 10.1% 110.40 16.1%
NO 133.88 10.1% 148.00 10.1% 149.91 16.1%
PL 177.00 6.4% 215.00 6.4% 238.10 10.1%
PT 50.09 10.1% 63.36 10.1% 70.10 16.1%
RO 68.14 2.8% 83.56 5.2% 88.10 8.2%
RS 44.16 3.0% 48.69 5.0% 50.05 7.0%
SE 151.09 3.8% 157.95 7.0% 160.42 11.2%
SI 14.64 2.6% 19.99 5.8% 19.70 9.2%
SK 30.60 0.6% 35.63 2.3% 44.20 3.6%
TR 412.40 3.0% 610.45 10.0% 825.00 15.0%
Total 3984.40 4771.76 5333.072020 S0 (base) case: merit order
Pan-European      Main outcomes:
study results
(2020 S0, base)      Load shedding is null
                     RES curtailment (2.67 TWh) is mostly
                     concentrated in IE, IS and is very limited
                     in DE1, ES, NI, PT
                     Zonal costs are changing depending on
                     countries, RES penetration, energy mix:
                     the highest average zonal marginal costs
                     concern CY (above 70 €/MWh), MT and
                     TR (about 60 €/MWh)
                     HVDC corridors are rather fully utilised
2020 S0 (base) results: RES curtailment
Pan-European     Main outcomes:
study results       Load shedding is null
(2020 S3, EDT)
                    Dispatch cost reduction by DR amounts
                    to 425 M€ with respect to 2020 S0
                    RES curtailment is reduced by 127 GWh
                    due to DR (load shifting) effect
                    Zonal costs are changing depending on
                    countries, RES penetration, energy mix
                    Impact of DR on CO2 emission variation is
                    very limited (slight increase)
2020 S3 (EDT) results: RES curtailment
2030 S0 (base) case: merit order
Pan-European      Main (updated) outcomes:
study results
(2030 S0, base)      Load shedding is null
                     RES curtailment (9.4 TWh) is rather higher
                     than in 2020 S0: it mostly concerns CY, DE1,
                     DK, ES, GB, IE, IS (while it is very limited in MT,
                     NI, NL, PT)
                     Zonal marginal costs are higher than in 2020
                     HVDC corridors are rather fully utilised
                     The system needs first reinforcements across
                     British islands, in Balkan, Iberian and Baltic
                     regions, on north-south Central Europe axis
                     and around isolated zones
2030 S0 (base) results: RES curtailment
Pan-European     Main outcomes:
study results       Load shedding is null
(2030 S3, EDT)
                    EDT (DR) brings higher benefits than in
                    2020 in terms of RES curtailment
                    reduction (1458 GWh) and dispatch cost
                    decrease (1.42 b€) over S0
                    Zonal costs are changing depending on
                    countries, RES penetration, energy mix
                    Impact of EDT (DR) on CO2 emissions
                    variation is negative (CO2 emissions
                    increase: 8.4 MtCO2 by DR)
2030 S3 (EDT) results: RES curtailment
2050 S0 (base) case: merit order
Pan-European      Main (updated) outcomes:
study results        Load shedding is rather high and concerns TR
(2050-1 S0, base)    (depending on TR demand projection)
                       RES curtailment is higher than in 2030 (15.6
                       TWh) and concerns several zones: AT, BE, BG,
                       CY, DE1, DE2, DK, EE, ES, FI, FR, GB, GR, IE, IS,
                       IT, LT, LV, MT, NI, NL, PL, PT, SE (highest values
                       are in DE1, GB, ES, NL, PT, DK, IE, NI, EE, FR)
                       Zonal marginal costs can reach very high
                       levels due to load sheddings (at a VOLL of
                       5000 €/MWh)
                       HVDC corridors are rather fully utilised
                       The system needs several reinforcements
2050-1 S0 (base) results: RES curtailment
Pan-European      Main (updated) outcomes:
study results        Load shedding is rather high and concerns TR
(2050-2 S0, base)    (depending on TR demand projection)
                       RES curtailment is 14.2 TWh (rather higher
                       than in 2030 but lower than in 2050-1) and
                       concerns several zones: AT, BE, CH, CY, DE1,
                       DE2, DK, EE, ES, FI, FR, GB, GR, IE, IS, IT, LT, LU,
                       LV, MT, NI, NL, PL, PT, SE (highest values are in
                       GB, DE1, ES, IE, DK, NL, NI, PT, FR, EE)
                       Zonal marginal costs can reach very high
                       levels due to load sheddings (at a VOLL of
                       5000 €/MWh)
                       HVDC corridors are rather fully utilised
                       The system needs several reinforcements
2050-2 S0 (base) results: RES curtailment
Pan-European     Main outcomes:
study results       Load shedding reduction amounts to 4.3 TWh
(2050-1 S3, EDT)    by DR in 2050-1
                     EDT (DR) brings in 2050-1 much higher
                     benefits than in 2020 and 2030 in terms of
                     RES curtailment reduction (6.7 TWh by DR)
                     and dispatch cost decrease (24.5 b€ by DR)
                     over 2050-1 S0
                     Zonal costs can be high depending on RES
                     penetration, energy mix, load sheddings
                     Impact of EDT (DR) on CO2 emissions
                     reduction is positive in 2050-1 (6.7 MtCO2 by
                     DR)
Pan-European Main outcomes:
study results Load shedding reduction amounts to 4.6 TWh
(2050-2 S3, EDT) (by DR) in 2050-2
EDT (DR) brings in 2050-2 much higher
benefits than in 2020 and 2030 in terms of
RES curtailment reduction (6.4 TWh by DR)
and dispatch cost decrease (25.6 b€ by DR)
over 2050-2 S0
Zonal costs can be high depending on RES
penetration, energy mix, load sheddings
Impact of EDT (DR) on CO2 emissions
reduction is positive in 2050-2 (6.6 MtCO2 by
DR)2050-1 S3 (EDT) results: RES curtailment
2020-2030-2050 EDT (DR) -> S3

    EDT (DR)                                   2050-1          2050-2
                    2020          2030
    benefits                                 (with PTDF)   (without PTDF)
 Total dispatch
                   425 M€       1423 M€      24530 M€        25636 M€
 cost reduction
RES curtailment
                  127 GWh      1458 GWh      6719 GWh        6445 GWh
   reduction
 CO2 emissions
                  -869 ktCO2   -8384 ktCO2   6694 ktCO2     6563 ktCO2
   reduction
 Load shedding
                   0 GWh         0 GWh       4327 GWh        4555 GWh
   reduction
Main conclusions on DR Large investments and system extensions are needed to foster huge RES-E integration: there are several technological options available today and in the future, while there are not solutions good for all cases/regions (much depends on local situation) From a society perspective, the use of DR might be very effective -> price signals to industry and customers are needed Storage vs. DR -> DR may be favoured over storage as it is generally cheaper and more efficient Flexibility, controllability and socio-environmental impact will be more and more crucial aspects to be further investigated Further analyses towards a full quantitative techno-economic DR assessment, taking into account DR benefits and costs, as well as comparisons with other innovative technologies, have been carried out within GridTech
Dr. A. L'Abbate, RSE SpA
angelo.labbate@rse-web.it

  IEE GridTech project
http://www.gridtech.eu

             Thanks!
You can also read