Cornhusker Economics The Impact of COVID-19 and Economic Policies on Nebraska Farm Real Estate in 2021 - University ...
←
→
Page content transcription
If your browser does not render page correctly, please read the page content below
March 10, 2021
agecon.unl.edu/cornhuskereconomics
Cornhusker Economics
The Impact of COVID-19 and Economic Policies on
Nebraska Farm Real Estate in 2021
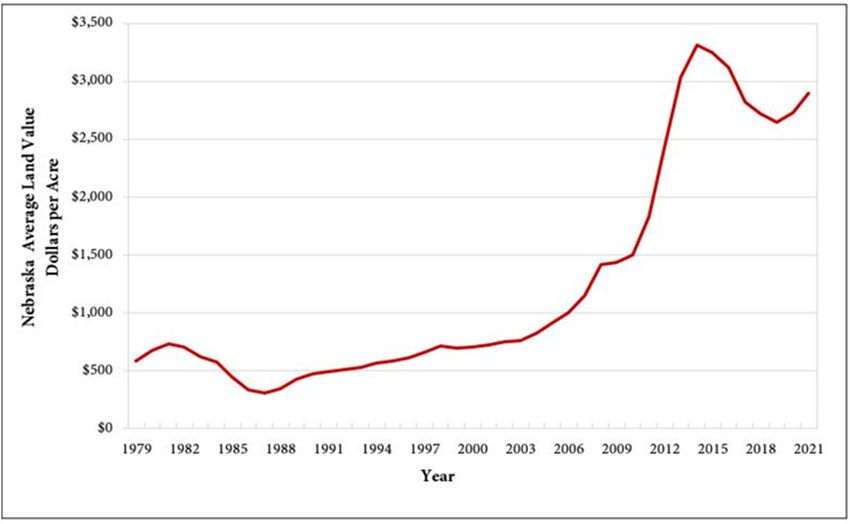
The market value of agricultural land in Nebraska in- the state. These forces substantially impacted farm and
creased by 6% over the prior year to an average of $2,895 ranch finances across Nebraska. Operators faced an
per acre according to the 2021 Nebraska Farm Real Estate exceptional amount of risk and uncertainty when nav-
Market Survey (Figure 1 and Table 1). This improvement igating production decisions during the height of the
marks the second consecutive gain in the market value of COVID-19 pandemic. Lower interest rates and disas-
agricultural land in Nebraska since 2019. ter assistance payments provided stability to an indus-
The University of Nebraska-Lincoln, Department of Agri- try facing an unpreceded economic shutdown and
cultural Economics annually surveys land industry profes- disruptions of supply chains.
sionals across Nebraska including appraisers, farm and Monetary policies put forward by the United States
ranch managers, agricultural bankers, and related industry Federal Reserve lowered short and long-term interest
professionals. Results from the survey are divided by land rates to combat the economic slowdown caused by
class and summarized by the eight Agricultural Statistic COVID-19. These policies substantially lowered the
Districts of Nebraska (Figure 2). cost of financing short and long-term debt held by
Land industry professionals responding to the annual sur- farmers and ranchers across Nebraska. In the fourth
vey attributed the rise in Nebraska farm real estate values quarter of 2020, interest rates for operating and agri-
to current interest rate levels, crop prices, and COVID-19 cultural real estate loans were about 1% lower at agri-
disaster assistance payments provided to operators across cultural banks across the United States compared to
Figure 1. Historic Nebraska Average Land Value 1979-2021a
Source: a UNL Nebraska Farm Real Estate Market Surveys, 1979 - 2021.
It is the policy of the University of Nebraska–Lincoln not to discriminate based upon age, race,
ethnicity, color, national origin, gender-identity, sex, pregnancy, disability, sexual orientation,
genetic information, veteran’s status, marital status, religion or political affiliation.
Figure 2. Nebraska Agricultural Statistics Districts

the prior year (KC FED 2021). Agricultural producers and          in the Northeast. Dryland cropland with irrigation po-
investors purchasing additional land capitalized historically     tential showed a renewed interest with higher com-
low interest rates into real estate values.                       modity prices. This land class indicated a 6% increase
Crop and livestock prices suffered from economic events           for the state with Northwest, Northeast, and Central
surrounding COVID-19 which led to financial uncertainty           regions reporting climbing values ranging from 8% to
and volatility for many operations across the state. The          11%. Other regions, such as the East, Southwest or
USDA-Farm Service Agency implemented two rounds of                South reported lower gains between 3% and 5%, be-
the Coronavirus Food Assistance Program (CFAP) to pro-            cause of limited ability to develop additional irrigated
vide pandemic disaster assistance to operations across the        acres due to water availability.
country. This assistance provided needed stability and finan-     Improvements in grazing land and hayland market val-
cial liquidity to many operators. In addition to the CFAP,        ues range around 3% to 5%. Tillable grazing land led
Nebraska operators collected approximately $2.4 billion in        the three land classes at 5% as higher crop prices incen-
different forms of disaster assistance and safety net pay-        tivized the development of additional acres. The North,
ments during 2020 (Lubben 2021).                                  East, and South Districts, on average, increased in
A late rally in crop prices allowed for many of these com-        range from 5% to 8% for the three regions. Developing
modities to recover from pandemic lows and position un-           grazing land acres into cropland requires management
sold grain at higher values. Historically low interest rates to   practices adhering to conservation practices for a pro-
finance long-term debt coupled with disaster assistance and       ducer to maintain eligibility in USDA farm programs
a late rally in crop prices created a competitive position for    or purchasing of federally subsidized crop insurance.
agricultural land purchases. Activity in land markets across      Cropland and grazing land rental rates in 2021 were
Nebraska responded to these economic forces in 2020 ac-           higher than those reported in the prior year (Table 2).
cording to survey participants.                                   Reports by survey participants indicate higher crop
Cropland reported the highest market value increase for           prices are a driving force for the higher rates. Crop in-
Nebraska in 2020 when compared to the prior year (Table           surance planting time price guarantees for major com-
1). The estimated market value of center pivot irrigated          modities planted in Nebraska are higher over the prior
cropland rose by about 8% across the state with the North-        year allowing for a larger revenue guarantee. A notable
east, Central, and Southeast Districts reporting the highest      spread exists between old crop and new crop prices.
increases ranging between 9% and 10%. Gravity irrigated           Old crop prices currently carry a premium over new
cropland also followed similar trends with the Northeast          crop prices. Exports and weather patterns across the
and Southeast Districts reporting increases around 8% and         grain belt in 2021 might be major driving forces for
other regions improving in value from about 4% to 6%.             new crop prices.

Dryland cropland without irrigation potential reported an         Overall, dryland and irrigated cropland reported steady
increase of about 7% with the North, Central, and Southeast       to higher cash rent averages across the state. These rates
Districts leading the state averaging between 8% and 11%.         averaged about 5% to 7% higher over the 2020 growing
Other regions range from a low 2% in the Southwest to 5%          season. Rates reported as part of the survey assume the
Table 1. Average Reported Value of Nebraska Farmland for Different Land Types and Sub-State Regions,
         February 1, 2021a Preliminary

 Type of Land                                                                Agricultural Statistics District

                       Northwest     North           Northeast             Central            East           Southwest               South             Southeast      Statec

                                   - - - - - - - - - - - - - - - - - - - - - - - - - - - - - Dollars Per Acre - - - - - - - - - - - - - - - - - - - - - - - - - - -
Dryland Cropland (No Irrigation Potential)
  $/acre                  635         1,650              5,765              3,080             6,485              1,440               3,070               4,935        3,380
 % change              4             9                      5                  8                6                   2                   3                  11          7
Dryland Cropland (Irrigation Potential)
 $/acre               760         2,115                  6,200              3,575             6,835              1,620               3,605               5,655        4,390
  % change                 9             7                  8                 11                4                   5                   3                  6           6
Grazing Land (Tillable)
 $/acre                540            1,180              3,245              1,965             3,380               950                1,990               2,985        1,300
  % change                 4             7                  1                  5                6                   3                   8                  2           5
Grazing Land (Nontillable)
 $/acre               445              690               2,120              1,490             2,575               755                1,465               2,135        860
  % change                 3             5                  4                  2                7                   1                   6                  4           4
Hayland
 $/acre                   775         1,200              3,230              1,980             3,070              1,310               1,925               2,800        1,695
  % change                 8             3                  5                  3                4                   2                   1                  3           3
Gravity Irrigated Cropland
 $/acre               2,245           3,790              7,325              6,180             8,110              3,775               5,735               6,710        6,095
  % change                 5             4                  9                  6                5                   6                   5                  8           6
Center Pivot Irrigated Croplandb
 $/acre                2,560          4,285              8,145              7,270             9,545              4,170               6,885               8,380        6,610
  % change                 4             8                 10                  9                7                   5                   6                  9           8
All Land Average   c

 $/acre                   715         1,160              5,755              3,395             6,850              1,600               3,805               5,230        2,895
  % change                 4             6                  7                  7                5                   3                   5                  8           6
Source: UNL Nebraska Farm Real Estate Market Surveys, 2020 and 2021.
       a

        b Value of pivot not included in per acre value.                                      to the survey participants include the degree of service
        c Weighted averages.                                                                  provided by the landlord or tenant as part of the lease.
                                                                                              Considerations for these leases include the party re-
landlord owns the entire system and may be adjusted                                           sponsible for upkeep on fencing, control of noxious
down when a tenant provides a component to the system.                                        weeds or brush, and payment of utility bills (used for
Concern expressed by survey participants for the renting                                      livestock well). As shown in Table 2, the high third
of crop and grazing land relates to the potential of exten-                                   quality for cash rent may reflect cases where the land-
sive drought across Nebraska during the 2021 growing                                          lord provides some of these services.
season. Flexible lease provisions based on crop yield, price,
or revenue may be an advisable feature to consider when                                       Land values and rental rates presented in this report
accounting for production uncertainty this upcoming year.                                     are averages of survey participants’ responses by Dis-
                                                                                              trict. Actual land values and rental rates may vary de-
Pasture and cow-calf pair rental rates generally trended up                                   pending upon the quality of the parcel and local market
across Nebraska in 2021 ranging from about 3% to 7%                                           for an area. Also, preliminary land values and rental
higher (Table 2). Drought conditions in western Nebraska                                      rates are subject to change as additional surveys are
pose a higher degree of risk in grazing land leases when the                                  returned. Final results from the survey will be pub-
cattle must be removed early due to a lack of forages. Con-                                   lished in June 2021 and available online via the Nebras-
sideration may need to be given in developing an equitable                                    ka Farm Real Estate website: http://agecon.unl.edu/
early withdrawal provision subject to drought conditions.                                     realestate
Factors impacting the cow-calf pair rental rates according
Table 2. Reported Cash Rental Rates for Various Types of Nebraska Farmland and Pasture: 2021 Aver-
ages, Percent Change from 2020 and Quality Ranges by Agricultural Statistics Districta
Preliminary
Agricultural Statistics District
Type of Land Northwest North Northeast Central East Southwest South Southeast
- - - - - - - - - - - - - - - - - - - - - - - - - - - - - Dollars Per Acre - - - - - - - - - - - - - - - - - - - - - - - - - - -
Dryland Cropland
Average ........................ 30 57 225 98 220 42 83 170
% Change ..................... 9 11 5 8 7 12 10 3
High Third Quality ....... 42 91 265 120 240 54 120 195
Low Third Quality ......... 24 47 180 89 175 35 57 135
Gravity Irrigated Cropland
Average ........................ 115 180 280 215 260 170 210 240
% Change ..................... 10 6 8 5 2 6 2 4
High Third Quality ....... 145 210 320 255 280 195 245 285
Low Third Quality ......... 90 140 225 175 230 140 175 210
Center Pivot Irrigated Croplandb
Average ........................ 150 210 305 235 290 195 235 280
% Change ..................... 7 8 5 2 4 5 7 6
High Third Quality ....... 170 255 340 270 330 235 265 310
Low Third Quality ......... 130 180 260 190 250 165 190 240
Pasture
Average ........................ 13 28 66 37 53 22 38 49
% Change ..................... 10 8 4 6 3 7 4 1
High Third Quality ....... 18 41 84 45 72 30 46 59
Low Third Quality ......... 11 15 49 32 40 16 28 40
- - - - - - - - - - - - - - - - - - - - - - - - - - - - - Dollars Per Month - - - - - - - - - - - - - - - - - - - - - - - - - - -
Cow-Calf Pair Monthly Rates c
Average ........................ 39.60 63.15 60.75 58.85 55.20 51.60 49.80 54.80
% Change ..................... 4 3 5 8 7 3 6 9
High Third Quality ....... 48.75 69.45 72.10 68.70 65.90 59.70 61.20 64.20
Low Third Quality ......... 32.90 52.70 47.85 42.15 45.50 43.35 39.80 38.45
Source: a Reporters’ estimated cash rental rates (both averages and ranges) from the UNL Nebraska Farm Real Estate Market Survey,
2020 and 2021.
b Cash rents on center pivot land assumes landowners own total irrigation system.
c A cow-calf pair is typically considered to be 1.25 to 1.30 animal units (animal unit being 1,000 lb. animal) for a five month grazing season.
However, this can vary depending on weight of cow and age of calf.
Please address questions regarding preliminary estimates
from the 2021 Nebraska Farm Real Estate Survey to Jim
Jansen at (402) 261-7572 or jjansen4@unl.edu.
References
Lubben, B. (2021, March) Nebraska Farm Financial In-
come Forecasts (Forthcoming), retrieved from the Jim Jansen, (402) 261-7572
UNL Bureau of Business Research: https:// Agricultural Economist
business.unl.edu/research/bureau-of-business- University of Nebraska-Lincoln
research/bureau-reports/ jjansen4@unl.edu
Kansas City FED (2021, March 3). Ag Bankers Signal
Strong Recovery in Farm Finances, retrieved Jeff Stokes, (402) 472-2127
March. 5, 2021, from the Kansas City FED: https:// Hanson-Clegg-Allen Endowed Chair
www.kansascityfed.org/agriculture/agfinance- Agricultural Banking and Finance
updates/Ag-bankers-signal-strong-recovery-in- University of Nebraska-Lincoln
farm-finances/ jeffrey.stokes@unl.eduYou can also read