CORPORATE PRESENTATION - CREDICORP CONFERENCE CORPORATE PRESENTATION - Colbún
←
→
Page content transcription
If your browser does not render page correctly, please read the page content below
CREDICORP CONFERENCE

CORPORATE
PRESENTATION
SEPT 2019

              CORPORATE
             PRESENTATION

                            LARRAIN VIAL ANDEAN
                              & SOUTHERN CONE
                                 CONFERENCE
                               SEPTEMBER 2020
Company & industry overview
  Leading position in Chile & Peru

        THE COMPANY
                     Installed Capacity                                Market Share1                  Ownership
                     3,811 MW                                             14% /        6%
                                                                                                      49.96% Matte Group
                           3,244 MW /                567     MW
                                                                                                      9.58% Angelini Group

                      Power Plants                                     Transmission Lines             19.55% Pension Funds
                      25                                               ~942     km                    20.91% Others
                           24 /          1

        KEY FINANCIALS                                                                                International Ratings
                     EBITDA LTM                                         Total Assets
                     US$689 mm                                          US$6.7 bn
                          Gx US$550 mm / Tx US$71 mm                                        S&P
                                                                                                        BBB         BBB-
                                                                                                        Stable        Stable
                          US$68 mm
                                                                                            Fitch      BBB+         BBB-
                     Net Debt / EBITDA                                   Cash                           Stable        Stable

                     1.4 x                                               US$854 mm                      Baa2        Ba1
                                                                                            Moody’s
                                                                                                         Stable       Stable

Note: All figures as of Jun20
1 In terms of generation in the SEN in Chile and in the SEIN in Peru
                                                                                                                               2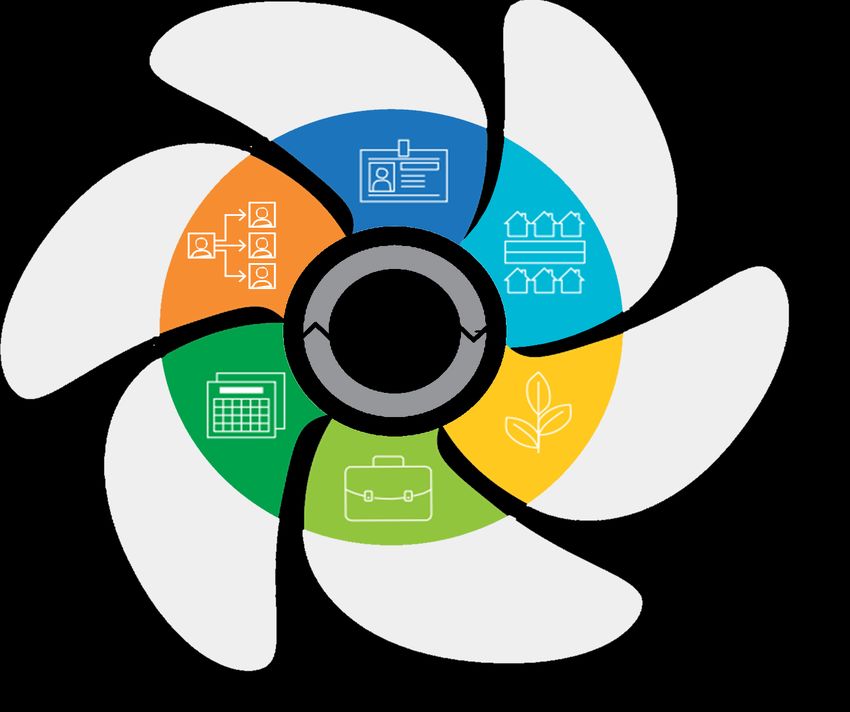
Company & industry overview
   Leading position in Chile & Peru
 FENIX POWER
 1. EBITDA* (US$ million)                                             2. INTERNATIONAL RATINGS                       3.   LTM ENERGY SALES (GWh)
                                                                                                                             Spot

       56
                                              70           68               BBB- Stable                                      10%
                     54                                                     Fitch
                                 36
                                                                            BBB- Stable                                        3.2
                                                                            S&P                                                GWh
                                                                            Ba1   Stable                                               PPAs
      2016           2017       2018         2019      2Q20 LTM
                                                                            Moody’s                                                    90%

 COLBUN TX
 1. EBITDA (US$ million)                                                    2.   LTM REVENUES BREAKDOWN (US$ million)

                                      72                  71                                                  National
               67                                                                     Dedicated
                                                                                                                38%
                                                                                        55%

                                                                                                     US$84
                                                                                                      mm
              2018                 2019               2Q20 LTM
                                                                                                             Zonal
                                                                                                              7%
Note: All figures as of Jun20                                                                                                                      3
*Adoption of the accounting standards IFRS16 since 2019: includes financial leases since that date
1. Cost efficient & diversified asset base
     Attractive markets

                                  LTM GENERATION            DEMAND GROWTH                   MARGINAL COST                   MARKET SHARE1
                                            GWh                 12 month average %             US$/MWh                                     %
                                                                                                                                 Others
                                                   Hydro                  SEIN                    Santa Rosa                      27%
                                                    57%
                                                                                                                                                 Peruvian Gov.
                            Others
                                                                                                                  Orazul                              14%
                             10%
                                                                                                                    5%
                                          49,686            0                                                   9 Statkraft
                                                                                                                       5%                               Enel
 SEIN                                                                                                                                                   15%
 13 GW                           GNL
                                 33%                                                  -5%
+0.1% y/y                                                                                                                   6%     Engie       Kallpa
                                                                                                                                    13%         15%

                                   Others                                                         Alto Jahuel
                                    19%
                                                                           SEN
                                                                                                                        Others
  SEN                                                                                                                    27%
                                                                                                                                                    AES Gener
 26 GW                                                                                                                                                 27%
                                                     Coal
+2.3% y/y                                            37%
                          Natural         77,333                                     1%                           42
                           Gas
                           18%                                                                                         Engie
                                                                                                                        9%
                                       Hydro
                                                                                                                                                    Enel
                                        26%                                                                                                         23%
                                                                                                                                   14%

 Note: All figures as of Jun20
 1 Based on generation                                                                                                                                         4
1. Cost efficient & diversified asset base
Geographical and technological diversification
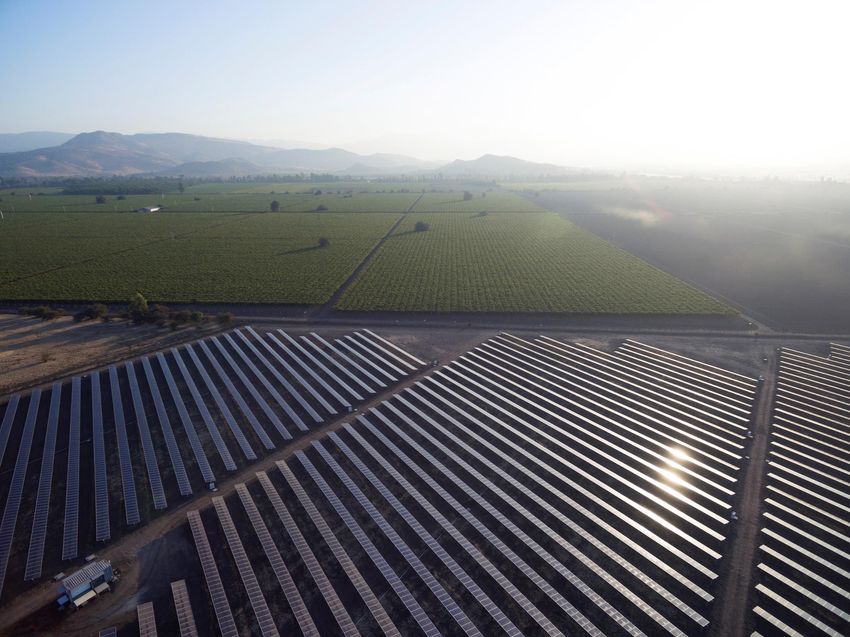
1. DIVERSIFIED GENERATION ASSETS 3. DECARBONIZATION PROCESS:
LOW IMPACT FOR COLBÚN
Photovoltaic
Coal-fired 0%
10%
▪ Colbún has only 1 coal-fired power
Open cycle
Combined cycle
plant of the 28 presented in the
12%
35% system when the agreement was
3,811MW signed.
Run of river
15%
▪ Santa Maria is one of the newest and
most efficient of the system.
Reservoir
28% ▪ It’s emissions are significantly below
the norm:
2019 Norm Limit
PM (mg/Nm3) 8 50
2. DIVERSIFIED HYDROLOGICAL BASINS IN CHILE
Nox (mg/Nm3) 310 500
Metropolitana S02 mg/Nm3) 188 400
Valparaiso 1%
13%
Maule
Los Lagos
41%
10%
1,614MW
Bio Bio
35%
51. Cost efficient & diversified asset base
Hydrological conditions
1. COLBÚN RESERVOIR LEVEL (m.a.s.l) 3. CHANGE IN ACCUMULATED RAINFALLS (%)
445
2018 2019 2020
435 As of Jun20 As of Jul20
compared to compared to
425
415
2019 Av. year 2019 Av. year
405
395
Los Quilos 323% -26% 378% -36%
Abanico -16% -8% -1% 8%
2. CHAPO RESERVOIR LEVEL (m.a.s.l)
250
2018 2019 2020 Armerillo 47% -12% 86% -5%
240
230 Angostura 4% -9% 32% 13%
220
Canutillar 7% 13% -4% 11%
6
Note: All figures as of Jul201. Cost efficient & diversified asset base
100% of PPAs supplied with cost-efficient generation
WHOLE-SALE COMMERCIAL STRATEGY GENERATION & PPAs LEVEL (TWh)
1. Optimize Contracting level
◼ Renewable Capacity: hydro, solar, wind
◼ Efficient thermal capacity: coal, CCGTs Hydro
3.9
3.8
2. Cost structure properly reflected in sale prices 4.5 Solar
4.6
3. Active risk management 2.6
2.7 Coal
◼ LNG purchases 0.1 1.9
11.0 11.5 1.8
◼ Commodity hedges 0.3 10.9 10.6 LNG
0.2
4. Unique portfolio of assets provide support our strategy 5.9 6.3 Diesel
5.1 4.7
◼ Hydroelectric power plants: Balanced cost structure and
ancillary services supply (system balancing) Total Commitments
◼ Gas-fired power plants: Coverage for years with dry
hydrology, and for wind and solar intermittency 2017 2018 2019 2Q20 LTM
GUIDELINES FOR THE FUTURE
1. Secure future cashflows with new PPAs Maximizing long-term profitability by
2. Incorporate competitive renewable projects, lowering achieving a competitive supply cost structure
the average supply cost structure Combining our efficient base-load capacity
3. Back-up contracts with efficient combined cycles with the development of our pipeline of wind
and solar projects
4. Additional products and services to customers
71. Cost efficient & diversified asset base
Secured long-term regasification capacity & LNG supply
LONG-TERM STRATEGY:
Leveraging our efficient natural gas power facilities and diversifying our supply sources; contributing to a
competitive, flexible, secure and sustainable power supply
1. REGASIFICATION CAPACITY AND SUPPLY CONTRACT WITH ENAP
▪ Effective from 2018 onwards, for 13 years
▪ Competitive LNG supply with ENAP and international suppliers
▪ Capacity for up to two combined-cycle units per year
2. LNG SPOT CONTRACTS
▪ Spot contracts with local providers upon short-term requirements
▪ Currently, we have signed contracts up to two combined-cycles until October
3. GAS FROM ARGENTINA
▪ Colbún has signed both firm and interruptible contracts to opportunistically take
advantage of competitive prices.
81. Cost efficient & diversified asset base
Recent developments in Chile’s regulatory framework
LATEST CHANGES BILLS UNDER DISCUSSION
1. Price stabilization mechanism for regulated clients tariffs 1. New distribution law
▪ Tariffs will be stabilized until Jan21, and adjusted by local CPI ▪ Update the regulation to better
until 2026 address technological advances
▪ Generators will accumulate collectable accounts for the ▪ Increase competitiveness and
difference between the contracts’ prices and the stabilized price investments
▪ The fund is denominated in US$ and is capped at US$1,350 million
2. Flexibility law
▪ The stabilization fund must be completely (re)paid by December
2027
▪ To address the consequences
arising from the increasing
2. Essential services payments delay incorporation of variable renewable
energy
▪ Beneficiaries: 60% most vulnerable families, elderly people,
people covered by the employment protection bill or those using
unemployment insurance
▪ The bill establishes that those beneficiaries can postpone their
payment for basic services 30 days before the bill enactment and
90 days after.
▪ Afterwards, the payment deferrals must be paid in 12 equal
monthly installments
▪ The law establishes that cooperatives in the distribution business
can also benefit from this law and postpone their payments to
generation companies
91. Cost efficient & diversified asset base
Addressing COVID19 at Colbún
CURRENT STATUS COMMUNITY SUPPORT
▪ Two priorities: protect the health of all our ▪ The payment period for supplier invoices was reduced
stakeholders and to the ensure the security of the from 15 days to 7 days
energy supply
▪ The confection of more than 40,000 face shields has
▪ Home office model for 98% of the headquarters been commissioned
workers
▪ Entrepreneurship Centers spaces have been made
▪ For positions with critical functions, the work is available to Health Services
maintained on-site, but with the necessary safeguards
▪ Different communication channels have been activated
▪ Currently, our power plants are operating normally. to contribute to the dissemination of protection and
self-care messages
▪ We expect to start the construction of Diego de
Almagro and Machicura in 3T20, as originally projected ▪ Contribution of basic food baskets for vulnerable
families, personal protection elements and sanitation
▪ Regarding the system’s power demand, as of July it has of streets and public spaces
recorded a decrease of 3% compared to 2019
▪ Contribution of more than 700,000 personal
Energy demand growth(%) protection elements to Hogar de Cristo
2.2%
-2.8% -1.7%
-0.2%
March April May June July August*
-3.4% -3.1%
Y/Y
10
*24/08/20202. Strong and competitive supply contracts
High quality clients in Chile
MAIN CONTRACTS
CUSTOMER BASE PROFILE SIGNED SINCE 2016
3.0 TWh/year, for 10
Sales % to Unregulated Customers Number of Unregulated Customers
years starting January
2022
41% 65% 4 270
2014 0.3 TWh/year, for 6 years
2014 LTM 2020 starting July 2020
Unregulated Customers Regulated Custormers
0.2 TWh/year, for 10 years
starting January 2019
PPAs IN CHILE: MAXIMUM CONTRACTED POWER SUPPLY (TWh)
Regulated Customers Unregulated Customers before 2016 Unregulated Customers after 2016 0.5 TWh/year, for 10.5
years starting July 2020
15 13.4 14.0 13.7
12.5
12 10.7 10.2 0.7 TWh/year, for 10 years
9 starting January 2018
6
3 ~ 8 YEARS AVERAGE LIFE 1.9 TWh/year with other
unregulated customers,
0 with a term from 4 to 6
2020 2021 2022 2023 2024 2025
years
Note: All figures as of Jun20 113. Prudent financial management
Stable operational results & solid metrics
1. EBITDA & EBITDA MG. (US$ million & %) 2. NET INCOME. (US$ million)
EBITDA EBITDA Mg
289
45% 47% 55% 60%
44%
45% 45% 230
36% 50% 205 202
40% 164
21%
30%
692 684 697 689
537 583 602 20%
352
10%
0%
2013 2014 2015 2016 2017 2018 2019* 2Q20
LTM* 2016 2017 2018 2019 2Q20 LTM
3. DEBT & NET DEBT. (US$ million) 4. DEBT/EBITDA & NET DEBT/EBITDA. (x)
Debt Debt/EBITDA
2,236 * 3.5
Net Debt Net Debt/EBITDA
1,894 1,806 2.8
1,700 *1,710 1,660 1,679 2.6
1,603 2.4 2.4
1,440 2.3
2.0 2.0
1,174 1.7
1,061 1,043
881 952 1.4
849 815 1.3
1.2 1.2
2013 2014 2015 2016 2017 2018 2019* 2Q20 LTM* 2013 2014 2015 2016 2017 2018 2019* 2Q20
Note: All figures as of Jun20 LTM*
12
**Adoption of the accounting standards IFRS163. Prudent financial management
Strong liquidity
1. CASH POSITION. (US$ million) 3. CASH FLOW. (US$ million)
810 854
788 797
667
Operating Activities Financing Activities
Investing Activities Net Cash Flow
2016 2017 2018 2019 2Q20 LTM
2016 2017 2018 2019 2Q20 133
199
16
1
2. DIVIDEND DISTRIBUTION. (US$ million & %) (421)
Additional
dividend
100% 100%
100%
100
50
50%
271 240
201
100
2016 2017 2018 2019
The Dividend Policy approved by the 2020’s Annual
Shareholders Meeting is 50% of the net income.
13
Note: figures as of Jun203. Prudent financial management
Long term debt profile
1. FINANCIAL DEBT PROFILE
US$1,705(*) mm 100% bonds 3.9% Interest Rate
average
US$1,391 million 97% USD and 3% UF
7.0 years
US$314 million 100% Fixed rate
average life
2. AMORTIZATION STRUCTURE (US$ million)
600 Fenix Bond 527
500
500
Colbun Bonds
400
300
184 168
200
100
0
2020 2021 2022 2023 2024 2025 2026 2027 2028 2029 2030
Note: All figures as of Jun20 14
(*) Financial leases are not includedAttractive pipeline of renewable energies
Solar and Wind Generation Projects
Feasibility Environmentally approved and construction approved by the Board of Directors
We hold a portfolio of solar and wind farm projects,
in different stages of development, for
5
3 approximately 3,100 MW
4
2
1
6
1 2 3 4 5 6
MACHICURA DIEGO DE INTI HORIZONTE JARDIN LOS
ALMAGRO PACHA SOLAR JUNQUILLOS
Estimated commissioning 2Q21 1Q22 2023 2023 2024 2025 + Other wind and
solar projects in
Installed capacity 9 MW 220 MW 486 MW 607 MW 537 MW 265 MW early stages of
development
COMPETITIVE ADVANTAGES OF OUR PROJECTS
Proximity to the Socio-Environmental Concessions /
Load Factors
transmission network viability Easements
15Maximizing value to all of our stakeholders
Sustainability strategy
EMPLOYEES
▪ Offering high-quality employment and a
safe work environment
▪ Annual Work Environment Surveys
▪ Strong relationship with our unions
▪ Annual Sustainable weeks to promote COMMUNITY AND SOCIETY
Colbún’s core values ▪ Building and maintaining open
relationships with the community
▪ Promoting the development of local
economy
SUPPLIERS AND CONTRACTORS ▪ Enhancing the community’s
▪ Ensuring traceable and auditable supply development through entrepreneurship,
processes education and sports programs
▪ Promoting a transparent and close
relationship Safe,
▪ Ensuring that the supply process comply competitive
with our Ethics Code and
▪ ProPyme Seal: certificate for paying our sustainable
SMEs1 in less than 30 days energy
ENVIRONMENT
▪ Minimizing our impact on the
environment
▪ Taking care of our natural
resources and using them in an
CLIENTS AND PROVIDERS efficient manner
▪ Providing a reliable, competitive and ▪ Online emissions monitoring in
sustainable electric energy supply Santa Maria and Nehuenco
▪ Generating long-term, transparent and power plants
strategic relationships INVESTORS
▪ Annual Client’s Day ▪ Providing transparent, timely and
▪ “Taylor-made” products and services relevant information to all of our
investors
▪ Annual Investor Surveys
16
Source: Company filings
1 Small and medium-sized enterprisesDisclaimer & Contact Information
▪ This document provides information about Colbún S.A. In no INVESTOR RELATIONS
case this document constitutes a comprehensive analysis of
the financial, production and sales situation of the company. TEAM CONTACT
▪ To evaluate whether to purchase or sell securities of the
company, the investor must conduct its own independent Miguel Alarcón
analysis. malarcon@colbun.cl
+ 56 2 2460 4394
▪ This presentation may contain forward-looking statements
concerning Colbún's future performance and should be
considered as good faith estimates by Colbún S.A. Soledad Errázuriz
serrazuriz@colbun.cl
+ 56 2 2460 4450
▪ In compliance with the applicable rules, Colbún S.A.
publishes on its Web Site (www.colbun.cl) and sends the
financial statements of the Company and its corresponding Isidora Zaldívar
notes to the Comisión para el Mercado Financiero, those izaldivar@colbun.cl
documents should be read as a complement to this + 56 2 2460 4308
presentation.
1718
You can also read