Corporate presentation - April 2018 - ElvalHalcor
←
→
Page content transcription
If your browser does not render page correctly, please read the page content below
April 2018   Corporate presentation
                                      1
Structure

           Aluminium                                   Copper
            segment                                   segment

                                   Other
                               participations
                                                     Copper tubes division
Aluminium rolling division
                             • Cenergy Holdings                  • Fitco
• Symetal                                                    • Sofia Med
                                  • Elkeme
• Elval Colour                                                • HC Isitma
• Anoxal                     • International Trade
• Vepal
• UACJ Elval Heat
  Exchanger Materials
• Viomal

                                                                                         2
Aluminium - Production facilities

End Product      Entities           Examples                                                     Aluminium rolling                      Aluminium                  Aluminium
                                                                                                                                        foil rolling             foil converting
Segments         involved           of end products
ALUMINIUM
Industrial       • Elval            • Lamp base/transformers
applications     • Elval Colour     • Renewable energy, Multi-layer tubes & bus ducts
Packaging        • Elval            • F&B containers and cans                                Oinofyta
                                                                                             Greece
                                                                                                                             Oinofyta
                                                                                                                             Greece
                                                                                                                                                        Mandra
                                                                                                                                                        Greece
                 • Symetal          • Closure caps
                                    • Flexible packaging & household foil
                                                                                             Capacity: 280,000 tons/year   Capacity: 52,000 tons/year   Capacity: 26,000 tons/year
Building &       •   Elval          •   Faҫades & roofing
Construction     •   Elval Colour   •   Rain gutters
                 •   Viomal         •   False ceilings & roller shutters
                 •   Vepal          •   Functional coatings & flashings                         Composite panels                    Aluminium                     Aluminium
                                                                                                                                  rolling shutters               coal coating
Transportation   • Elval            • Shipbuilding (e.g. catamarans)
                 • Elval Colour     • Commercial transportation (e.g. refrigerator trucks,
                 • Vepal              buses, fuel tanks, and rail wagons)
                                    • Automotive industry (e.g. air pressure vessels,
                                      internal parts, heat shields and heat exchangers)
Domestic         • Elval            • Cookware                                               St.Thomas                     Nea Artaki                    Thiva
applications     • Elval Colour     • White goods                                             Greece                        Greece                      Greece

                                                                                                                                                          Key processing plants      3
Copper - Production facilities

End Product           Entities      Examples                                                                                        Copper and brass            Copper alloy bars,
                                                                                                       Copper tubes
                                                                                                                                                                 tubes and wires
Segments              involved      of end products
COPPER
Industrial            • Halcor      • Fittings, boilers & filters, high frequency cables
applications          • Sofia Med   • Connector strips for automotive computers, switches,
                                      relays, transformer strips, strips for solar power,                                         Sofia                       Oinofyta
                                                                                                 Oinofyta                        Bulgaria                     Greece
                      • Fitco         collectors, plates, circles, bus bars                      Greece

                                    • Automotive industry (e.g. valves, fittings, bearings,
                                      connector pins), electrical & electronic (terminals,         Capacity: 75,000 tons/year   Capacity: 120,000 tons/year    Capacity: 40,000 tons/year
                                      plug inserts, contact pins)                              (copper tube plant producing)

Building &            • Halcor      • Water supply & heating networks, under floor heating
Construction                          & cooling, air-conditioning & refrigeration, natural &
                                      medical gas distribution networks, fire extinguishing
                                      networks
                      • Sofia Med   • Roofing, faҫades, rain gutters
                      • Fitco       • Faucets, valves, plumbing fittings, taps
Renewable Energy      • Halcor      • Solar panels & system networks, geothermal heating
                      • Sofia Med     & cooling
HVAC & R              • Halcor      • Air-conditioning, refrigeration & heat exchange
Innovative products   • Halcor      • Cusmart® (water supply, heating)
                      • Fitco       • UR30® (copper alloy net fish farm, cages, weirs &
                                      barriers)
                      • Sofia Med   • CuNiSi for connectors

                                                                                                                                                                Key processing plants       4
Sales breakdown
+12% +33% 2016 Strong Exporting Activity
2017 Increasing volumes sold
941
843
922 Over 90% of the revenue comes from existing long-standing client
relationships
693
Improved product mix
2016
Increasing conversion prices in the Copper sector and stable for
Aluminium sector
2017
M€
Africa Oceania
Aluminium Copper 1% 8% Greece
2%
America 6%
+21%
Asia 7%
1,863
1,534 2016
2017
11%
M€
Other Europe
GROUP 66%
EU (excl. Greece)
Sales in 103 countries
5
Volume of Sales
Consolidated Level
(from continuing operations) +7%
+6%
448
419
385 397
357
kt
292
268 283
Aluminium 240 264
Copper 117 121 129 136 156
2013 2014 2015 2016 2017
Aluminium segment The 44% of our sales were directed to the food
packaging industry (rigid and flexible), the 24% to
kt FRP Foil the transportation industry and the 26% to the
400 construction and industrial applications industry.
300 In 2017, by utilizing the passivation line which
65 66
54
57 63 operated in the prior year, the Company
200
increased it’s share in the bottle caps and closures
100 207 205 218 226 market following the increasing trend for the
186
usage of aluminium caps in the wine and spirit
0 bottles.
2013 2014 2015 2016 2017
6
Volume of Sales
Consolidated Level
(from continuing operations) +7%
+6%
448
419
385 397
357
kt
292
268 283
Aluminium 240 264
Copper 117 121 129 136 156
2013 2014 2015 2016 2017
Copper segment
Copper tubes sales continued to increase at higher
kt Tubes Rolling Cu Extrusion MS Extrusion rates than market growth.
200 The rolling products of copper and copper alloys for
industrial uses marked significant increases, as a result
of the increasing global demand as well as the
150 16 continuous improvements of the subsidiary Sofia Med.
13 24 On the other hand, a decline was marked for the
17
13 16 21
100 22 19 20
48
rolling copper products for roofing applications, as a
29 37 result of the substitution .
30 31
50 The sector achieved significant amounts in the brass
64 65 68 tubes, as a result of the reduced competition.
53 56
0
2013 2014 2015 2016 2017
7
Strong Global Presence

11 Cutting-edge
production Units

1 Joint-venture

1 Joint-venture at
set up level

Extensive
Commercial
Network

                                              8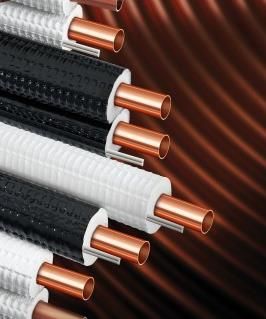
Corporate Responsibility
ElvalHalcor invests materially and systematically in their people. Focus on :
Employee ongoing training and development
Know-how diffusion
Team building
Human Resources Continuous improvement in workplace
The goal of “Zero accidents” remains ElvalHalcor’s top priority.
ElvalHalcor’s approach:
Implements a certified Management System (OHSAS 18001) in all
its premises
Continuous investments in infrastructure projects to reinforce
safety at work
Health & Safety
Behavioural audits in order to create a “Safety Climate”
Employee targeted training and awareness raising so as to create
a safety culture
Environmental protection is at the top of the ElvalHalcor’s list of priorities.
The Company:
Implements certified Management Systems (ISO 14001, ISO 50001)
Focus on practices to reduce its environmental footprint
Continuous investments in environmental protection infrastructures
Focus on circular economy programs
Environment Applying 100% copper, brass, zinc and aluminum recycling
Promote copper and aluminium recycling, through initiatives such as the Aluminium
Can Recycling Centre (www.canal.gr)
9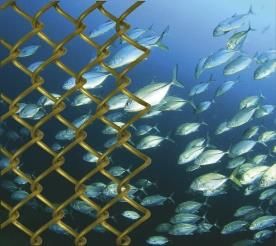
Aluminium segment
Aluminium segment

     With state-of-the-art              The aluminium segment           Significant international     During the last ten years
 production facilities in Greece       comprises, the aluminium          presence - more than          over EUR 350 mil. have
  and a dynamic commercial          rolling division, under the Elval   85% of turnover in sales    been invested in equipment
    presence across all key        brand name and the aluminium         abroad - promoting its          and R&D for capacity
  geographies, the aluminium       processing subsidiaries Symetal,     portfolio of products in     expansion and continuous
 segment is well positioned in     Elval Colour, Vepal, Anoxal and      more than 98 countries.       improvement of quality.
the global aluminium industry.       Viomal. It operates 7 plants in
                                         Greece, with an annual
                                   production capacity exceeding
                                              280,000 tons.

                                                                                                                                  11
Competitive advantages
1 2 3 4 5
Production Medium size –
capability for Upgraded / state-of- Extensive Strategic alliance
flexible
wide coils (up to the-art key equipment distribution with UACJ Corp.
independent
2.5 m) and long – Emphasis on R&D. network.
supplier.
slabs (8m). Quality compatible with
the highest market
standards.
12Sales breakdown (2017)
By product category By geographical segment
Building
Transportation: & construction
marine & automotive, Africa & Oceania 11% Greece
road & rail 13%
20% 2%
America 7%
23%
Asia 7%
Flexible
packaging
89%
Exports
9%
27%
Other Europe
Rigid 63%
packaging
EU (excl. Greece)
17%
Industrial
applications
by Volume by Value
13Protecting the environment
1 2 3 4 5 6
Air pollution State-of-the-art Automated and Rolling oil Safe aluminium Aluminium recycling
abatement industrial on-line regeneration recycling with and educational
equipment wastewater environmental modern and programs at Canal
treatment plant parameter energy efficient (Aluminium Can
(ZLD) monitoring delacquering Recycling Centre)
furnaces www.canal.gr
14Certified processes and quality standards
Production: certified according to ISO 9001/2008
Environmental Management: certified with ISO 14001/2004
Energy Management System: certified according ISO 50001/2015
Health and Safety Management Systems: certified according to
Οccupational Health and Safety Management Systems:18001/2007
Certified according to IATF 16949
Quality standards according to individual customer requirements.
15Targets & Prospects
Focus of the materialization of the five-year investment plan total worth of EUR 150 million for machinery and
infrastructure with the procurement of a four-stand tandem aluminium hot finishing mill for the production unit in Oinofyta
With the purpose of increasing the core production capacity of the aluminium sector to satisfy demand in the
existing categories and expand to new categories
Further overall cost efficiency improvement
Quality improvement
Introduction of innovative alloys for the demanding market of heat exchangers
Further penetration in the market of multilayer tubes and the production of thicker aluminium sheets (especially for the
shipping industry)
16Copper segment
Copper segment

   Versatile and dynamic copper        Leader in Europe in    Considerable part      Wide range of          Strong input in:
solutions through its copper tubes        copper tubes.       of Greek exports.      products and
 division, under the brand name            Dynamically       Halcor is a leader in     capable to       •   HVAC&R industry
Halcor, and its copper processing        growing market         the European             meet           •   Electrical industry
  subsidiaries, Fitco (Greece) and      presence in other       copper tubes          demanding         •   Production
       Sofia Med (Bulgaria).                products.          market and its         customers’            engineering
                                                             products are sold in    specifications.
 Halcor’s copper tube plant is one                              more than 77
  of the most efficient plants in                             countries around
 Europe and the biggest in EMEA                                   the world.
region. It has also one of the three
     biggest extrusion presses
             worldwide.                                                                                                           18
Competitive advantages
1 2 3 4 5
Biggest and one State of the art Sophisticated Extensive Established
of the most manufacturing technological support distribution presence in
efficient plants equipment and through the innovative network. HVAC industry
in EMEA quality Tube Heat Transfer
procedures Laboratory
19Sales breakdown (2017)
By product category By geographical segment
Bus bars & rods Cu
Africa & Oceania
15% 4% Greece
2%
America 6%
Rods & Tubes Ms
Asia
10% 44% 7%
Tubes Cu
96%
13% Outside
Greece
Other Europe
68%
31% EU (excl. Greece)
Rolling Cu + Ms
by Volume by Value
20Protecting the environment
1 2 3
Complete Air
Closed circuit Industrial
pollution
degreasing wastewater
abatement
system at tubes treatment (synergies
equipment at
plant with Elval) – foundry
foundry plant
and Fitco
21Quality
SPAIN - AENOR GERMANY - GL GERMANY - TUV CERT ROMANIA - AR
Halcor has the capability to produce according to RUSSIA - GOST FRANCE - CSTB GERMANY - DVGW FINLAND - VTT
all international specifications and to customer
specific requirements with the highest standards
of Quality at all times.
Production: certified according to ISO 9001/2008 SWEDEN - SITAC USA - NSF FRANCE - AFNOR GERMANY - CU
Environmental Management: certified with ISO
14001/2004
Energy Management System: certified according
ISO 50001/2015
CROATIA - VIK U.K. - BSI SINGAPORE - SETSCO EUROPEAN COM.
Health and Safety Management Systems:
certified according to Οccupational Health and
Safety Management Systems:18001/2007
ALGERIA - GREDEG NETHERLANDS - KIWA
22Targets & prospects
Cu Tubes
Penetrate certain markets of interest (Nordic, Gulf and former Eastern European)
Further enhance relations with customers on the technical level
Enhance the sales of tubes for CO2 applications
Improve the mix of customers related to winders (LWC, LWC_IGT and ECUTHERM) in order to improve average profitability
Increase of production capacity in high added value products
Utilizing the new capacity
Ms extruded products
Production of special alloys of brass for car industry & drinking water applications
Maintaining the volume of sales of brass tubes
Increase in the production of copper alloy wires for electrical and industrial applications
Cu & Alloys rolling products
Further quality improvements and establishment as 1st rank producer of rolled products, attaining standards like the IATF
16949:2018 for Automotive
Increased market share in higher value added products (e.g. HP alloys for connectors and automotive industry)
Take advantage of increased demand in order to maintain double-digit rate growth
Improve cost and effective capacity
23Financial Performance
24Consolidated Financial Results (at 12month basis)
The consolidated gross profit was increased to EUR 156.9 million versus EUR 114.1 million in 2016. This increase, apart from the increase
of the metal profit is also attributable to the increase of the volume of sales.
The increase of the volume of sales by +15.4% of the Copper segment for 2017 versus 2016 and the Aluminium segment by +3.2% for
2017 versus 2016, affected positively the profitability at EBITDA and a-EBITDA level.
As a consequence the operational profitability rose to EUR 102.0 million for 2017 versus EUR 68.5 million for the prior fiscal year 2016.
Profits before taxes amounted to EUR 63.9 million for 2017 versus EUR 32.3 million for the respective twelve-month period of 2016.
Μ€
180
161 2016 2017
157
160
140 125 129
114 118
120
102
100
80 69 64
60
40 32
20
0
Gross profit EBITDA a-EBITDA EBIT ΕΒΤ
25Financial Results – Aluminium segment (on a 12month basis)
The gross profit amounted to EUR 96.1 million versus EUR 74.2 million in 2016. This increase, apart from the increase of the metal profit is
also attributable to the increase of the volume of sales.
The average price of Aluminium reached EUR 1,742 per ton for 2017 versus EUR 1,451 per ton in 2016.
In regards to the costs, the improvements in the production procedure led to the reduction of the production cost and enhanced the the
competitiveness of the products abroad.
Μ€
120 2016 2017
110
100 96 89
80 74
67
60 54
49
40 33
20
0
Gross profit EBITDA EBIT ΕΒΤ
26Financial Results – Copper segment (on a 12month basis)
The gross profit amounted to EUR 60.8 million versus EUR 39.9 million in 2016. This increase, apart from the increase of the metal
profit is also attributable to the increase of the volume of sales.
The average price of Copper reached EUR 5,453 per ton for 2017 versus EUR 4,399 per ton in 2016.
In regards to the costs, the improvements in the production procedure led to the reduction of the production cost and enhanced
the the competitiveness of the products abroad.
Μ€
70
61 2016 2017
60
51
50
40 35
40 35
30
20
20
10
10
0
Gross profit EBITDA EBIT -1 ΕΒΤ
-10
27Financial Results – Deviation on Profit before Taxes (on a 12month L-f-L basis)
1 2
Volumes:
Al: 2017 292 kt vs. 283 kt (Δ:+3.2% )
Cu: 2017 156 kt vs. 136 kt (Δ:+15.4%) 6
3 2
64
26
Non-recurring expenses
Μ€ 10 and reclassifications
Al: -4 Μ€
Cu: -2 Μ€
8
32
Average Prices:
Al: 2017 1,742 €/t vs. 1,451 €/t
Cu: 2017 5,453 €/t vs. 4,398 €/t
2016 Volume Price & Mix Metal Other Depreciation Admin & Other Fixed Financial 2017
Variable Sales
28Working Capital evolution
Evolution of inventory following the
uptrend of metal prices and sales volume
Improved Receivables Cycle. evolution.
23.3%
454
434
414
352
240
Μ€ 199
178 179
Receivables Inventory Payables Working Capital
2016 pf 2017
29Effects on Net Debt (on a 12month L-f-L basis)
Consistent with the evolution
Μ€ of the Metal prices and
volumes uptrend
Cash Cash
20
50 11
39 61 43 1 41
60
35
Commitment to Capex
524 dedicated to growth 527
Positive financial result
of the fiscal year
Net Debt Profitability Working Interest Depreciation Other Capex Capex other Net effect Net Debt
2016 Capital Charges operating Growth from 2017
effect financing
30Debt Maturity
Extension of maturity of major bond loans in five years’.
Debt Maturity
in M€ as at 31/12/2017
251
Short-term Long -term
48% 52%
39
4
1-2 years 2-5 years 5+ years
31Disclaimer
This presentation has been prepared by ElvalHalcor S.A. (the «Company») for use during the Hellenic Fund and Asset Management Association. This text is provided under confidentiality for discussion and not
for public acknowledgement.
The information contained in the presentation have not been independently verified and nor representation or guarantee, expression or suggestion, can be made, and not trust should be give, as to the
fairness, accuracy, completion or correction of information or opinions expressed herein. No-one from the Company, shareholders’ or any of the related parties, consultants or representatives will have any
liability (in case of negligence or otherwise) for any loss which happens in any way by any use of this text or its contents or arising by it.
Unless otherwise stated, all the financial information included in the present have been prepared according to the International Financial Reporting Standards (I.F.R.S.) or Greek GAAP.
This presentation does not constitute offering or invitation for purchase or registration of any shares and it can neither as a whole or a part of it be the basis, or based in relation to any contract or obligation.
The information contained in the presentation can be subject to renewal, additions, revision and modification and these information might change significantly. No person is obligated to refresh or maintain
the information contained herein and the related expressed comments are connected with it which are subject to change without notice.
This presentation is aimed for persons with professional experience in issues related to investments and no action should be taken or based upon by persons who are not the Relevant Party (as such defined
herein). Proposal that stem from this presentation, will be addressed only if the related person is Relevant Party.
This presentation and its contents are confidential and should be distributed, published or reproduced (in whole or as a part of it) or transmitted by the recipients to any other party, regardless of being a
Relative Party. The recipients of this presentation should not base any action in relation to investments or related products (as stated in the Financial Services and Market Acts 2000 (FSMA) and in the Code of
Market conduction of FSMA), which will be market manipulation for the purposes of FSMA in relation to the information included in the presentation until the information have been publicly available. Neither
the recipient should use the information in any way, which would constitute “market manipulation”. If you have received this presentation and you are not Relevant Party you have to return it immediately to
the Company. This presentation does not constitute recommendation regarding the Company’s shares.
FORWARD LOOKING STATEMETNS
This text includes forward looking statements.
Apart from historical information, this presentation includes future estimates which are susceptible to specific risks and uncertainties that could cause significant deviation to the actual operational results,
economic conditions, liquidity, performance, prospects and opportunities including but not limited to the following: the uncertainty of national and global economy, general economic conditions and
economic conditions of the sector of the Company more specifically, competition from other companies.
In spite that the Company believes that the expectations reflected by those future projections are based on fair estimates, it does not assure that the expectations will be fulfilled. The future projections are
realized at the date of this presentation, and no liability can be assumed, renewed publicly or revised any future projection, either as a result of new information, future events or for any other reason.
By attending this presentation, you agree upon complying with the aforementioned limitations.
32You can also read