Corporate Presentation February 2022 - Mining Data Online
←
→
Page content transcription
If your browser does not render page correctly, please read the page content below
Corporate Presentation
February 2022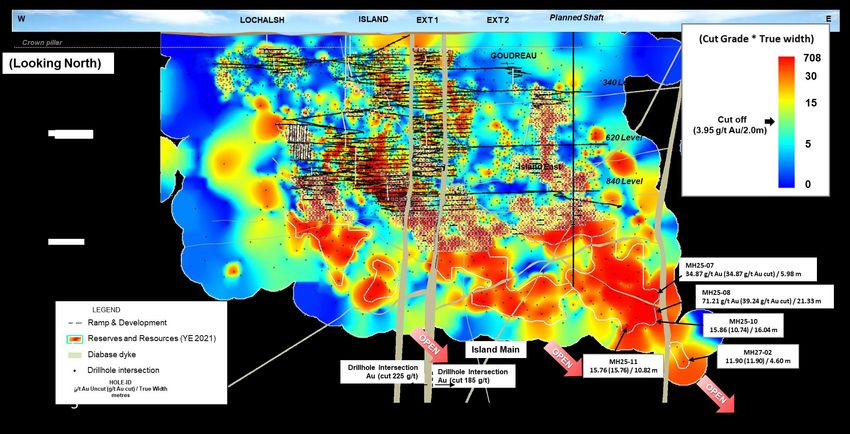
Cautionary Notes
This presentation, the information contained herein, any other materials provided in connection with this presentation and any oral remarks accompanying this presentation (collectively, the “Presentation”), has been prepared by Alamos Gold Inc. (“Alamos” or the “Company”) solely for information purposes. No stock
exchange, securities commission or other regulatory authority has approved or disapproved of the information contained herein. This Presentation does not constitute an offering of securities and the information contained herein is subject to the information contained in the Company’s continuous disclosure documents
available on the SEDAR website at www.sedar.com or on EDGAR at www.sec.gov.
Cautionary Notes
This Presentation contains statements that constitute forward-looking information as defined under applicable Canadian and U.S. securities laws. All statements in this Presentation, other than statements of historical fact, which address events, results, outcomes or developments that Alamos expects to occur are, or may
be deemed to be forward-looking statements and are based on expectations, estimates and projects as at the date of this Presentation. Forward-looking statements are generally, but not always, identified by the use of forward-looking terminology such as "expect", “assume”, “schedule”, "estimate", "budget", “continue”,
“potential”, “outlook”, “plan”, “on track” or variations of such words and phrases and similar expressions or statements that certain actions, events or results “may", "could”, “would", "might" or "will" be taken, occur or be achieved or the negative connotation of such terms. Such statements include, but may not be
limited to, information and expectations as to Alamos’ net asset value, operating cash flow, free cash flow, forecast gold production, mineral reserves, mineral resources, exploration potential, mining rates, mine life, reserve life, gold grades, recoveries, waste-to-ore ratios, forecasted costs including total cash cost, all-in
sustaining costs, debt levels, capital expenditures, the Company’s COVID-19 measures, Lynn Lake project and timing of regulatory approvals and construction decision, expected completion dates of the shaft expansion project at Island Gold and construction of the La Yaqui Grande project, and future plans and objectives
based on forecasts of future operational or financial results. Alamos cautions that forward-looking statements are necessarily based upon several factors and assumptions that, while considered reasonable by Alamos at the time of making such statements, are inherently subject to significant business, economic, technical,
legal, political and competitive uncertainties and contingencies. Known and unknown factors could cause actual results to differ materially from those projected in the forward-looking statements, and undue reliance should not be placed on such statements and information. Such factors and assumptions include, but are
not limited to: changes to current estimates of Mineral Reserves and Resources; changes to production estimates (which assume accuracy of projected ore grade, mining rates, recovery timing and recovery rate estimates which may be impacted by unscheduled maintenance, weather issues, labour and contractor
availability and other operating or technical difficulties); operations may be exposed to new diseases, epidemics and pandemics, including the effects and potential effects of the COVID-19 and its impact on the broader market and the trading price of the Company's shares; provincial and federal orders or mandates
(including with respect to mining operations generally or auxiliary businesses or services required for operations) in Canada, Mexico, the United States and Turkey; the duration of regulatory responses to the COVID-19 pandemic; governments and the Company’s attempts to reduce the spread of COVID-19 which may affect
many aspects of the Company's operations including the ability to transport personnel to and from site, contractor and supply availability and the ability to sell or deliver gold doré bars; fluctuations in the price of gold or certain other commodities such as, diesel fuel, natural gas, and electricity; changes in foreign exchange
rates (particularly the Canadian Dollar, Mexican Peso, U.S. Dollar and Turkish Lira); the impact of inflation; changes in our credit rating; any decision to declare a quarterly dividend, employee and community relations; litigation and administrative proceedings; (including but not limited to the investment treaty claim
announced on April 20, 2021 against the Republic of Turkey by the Company’s wholly-owned Netherlands subsidiaries, Alamos Gold Holdings Coöperatief U.A, and Alamos Gold Holdings B.V.); disruptions affecting operations; availability of and increased costs associated with mining inputs and labour; delays in respect of:
the Phase III expansion project at the Island Gold mine, construction at the La Yaqui Grande project, completion of permitting and construction decision at Lynn Lake and/or in the development or updating of mine plans; the risk that the Company’s mines may not perform as planned; uncertainty with the Company’s ability
to secure additional capital to execute its business plans, the speculative nature of mineral exploration and development, including the risks of obtaining and maintaining necessary licenses and permits, including the necessary licenses, permits, authorizations and/or approvals from the appropriate regulatory authorities for
the Company’s development stage and operating assets; labour and contractor availability (and being able to secure the same on favourable terms); contests over title to properties; expropriation or nationalization of property, inherent risks and hazards associated with mining and mineral processing including
environmental hazards, industrial hazards, industrial accidents, unusual or unexpected formations, pressures and cave-ins; changes in national and local government legislation (including tax and employment legislation), controls or regulations in Canada, Mexico, Turkey, the United States and other jurisdictions in which
the Company does or may carry on business in the future; increased costs and risks related to the potential impact of climate change; failure to comply with environmental and health and safety laws and regulations; disruptions in the maintenance or provision of required infrastructure and information technology systems;
risk of loss due to sabotage, protests and other civil disturbances; impact of global liquidity and credit availability and the values of assets and liabilities based on projected future cash flows; risks arising from holding derivative instruments; and business opportunities that may be pursued by the Company. The litigation
against the Republic of Turkey, described above, results from the actions of the Turkish government in respect of the Company’s projects in the Republic of Turkey; it is a mitigation effort and may not be effective or successful. If unsuccessful, the Company’s projects in Turkey may be subject to resource nationalism and
further expropriation; the Company may lose any remaining value of its assets and goldmining projects in Turkey and its ability to operate in Turkey. Even if successful, there is no certainty as to the quantum of any damages award or recovery of all, or any, legal costs. Any resumption of activities in Turkey or even retaining
control of its assets and gold mining projects in Turkey can only result from agreement with the Turkish government. Such litigation may have an impact on foreign direct investment in the Republic of Turkey which may result in changes to the Turkish economy, including but not limited to high rates of inflation and
fluctuation in the Turkish Lira which may also affect the Company’s relationship with the Turkish government, the Company’s ability to effectively operate in Turkey, and which may have a negative effect on overall anticipated project values. Additional risk factors and details with respect to risk factors that may affect the
Company’s ability to achieve the expectations set forth in the forward-looking statements contained in this Presentation are set out in the Company’s latest 40-F/Annual Information Form and MD&A, each under the heading “Risk Factors”, available on SEDAR at www.sedar.com or on EDGAR at www.sec.gov and should be
reviewed in conjunction with the information, risk factors and assumptions found in this Presentation. The Company disclaims any intention or obligation to update or revise any forward-looking statements whether as a result of new information, future events or otherwise, except as required by applicable law. Market
data and other statistical information used throughout this Presentation are based on internal company research, independent industry publications, government publications, reports by market research firms or their published independent sources. Industry publications, governmental publications, market research
surveys and forecasts generally state that the information contained therein has been obtained from sources believed to be reliable. Although Alamos believes such information is accurate and reliable, it has not independently verified any of the data from third party sources cited or used for the Company’s management’s
industry estimates, nor has Alamos ascertained the underlying economic assumptions relied upon therein. While Alamos believes internal company estimates are reliable, such estimates have not been verified by any independent sources, and Alamos makes no representations as to the accuracy of such estimates.
Note to U.S. Investors
All resource and reserve estimates included in this Presentation have been prepared in accordance with Canadian National Instrument 43-101 -Standards of Disclosure for Mineral Projects (“NI 43-101”) and the Canadian Institute of Mining, Metallurgy and Petroleum (the “CIM”) –CIM Definition Standards on Mineral
Resources and Mineral Reserves, adopted by the CIM Council, as amended (the “CIM Standards”). NI 43-101 is a rule developed by the Canadian Securities Administrators, which established standards for all public disclosure an issuer makes of scientific and technical information concerning mineral projects. U.S. investors
should review in detail the cautionary note set out on slide 54.
Cautionary non-GAAP Measures and Additional GAAP Measures
Note that for purposes of this section, GAAP refers to IFRS. The Company believes that investors use certain non-GAAP and additional GAAP measures as indicators to assess gold mining companies. They are intended to provide additional information and should not be considered in isolation or as a substitute for measures
of performance prepared with GAAP. “Cash flow from operating activities before changes in non-cash working capital” is a non-GAAP performance measure that could provide an indication of the Company’s ability to generate cash flows from operations and is calculated by adding back the change in non-cash working
capital to “cash provided by (used in) operating activities” as presented on the Company’s consolidated statements of cash flows. “Cash flow per share” is calculated by dividing “cash flow from operations before changes in working capital” by the weighted average number of shares outstanding for the period. “Free cash
flow” is a non-GAAP performance measure that is calculated as cash flows from operations net of cash flows invested in mineral property, plant and equipment and exploration and evaluation assets as presented on the Company’s consolidated statements of cash flows and that would provide an indication of the
Company’s ability to generate cash flows from its mineral projects. “Mine site free cash flow” is a non-GAAP measure which includes cash flow from operating activities at, less capital expenditures at each mine site. “Return on equity” is defined as earnings from continuing operations divided by the average total equity for
the current and previous year. “Mining cost per tonne of ore” and “cost per tonne of ore” are non-GAAP performance measures that could provide an indication of the mining and processing efficiency and effectiveness of the mine. These measures are calculated by dividing the relevant mining and processing costs and
total costs by the tonnes of ore processed in the period. “Cost per tonne of ore” is usually affected by operating efficiencies and waste-to-ore ratios in the period. “Total cash costs per ounce”, “all-in sustaining costs per ounce”, and “mine-site all-in sustaining costs” as used in this analysis are non-GAAP terms typically used
by gold mining companies to assess the level of gross margin available to the Company by subtracting these costs from the unit price realized during the period. These non-GAAP terms are also used to assess the ability of a mining company to generate cash flow from operations. There may be some variation in the method
of computation of these metrics as determined by the Company compared with other mining companies. In this context, “total cash costs” reflects mining and processing costs allocated from in-process and doré inventory and associated royalties with ounces of gold sold in the period. Total cash costs per ounce are
exclusive of exploration costs. “All-in sustaining costs per ounce” include total cash costs, exploration, corporate and administrative, share based compensation and sustaining capital costs. “Mine-site all-in sustaining costs” include total cash costs, exploration, and sustaining capital costs for the mine-site, but exclude an
allocation of corporate and administrative and share based compensation. “Adjusted net earnings” and “adjusted earnings per share” are non-GAAP financial measures with no standard meaning under IFRS. “Adjusted net earnings” excludes the following from net earnings: foreign exchange gain (loss), items included in
other loss, certain non-reoccurring items and foreign exchange gain (loss) recorded in deferred tax expense. “Adjusted earnings per share” is calculated by dividing “adjusted net earnings” by the weighted average number of shares outstanding for the period. Additional GAAP measures that are presented on the face of the
Company’s consolidated statements of comprehensive income and are not meant to be a substitute for other subtotals or totals presented in accordance with IFRS, but rather should be evaluated in conjunction with such IFRS measures. This includes “Earnings from operations”, which is intended to provide an indication
of the Company’s operating performance and represents the amount of earnings before net finance income/expense, foreign exchange gain/loss, other income/loss, and income tax expense. Non-GAAP and additional GAAP measures do not have a standardized meaning prescribed under IFRS and therefore may not be
comparable to similar measures presented by other companies. A reconciliation of historical non-GAAP and additional GAAP measures are detailed in the Company’s Management’s Discussion and Analysis available at www.alamosgold.com.
Technical Information
Chris Bostwick, FAusIMM, Alamos Gold’s Senior Vice President, Technical Services, has reviewed and approved the scientific and technical information contained in this presentation. Chris Bostwick is a Qualified Person within the meaning of NI 43-101. The Qualified Persons for the NI 43-101 compliant Mineral Reserve and
Resource estimates are detailed in the tables in the appendix of this Presentation.

                                                                                                                                                                                                                                                                                                TSX:AGI ǀ NYSE:AGI                         2
Growing, diversified, intermediate gold producer
                                                                                                                                                                                                                                        12 year average mine life
     Strong                                                                                                                                                                                                                supported by 10.3M oz Mineral Reserve base4

     operating                                                  ~460k oz                                                               ~$1,215
                                                           2022E gold production1                                              2022E AISC per ounce1,2,3
     base

     Fully funded                                                                                                                                                                                                       Lynn Lake, Canada
     organic                                                      ~750k oz                                                                 ~$800                                                                                                            Island Gold, Canada
                                                        2025E production potential                                              2025E AISC per ounce2,3
     growth                                                                                                                                                                                                                                                 Young-Davidson, Canada

                                                                                                                                                                                                          Quartz Mountain, USA

     Low                                                              100%                                                                   85%                                                                                                               Producing Assets

     geopolitical                                                 North American                                                       Net asset value                                                          Mulatos, Mexico                                Exploration / Development Assets
                                                                    production                                                        Canadian assets5
     risk profile                                                                                                                                                                                                          Esperanza, Mexico

     Strong                                                                                                                                                                                                   TSX | NYSE: AGI                         Cash & cash eq7: US$173M
                                                                    $238M                                                                     12%
     shareholder                                  Returned to shareholders through                                       Average annualized return since                                                      Recent share price6: C$9.38             Debt7: US$0
                                                       dividends & buybacks                                                          20036
     returns                                                                                                                                                                                                  52 week range: C$8.30 – 11.33           Dividend: $0.10/sh
1 Based on mid point of 2022 guidance                                                                                                                                                                         Market cap: ~C$3.7B                     Shares o/s (basic): 391.9M
2 Total consolidated all-in sustaining costs include corporate and administrative and share based compensation expenses. For the purposes of calculating all-in sustaining
costs at individual mine sites, the Company does not include corporate and administrative and share based compensation expenses                                              5
3 Please refer to Cautionary Notes on non-GAAP Measures and Additional GAAP Measures                                                                                           Based on consensus analyst net asset value (NAV) estimates
                                                                                                                                                                             6 Asof February 23, 2022
4 Proven & Probable Mineral Reserves total 10.3 million ounces of gold (202 mt at 1.58 g/t Au) as of December 31, 2021. Average mine life at Young-Davidson and Mulatos

based on Reserves, and Phase III expansion mine plan at Island Gold
                                                                                                                                                                             7 Cash & cash equivalents and debt as of December 31, 2021
                                                                                                                                                                                                                                                            TSX:AGI ǀ NYSE:AGI                3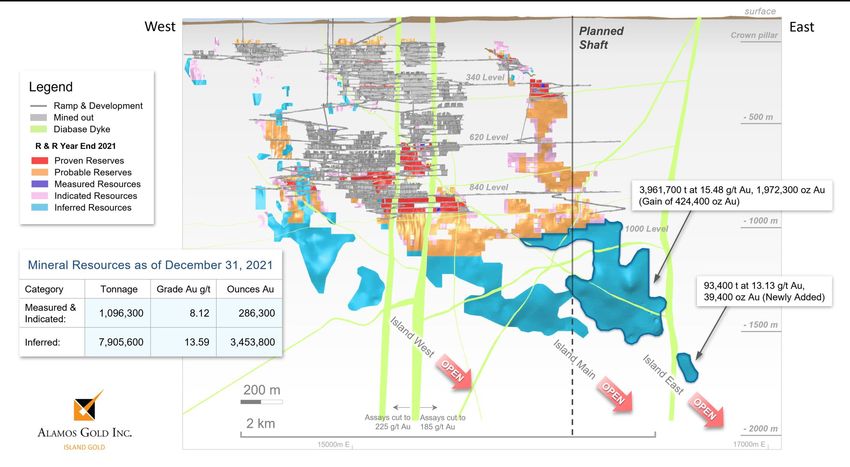
Sustainable business model supporting long-term value creation

              Conservative, low-risk                                                                                            Balanced approach to                                    Long-term track record
                    strategy                                                                                                      capital allocation                                       of value creation

                                                                                                                                                                 Return capital to
                                                                                                                                                                  shareholders

                    Safe jurisdictions                                                                          Strong ongoing
                                                                                                                                                                   Strengthen               Counter-cyclical
                                                                                                                   cash flow2                                                         Approach to M&A, acquiring high-quality
                 100% North American production                                                                                                                   balance sheet
                                                                                                                  generation                                                              assets at weaker point in cycle

                                                                                                                                                                 Reinvest in high-
                               Debt-free                                                                                                                          return internal
                                                                                                                                                                                                 $1.4 billion
               $173M cash & $673M total liquidity1                                                                                                                                   combined value2,3 added at Young-Davidson
                                                                                                                                                                 growth projects         and Island Gold since acquisition

                           Fully funded                                                                                                                                                              $12/oz
                                                                                                                                                                                     cost to discover 3.7M oz of Inferred Mineral
                                  organic growth
                                                                                                                                                                                     Resources at Island Gold over past four years

1 Cash& cash equivalents as of December 31, 2021. Total liquidity includes cash, and cash equivalents and undrawn $500M credit facility
2 Pleaserefer to Cautionary Notes on non-GAAP Measures and Additional GAAP Measures
3 Based on consensus analyst net asset value estimates plus cumulative free cash flow generated since acquisitions as of Q4 2021, and net of acquisition costs                                                   TSX:AGI ǀ NYSE:AGI   4
ESG – leading on key metrics with focus on continuous improvement
                                    Environment                                                                                                     Social                                                                                     Governance
                       Lower GHG emissions per oz gold eq. produced1,2                                                                       Lost time injury rate                                                              89%                                           33%
                                             0.69                                                                                  0.34                                                                                       Director                                  Board members

                                                                                                               per 200,000 hours
                                                                                                                                                                                                                           independence                                   are women
                                  0.54
                                                                       31%                                                                                                       38%
            tCO2e/oz

                                                                                                                                                            0.21

                                                                                                                    worked
                         0.37
                                                                lower than                                                                0.17                                                                     o Alignment of executive pay to performance &
                                                                                                                                                 0.14                         reduction
                                                           intermediate average                                                                                                                                      shareholder interests
                                                                                                                                                                              since 2018
                                                                                                                                                                                                                   o Top 15% ranking in 2021 Globe and Mail Board Games,
                         AGI     Int Avg    Sr Avg                                                                                 2018   2019   2020      2021                                                      including 3rd highest ranked in materials sector

             Higher water efficiency per oz gold eq. produced1,2

                                  40.0
                                                                                                                                    80%                                    $2.4M
    water withdrawl

                                             26.3                     78%                                          of global workforce                                 invested in
        m3/oz

                                                            recycled water use                                       hired from local                              community initiatives
                         8.2                                                                                           communities                                       in 2020

                         AGI     Int Avg    Sr Avg

       o Carbon footprint & energy reduction initiatives                                                      o Recognition for social contributions:
         o Grid power connection at Mulatos                                                                     o Best Corporate Social Responsibility Practice 20193
         o Automation with YD lower mine expansion                                                              o Empresa Socialmente Responsable (ESR)4 award
         o 35% reduction in life of mine GHG emissions with                                                        – 13 consecutive years
            Island Gold Phase III expansion                                                                     o Ethics and Values in Industry5 award

       o               Zero significant environmental incidents in 2021                                       o 33% reduction in recordable injury rate since 2018
1 2020 data sourced from Bloomberg and company reports.                                                                                                                               4 Empresa   Socialmente Responsable (ESR) – CSR Award received from Mexican Center for Philanthropy
2 Intermediate average includes BTO, ELD, NGD, OGC, PAAS, SSRM, YRI. Senior average includes AEM, GOLD, K, KL, NEM                                                                    5 Awarded   by CONCAMIN, the Industrial Chambers Confederation of Mexico
3 Best Corporate Social Responsibility Practice 2019 from Cemefi, AliaRSE and Forum Empresa for Alamos’ voluntary relocation program of residents from Mulatos to Matarachi, Mexico                                                                                       TSX:AGI ǀ NYSE:AGI   5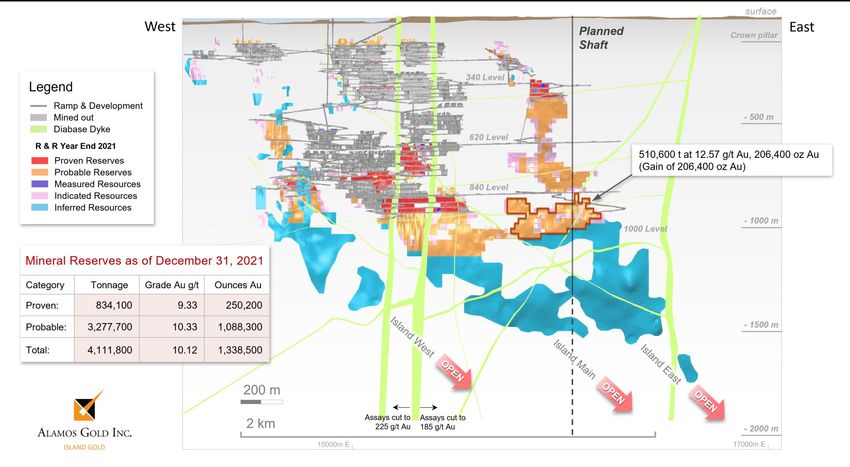
ESG – strong relative performance & positive rating trend
                ESG disclosure and reporting
                                                                                                                       2018   2019   2020   2021   Trend   Score/notes
    o Adopting TCFD recommendations and
      incorporating climate-related risk into                                                                                                              Medium risk; 20th percentile in
      disclosures                                                                                                        -     47    39     29
                                                                                                                                                           gold subindustry

    o Completed CDP questionnaire for the first time                                                                                                       Key issue score of 4.8; better
      in 2021                                                                                                           BB    BBB    BBB    BBB
                                                                                                                                                           than industry average of 4.4

    o Alignment of practices to WGC’s Responsible                                                                                                          ESG score of 82/100; 18th out of
                                                                                                                         B     A      A-     A-
      Gold Mining Principles and Conflict-Free Gold                                                                                                        543 metals & mining companies
      Standard
                                                                                                                 3                                         Top 5 among gold companies;
                                                                                                                         F     F      F      B-
    o Responsible tailings management: support of                                                                                                          group average rating of C2
      Investor Mining & Tailings Safety Initiative

    o Top quartile ranking in Credit Suisse’s 2020
      Precious Metals ESG Scorecard1                                                                             Increased transparency driving positive rating trend;
    o Advancing Alamos’ Sustainability Performance                                                                       strong relative ESG performance
      Framework with 22 sustainability standards
      finalized to date

    o Improving ESG disclosure in support of the
      following frameworks:

1 2020 data sourced from Bloomberg and company reports
2 CDP score relates to the Climate Change Questionnaire
3 in 2018, 2019, and 2020, the Company was rated “F” as it did not complete CDP’s Climate Change Questionnaire                                                             TSX:AGI ǀ NYSE:AGI   6
Q4 & 2021 results – achieved full-year revised production & cost guidance
Revised 2021
Q4 2021A Q4 2020A 2021A 2020A
Guidance5
Gold production (000 oz) 112.5 120.4 457.2 426.8 455-495
457k oz
met revised full year production &
Gold sales (000 oz) 113.0 121.8 457.5 424.3 -
cost guidance
Average realized gold price (US$/oz) $1,798 $1,860 $1,800 $1,763 -
Cost of sales (US$/oz, includes amortization)1 $1,225 $1,115 $1,167 $1,136 -
Total cash costs (US$/oz)3 $843 $733 $794 $761 $790-810
$411M
record operating cash flow3 in 2021
All-in sustaining costs (US$/oz)2,3 $1,237 $1,030 $1,135 $1,046 $1,120-1,140
Operating revenues (US$M) $203 $227 $824 $748 -
Adjusted net earnings (US$M)3 $37 $58 $162 $157 - 4%
Adjusted earnings per share3 $0.09 $0.15 $0.41 $0.40 - increase in Mineral Reserves to
Cash provided by operations
$92 $127 $411 $383
10.3M oz6, including 5% increase
-
before changes in working capital (US$M)3 in grades
Cash flow per share3 $0.23 $0.32 $1.05 $0.98 -
Capital expenditures & capital advances (US$M)4
Mine-site free cash flow (US$M)3
$92
$6
$73
$67
$358
$57
$246
$169
$354-384
-
La Yaqui Grande
on track for commercial production
Consolidated free cash flow (US$M) 3 ($4) $58 ($2) $122 -
in Q3 2022
Cash & cash equivalents (US$M)5 - - $173 $221 -
1 Cost of sales includes mining and processing costs, royalties and amortization 4 Includes capitalized exploration of $8.2M in Q4/21, $4.0M in Q4/20, $27.0M for 2021, $12.8M for 2020
2 Total consolidated all-in sustaining costs include corporate and administrative and share based compensation expenses. 5 2021 guidance revised on October 27, 2021
For the purposes of calculating all-in sustaining costs at individual mine sites, the Company does not include corporate and 6 Proven & Probable Mineral Reserves total 10.3 million ounces of gold (202 mt at 1.58 g/t Au) as of December 31, 2021
administrative and share based compensation expenses
3 Please refer to Cautionary Notes on non-GAAP Measures and Additional GAAP Measures TSX:AGI ǀ NYSE:AGI 7
2022 guidance – stable production; temporary increase in costs

                                                                         2021A                         2022E

    Gold production (000 oz)                                               457                       440-480
                                                                                                                                                                                                                             440-480k oz
    Cost of sales (US$/oz, includes                                                                                                                                                                                        stable gold production YoY
                                                                        $1,167                        $1,325
    amortization)1

    Total cash costs (US$/oz)2                                            $794                      $875-925

                                                                                                                                                                           Sequencing
                                                                                                                                                          Efficiencies

                                                                                                                                                                                                  Inflation
                                                                                                                                                                                        Mulatos
    All-in sustaining costs (US$/oz)1,2                                 $1,135                  $1,190-1,240
                                                                                                                                                                                                                                      7%

                                                                                                                                           2021A

                                                                                                                                                                                                                2022E
    Capital expenditures and                                                                                                                                                                                            increase in AISC2,3 driven by cost
                                                                          $358                      $332-372
    advances (US$M)2,3
                                                                                                                                                                                                                         inflation & temporary increase
                                                                                                                                                                                                                                in costs at Mulatos
                                           2022 key catalysts

                          ✓ Mineral Reserve and Resource update
    Feb 2022
                                                                                                                                                                                                                         La Yaqui Grande
    Mid 2022                    Island Gold updated mine plan                                                                                                                                                           on track to achieve commercial
                                                                                                                                                                                                                        production & drive costs lower

                                                                                                                                                          Young-Davidson
    Q3 2022                     La Yaqui Grande commercial production
                                                                                                                                                                                                                               starting Q3 2022

                                                                                                                                                                                                  Island Gold
                                                                                                                                                                           Mulatos
    H2 2022                     Lynn Lake EIS approval & construction decision

                                                                                                                                                                                        Other
                                                                                                                                           2021A

                                                                                                                                                                                                                2022E
1 Total consolidated all-in sustaining costs include corporate and administrative and share based compensation expenses. For the purposes of calculating all-in
sustaining costs at individual mine sites, the Company does not include corporate and administrative and share based compensation expenses
2 Please refer to Cautionary Notes on non-GAAP Measures and Additional GAAP Measures
3 Total capital includes $27M of capitalized exploration in 2022E and $27M in 2021A                                                                                                                                                        TSX:AGI ǀ NYSE:AGI   8
Three-year outlook – expanding profitability

                    Gold production1 (000 oz)                                                     Total cash costs1,3 (US$/oz)                                        All-in sustaining costs1,2,3,4 (US$/oz)                                           Capital expenditures,
                                                                                                                                                                                                                                                      operating mines1,3,5 (US$M)
                                        460-500                460-500                                                                                                $1,190-1,240
                                                                                                                                                                                              $1,075-1,175
                440-480                                                                      $875-925                                                                                                                   $950-1,050                   $290-330
                                                                                                                     $775-875                                                                                                                                               $220-260                $230-270
                                                                                                                                             $650-750

                 2022E                   2023E                  2024E                          2022E                   2023E                    2024E                     2022E                    2023E                   2024E                       2022E                  2023E                   2024E

                                       4% increase                                                             22% decrease                                                                    18% decrease                                                                19% decrease
                                    from 2022 to 2024                                                          from 2022 to 2024                                                               from 2022 to 2024                                                           from 2022 to 2024

       Growing production                                                                                Declining costs                                                                                                          Declining capital
       • La Yaqui Grande to drive production                                                             • La Yaqui Grande to drive costs lower in 2023 & 2024                                                                    • 23% decrease in capital in 2023 with the
         higher in 2023                                                                                                                                                                                                             completion of La Yaqui Grande
                                                                                                         • Higher grades at Island Gold to further improve                                                                          construction
       • Higher grades at Island Gold to support                                                           2024 costs
         stable production into 2024

                     Further production growth & decrease in costs & capital following completion of Island Gold Phase III Expansion in 2025
1 Refer to the Company’s January 18, 2022 guidance press release for a summary of the key assumptions and related risks associated with the                3 Please refer to Cautionary Notes on non-GAAP Measures and Additional GAAP Measures
comprehensive 2022 guidance and three-year production, cost and capital outlook                                                                            4 All-insustaining cost guidance for 2023 and 2024 includes the same assumptions for G&A and stock-based compensation as included in 2022.
2 Total consolidated all-in sustaining costs include corporate and administrative and share based compensation expenses. For the purposes of calculating   5 Includes sustaining and growth capital guidance for producing mines and excludes capital for Lynn Lake and other development projects, and capitalized

all-in sustaining costs at individual mine sites, the Company does not include corporate and administrative and share based compensation expenses          exploration.                                                                                                                TSX:AGI ǀ NYSE:AGI             9
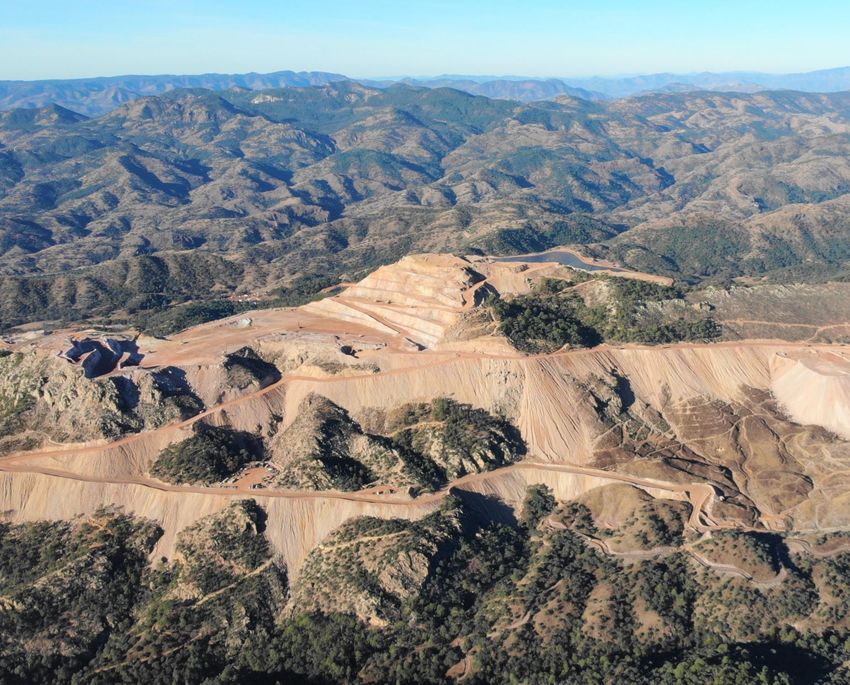
High quality, long-life production base; low geopolitical risk profile

                                                                              Young-Davidson, Ontario, Canada                                                                    Flagship operation with 15-year Mineral Reserve life3
                                                                              Underground                                                                                        o      One of Canada’s largest underground gold mines
                                                                              ❑ 2022E Au production: 185-200k oz                                                                 o      Completed lower mine expansion in 2020
                                                                              ❑ 2022E Mine-site AISC1,2: $1,125-1,175/oz                                                         o      Generated record mine-site FCF1 of $100M in 2021

                                                                              Island Gold, Ontario, Canada                                                                       Growing, high-grade, low-cost production
                                                                              Underground                                                                                        o       World’s sixth highest grade gold mine4
                                                                              ❑ 2022E Au production: 125-135k oz                                                                 o       Phase III expansion to drive ~70% production growth at lower costs
                                                                              ❑ 2022E Mine-site AISC1,2: $850-900/oz                                                             o       Significant upside potential through ongoing exploration success

                                                                              Mulatos (inc. LYG), Sonora, Mexico                                                                 Stable production; declining cost profile
                                                                              Open pit, heap leach                                                                               o       Produced >2M oz & generated ~$390M of FCF1 to date
                                                                              ❑ 2022E Au production: 130-145k oz                                                                 o       Declining cost profile with development of La Yaqui Grande
                                                                              ❑ 2022E Mine-site AISC1,2: $1,325-1,375/oz                                                         o       La Yaqui Grande on track for commercial production Q3 2022

1 Please  refer to Cautionary Notes on non-GAAP Measures and Additional GAAP Measures                                                                     3 Mineral   Reserve life based on Mineral Reserves as of December 31, 2021
2Total consolidated all-in sustaining costs include corporate and administrative and share based compensation expenses. For the purposes of calculating   4 Source:   Mines and Metals, July 13, 2020; based on reserve grade for deposits containing reserves of more than 1M oz
all-in sustaining costs at individual mine sites, the Company does not include corporate and administrative and share based compensation expenses                                                                                                                                   TSX:AGI ǀ NYSE:AGI   10
High-return organic growth in safe jurisdictions
Island Gold Phase III Expansion La Yaqui Grande (Mulatos) Lynn Lake
Ontario, Canada Sonora, Mexico Manitoba, Canada
IRR1,2: 17% IRR1,2: 22% IRR3: 41% IRR3: 58% IRR4: 13% IRR4: 22%
NPV5% 1: $1.02B NPV5% 1: $1.45B NPV5% 3: $165M NPV5% 3: $260M NPV5% 4: $123M NPV5% 4: $290M
@$1,450/oz Au @$1,750/oz Au @$1,450/oz Au @$1,750/oz Au @$1,250/oz Au @$1,500/oz Au
❑ Expansion to drive ~70% production ❑ Low-cost, high return project with ❑ High-grade, open pit with attractive
growth at industry low costs in 2025 initial production on track for Q3 2022 exploration upside
2022 milestones 2022 milestones 2022 milestones
• Updated mine plan mid-2022 • Commercial production in Q3 • Environmental Impact Statement
• Completion of permitting for start of approval in H2
major construction activities in H1 • Construction decision H2
• Shaft pre-sink to commence in H2
1NPV and IRR are calculated for life of mine starting January 2020. See press release dated July 14, 2020. 3 See La Yaqui Grande construction decision press release dated July 28, 2020 for more details. Base case assumptions for
2IRR is calculated on the differential after-tax cash flow between the Shaft Expansion scenario and the base case of gold and silver price were $1,450 and $18 per ounce, respectively
continuing to mine at 1,200 tpd with ramp only access 4 See Lynn Lake Dec. 2017 feasibility study as detailed in press release dated Dec. 14, 2017 for more details. Base case
TSX:AGI ǀ NYSE:AGI 11
assumptions for gold & silver price were $1,250/oz & $16/ozIsland Gold – Phase III Shaft Expansion to 2,000 tpd
Shaft Expansion production & cost profile 4
• Expansion to drive ~70% production growth at industry low costs 350,000 $1,000
• 236k oz/yr at mine-site AISC4 of $534/oz starting in 2025 300,000 $900
• Significant upside potential to Phase III expansion study $800
Mine-site AISC (US$/oz)
250,000
Gold Production (oz)
• 1.4m oz of Mineral Reserves & Resources7 added since Phase III study $700
200,000
• Strong ongoing exploration success $600
150,000
• Phase III expansion updated mine plan expected mid-2022 $500
100,000
$400
50,000 $300
Phase III Expansion Operating Parameters & Economics6 - $200
Average annual production (000 oz)5 236
4
Gold Production (oz) Mine-site AISC (US$/oz)
Average mine-site AISC (US$/oz)4,5 $534
Growth capital (US$M) $514
Gold price assumption (US$/oz) $1,450 $1,750 $1.45B
Average annual free cash flow (US$M)4,5 $170 $210 NPV5% & 22% IRR (after-tax; $1,750/oz Au)1,2,6
After-tax NPV5% (US$M)1 $1,019 $1,450
After-tax IRR1,2 17% 22%
$624M
1 NPV and IRR are calculated for life of mine starting January 2020
2 IRR is calculated on the differential after-tax cash flow between the Shaft Expansion scenario and the base case of continuing to mine at 1,200 tpd with ramp only access
3 Acquisition cost based on the value of Richmont Mines on closing ($627 million), net of $58 million in cash on its balance sheet. Royalty repurchase totaled $55 million
4 Please refer to Cautionary Notes on non-GAAP Measures and Additional GAAP Measures
combined 2017 acquisition cost & 2020 royalty repurchase3
5 Annual averages are post completion of Shaft Expansion in 2025.
6 Foreign exchange rate of US$/C$ is assumed to be 0.75:1
7 See Mineral Reserve and Resource estimates and associated footnotes in appendix TSX:AGI ǀ NYSE:AGI 12Island Gold – ongoing exploration success driving growth in size & quality
Reserve & Resource growth since 2017 acquisition Changes in Reserves & Resources as of December 31, 2021
Mineral Reserves
M&I Mineral Resources
Inferred Mineral Resources
Mineral Reserve grade
Inferred Resource grade
16
5,000
Cumulative oz produced
4,500
14
4,000
3,500 12
3,454
3,000 3,208
10
Grade (g/t Au)
2,500 2,298
2,000 1,573
koz Au
8
1,500 908 166 286
996 184
1,000 196 6
111
91 1,338
1,215 1,310
500 887 1,007
752
4
-
457 556 662
(500) 812 951 1,092 2
(1,000)
(1,500) 0
2016 2017 2018 2019 2020 2021 2
Mineral Reserve &
Resource included in
Phase III Study
5.1M oz 1.4M oz >90% $12/oz
total Mineral Reserves & Resources2, a increase in Mineral Reserves & Resources conversion rate of Inferred Discovery cost over past
176% increase since 2017 acquisition since 2020 Phase III Expansion Study Mineral Resources to Reserves3 four years
1 See Mineral Reserve and Resource estimates and associated footnotes in appendix
2 IncludesProven & Probable Mineral Reserves of 1.3m oz (4.1 mt at 10.12 g/t Au), Measured & Indicated Mineral Resources of 286,000 oz (1.1 mt at 8.12 g/t Au) & Inferred Mineral Resources of 3.5m oz (7.9 mt at 13.59 g/t Au)
3 Since completion of acquisition of Island Gold in November 2017 TSX:AGI ǀ NYSE:AGI 13La Yaqui Grande Project – low-cost production on track for Q3 2022
La Yaqui Phase I Cerro Pelon La Yaqui Grande
2017-2019 2019-2021 2022+
• Development on track
• Commercial production expected
Q3 2022
• Expected to drive Mulatos costs
steadily lower starting H2/22
Initial capital: $13M Initial capital: $25M La Yaqui Grande
Average annual production (000 oz)2 123
Cumulative FCF1: $40M Cumulative FCF1,3: $107M Average mine-site AISC (US$/oz)1,2 $578
Initial capital (US$M)2 $137
Total production: 61k oz Total production3: 127k oz
Total LOM capital (US$M)2 $196
Gold price assumption (US$/oz) $1,450 $1,750
Strong track record of discovering & developing After-tax NPV5% (US$M)1,2 $165 $260
low-cost, high-return projects within Mulatos District After-tax IRR 1,2 41% 58%
1 Please refer to Cautionary Notes on non-GAAP Measures and Additional GAAP Measures
2 See La Yaqui Grande construction decision press release dated July 28, 2020 for more details. Base case assumptions for gold and silver price were $1,450 and $18 per ounce, respectively
3 Cerro Pelon cumulative free cash flow and production as of December 2021 TSX:AGI ǀ NYSE:AGI 14Lynn Lake Project – low cost, high-grade, open pit
• Favourable jurisdiction: Manitoba, Canada
• Significant exploration potential across large land package (58,000 ha)
• Mineral Reserves increased 27% to 2.1M oz3,4 since 2017 Feasibility Study
• Tulune greenfields discovery indicative of upside potential
• Indigenous community engagement underway
• Environmental Impact Statement approval expected H2 2022 with
construction decision to follow
Gold Price (US$/oz) After-Tax NPV5% ($M)1 After-Tax IRR (%)1
170k oz $745/oz
$1,250 $123 12.5%
Average annual production
Average LOM mine-site
$1,400 $223 18.0% over initial six years;143k oz
AISC1,2
average over 10 year life1
$1,500 $290 21.5%
$1,750 $441 28.8%
$338M 22%
Initial capital; $486M total After-tax IRR at $1,500/oz
$1,950 $572 34.8% LOM capital1 gold price2
1 See Lynn Lake Dec. 2017 feasibility study as detailed in press release dated Dec. 14, 2017 for more details. Base case assumptions for gold & silver price were $1,250/oz & $16/oz
2 Pleaserefer to Cautionary Notes on non-GAAP Measures and Additional GAAP Measures
3 See Mineral Reserve and Resource estimates and associated footnotes in appendix
4 Proven & Probable Mineral Reserves totaled 1.6m oz (26.8 mt at 1.89 g/t Au) as of Dec. 1, 2017 and 2.1m oz (36.5 mt at 1.75 g/t Au) as of Dec. 31, 2021 TSX:AGI ǀ NYSE:AGI 15Growing, long-life North American production; declining cost profile
Fully funded internal growth ~750k oz annual production potential by 2025 at ~$800/oz AISC1
$1,135 $1,215
$1,125
800 $1,000
700 Lynn Lake3
$800
13 year reserve life2
Production (000 oz Au)
600
500 460 - 500 460 - 500 Mulatos
457 440 - 480
6 year reserve life2,4
400
Island Gold
300
14 year mine life2
200
100
Young-Davidson
15 year reserve life2
0
2021A 2022E 2023E 2024E 2025E
1
All-in sustaining costs (US$/oz)
1 Please refer to Cautionary Notes on non-GAAP Measures and Additional GAAP Measures
2 Mineral Reserve life based on Mineral Reserves as of December 31, 2021. Island Gold mine life based on Phase III Expansion Study. See Mineral Reserve and Resource estimates and associated footnotes in appendix
3 For more detail on Lynn Lake project, see press release dated December 14, 2017
4 Mulatos Mineral Reserve life excluding Puerto Del Aire TSX:AGI ǀ NYSE:AGI 16Strong balance sheet; long-term focus on returning capital to shareholders
Cash & Total Liquidity
Conservative balance sheet $173M
zero debt, well positioned for all market conditions
1,2,3
$673M
$173M Fully funded
$500M
Cash & $673 total liquidity1,2,3 organic growth
Undrawn Credit Facility Cash & cash equivalents
As of December 31, 2021
Long-term track record of returning capital to shareholders
$0.02 $0.02 Dividends per share 67%
Share buybacks per share 4 increase in dividend since Sept
US$ per share
2020
$0.03
$0.20 $0.20 $0.20
$0.01
$0.07
$0.12 $0.03
$0.07
$0.10 $238M
$0.04 $0.04
$0.02 $0.02 $0.02 returned to shareholders through
2010 2011 2012 2013 2014 2015 2016 2017 2018 2019 2020 2021 5 dividends & buybacks
1 As of December 31, 2021 4 Calculated as total dollar amount invested in share buybacks divided by average shares outstanding over the period
2 Cash & cash equivalents as of December 31, 2021 5 2021 dividend based on quarterly dividend rate of $0.025 per share
3 Total liquidity includes cash, and cash equivalents as of December 31, 2021, and undrawn $500m credit facility TSX:AGI ǀ NYSE:AGI 17Track record of adding value through M&A & exploration
Mulatos (US$M) Young-Davidson (US$M) Island Gold (US$M)
$236
$147
$390 $1,190 $1,390
$950
$436 $624
$10
Acquisition Cost Consensus NAV & Acquisition Cost (2015) Consensus NAV & Acquisition Cost (2017) Consensus NAV &
3
(2003) Cumulative FCF Cumulative FCF & Royalty Repurchase Cumulative FCF
(2020)
Acquisition Cost Consensus NAV1 Cumulative FCF2
Countercyclical approach to M&A
2,000
Island Gold
1,600
1,200
800
Mulatos
Young Davidson
400
0
2000 2002 2004 2006 2008 2010 2012 2014 2016 2018 2020 2022
Gold price (US$/oz) 4
1 Based on consensus analyst net asset value (NAV) estimates
2 Cumulative free cash flow (FCF) generated since acquisition as of Q4 2021. Please refer to Cautionary Notes on non-GAAP Measures and Additional GAAP Measures
3 Acquisition cost based on the value of Richmont Mines on closing ($627 million), net of $58 million in cash on its balance sheet. Royalty repurchase totaled $55 million
4 Source: Factset TSX:AGI ǀ NYSE:AGI 18Track record of adding value on aggregate & per share basis
Gold Production (000 oz Au) Mineral Reserves (M oz Au) Cash provided by operations
before changes in WC (US$M)
+226% 457
+506% 10.3
+706%
$411
140
1.7
$51
1 2,3
2014A 2021A 2014A 2021A 2014A 2021A
Gold Production Per Share Gold Reserves Per Share Cash Flow Per Share
(000 oz) (000 oz) (US$, basic)
+5% 1.16 +92% 26.12 +163%
$1.05
13.60
1.10
$0.40
2014A 2021A 2014A 2021A 1 2014A 2021A 2,3
1 See Mineral Reserve and Resource estimates and associated footnotes in appendix
2 Please refer to Cautionary Notes on non-GAAP Measures and Additional GAAP Measures TSX:AGI ǀ NYSE:AGI 19Long-term track record of delivering shareholder value
Long-term track record of
outperformance
2
Average annualized return since 2003 1 1.72 Consensus P/NAV
12%
1.31 1.30 1.27
1.24
9% 1.05
0.99 0.99 0.97 0.97
0.90 0.88
0.80 0.76
0.74 0.72
0.62 0.59
3%
CG
EQX
BTO
IMG
ABX
K
NGD
AGI
NEM
AEM
PAAS
Int Average
SSRM
YRI
OGC
Sr Average
ELD
Average
AGI (TSX) S&P/TSX Global Gold Gold (US$/oz)
Index
Strong outlook;
compelling valuation opportunity
1 As of February 23, 2022
2 Source: Factset consensus estimates as of February 23, 2022. Intermediate average includes BTO, CG, ELD , EQX, IMG, NGD, OGC, PAAS, SSRM, YRI TSX:AGI ǀ NYSE:AGI 20Alamos – value creation opportunities
Growing, diversified, Expanding margins & Conservative, low- Sustainable business
intermediate gold profitability risk strategy model supporting
producer growing returns over
the long-term
Catalysts
✓ Mineral Reserve and Resource update February 2022
o Island Gold Phase III Expansion mine plan update mid 2022
o La Yaqui Grande commercial production Q3 2022
o Lynn Lake EIS approval & construction decision H2 2022
o ~65% growth potential to ~750k oz by 2025
o ~30% reduction in AISC1 to ~$800/oz by 2025
1 Please refer to Cautionary Notes on non-GAAP Measures and Additional GAAP Measures TSX:AGI ǀ NYSE:AGI 21Appendices
TSX:AGI ǀ NYSE:AGI 22Board of Directors, Executive and Management Team
Board of Directors
Paul J. Murphy John A. McCluskey Elaine Ellingham David Fleck David Gower Claire M. C. Kennedy Monique Mercier J. Robert S. Prichard Kenneth Stowe
Chairman Director Director Director Director Director Director Director Director
Executive and Management Team
John A. McCluskey Jamie Porter Peter MacPhail Chris Bostwick Luis Chavez Nils Engelstad Greg Fisher
President and CEO Chief Financial Officer Chief Operating Officer SVP, Technical Services SVP, Mexico SVP, General Counsel SVP, Finance
Christine Barwell Khalid Elhaj John Fitzgerald Luc Guimond Scott K. Parsons Scott R.G. Parsons Adrian Paulse Rebecca Thompson Colin Webster
VP, Information VP, Sustainability & External
VP, Human Resources VP, Business Strategy VP, Projects VP, Operations VP, Investor Relations VP, Exploration VP, Public Affairs Affairs
Technology TSX:AGI ǀ NYSE:AGI 232022 guidance
2022 Guidance 2021A
Young-Davidson Island Gold Mulatos Other Total Total
Gold production (000 oz) 185-200 125-135 130-145 — 440-480 457
Cost of sales (US$M) (3) — — — — $610 $534
Cost of sales (US$/oz) (3) — — — — $1,325 $1,167
Total cash costs (US$/oz) (1) $850-900 $550-600 $1,225-1,275 — $875-925 $794
All-in sustaining costs (US$/oz) (1) — — — — $1,190-1,240 $1,135
Mine-site all-in sustaining costs (US$/oz) (1),(2) $1,125-1,175 $850-900 $1,325-1,375 — — —
Amortization costs (US$/oz) (1) — — — — $425 $374
Corporate & Administrative (US$M) — — — — $25 $25
Capital expenditures (US$M)
Sustaining capital(1) $50-55 $35-40 $5-10 — $90-105 $113
Growth capital(1) $5-10 $145-160 $50-55 $15 $215-240 $218
Total sustaining & growth capital(1) $55-65 $180-200 $55-65 $15 $305-345 $331
Capitalized exploration(1) $4 $20 — $3 $27 $27
Total capital expenditures(1) $59-69 $200-220 $55-65 $18 $332-372 $358
1 Pleaserefer to Cautionary Notes on non-GAAP Measures and Additional GAAP Measures.
2 Forthe purposes of calculating mine-site all-in sustaining costs at individual mine sites, the Company does not include an allocation of corporate and administrative and share based compensation expenses to the mine sites.
3 Costof sales includes mining and processing costs, royalties, and amortization expense, and is calculated based on the mid-point of total cash cost guidance.
4 2021 guidance revised on October 27, 2021 TSX:AGI ǀ NYSE:AGI 242022 guidance: capital budget
2022 Guidance 2021A2
Sustaining Capital Growth Capital Total Total
Operating Mines (US$M)
Young-Davidson $50-55 $5-10 $55-65 $82
Island Gold $35-40 $145-160 $180-200 $101
Mulatos $5-10 $50-55 $55-65 $127
Total – Operating Mines $90-105 $200-225 $290-330 $310
Development Projects (US$M)
Lynn Lake — $11 $11 $6
Other — $4 $4 $7
Total – Development Projects — $15 $15 $13
Capitalized Exploration (US$M)
Young-Davidson — $4 $4 $7
Island Gold — $20 $20 $19
Mulatos — - - $2
Lynn Lake — $3 $3 $8
Total – Capitalized Exploration — $27 $27 $35
Total Consolidated Budget $90-105 $242-267 $332-372 $358
1 Please refer to Cautionary Notes on non-GAAP Measures and Additional GAAP Measures
2 Capital includes capital advances TSX:AGI ǀ NYSE:AGI 252022 - 2024 guidance: operating mines1
2022 2023 2024
Gold Production (000 oz)
Young-Davidson 185-200 185-200 185-200
Island Gold 125-135 115-125 140-155
Mulatos 130-145 160-175 135-145
Total Gold Production 440-480 460-500 460-500
Total cash costs (US$/oz) (2) $875-925 $775-875 $650-750
All-in sustaining costs (US$/oz) (2),(3) $1,190-1,240 $1,075-1,175 $950-1,050
Capital expenditures (US$M)
Sustaining capital(2),(4) $90-105 $95-110 $95-110
Growth capital(2),(4) $200-225 $125-150 $135-160
Total sustaining & growth capital(2),(4)
$290-330 $220-260 $230-270
(Operating mines; ex. exploration)
1 Refer to the Company’s January 18, 2022 guidance press release for a summary of the key assumptions and related risks associated with the comprehensive 2022 guidance and three-year production, cost and capital outlook.
2 Please refer to Cautionary Notes on non-GAAP Measures and Additional GAAP Measures.
3 All-in sustaining cost guidance for 2023 and 2024 includes the same assumption for G&A and stock based compensation as included in 2022.
4 Sustaining and growth capital guidance is for producing mines and excludes capital for Lynn Lake and other development projects, and capitalized exploration.
5 2023 and 2024 Cost of sales guidance has not been provided given amortization charges are based on reserves and resources at the end of each of these years and cannot be reasonably estimated at this time. TSX:AGI ǀ NYSE:AGI 26COVID-19 – focused on the health & safety of our people & communities
Strict health & safety protocols at each operation Supporting our communities
• We continue to be diligent in taking precautions to
help prevent the potential spread of COVID-19
• All operations have returned to normal operating
levels under strict health & safety protocols
• On-site testing for COVID-19 implemented at all
operations; performed >115,000 tests to date
• Our teams in Canada, Mexico, and Turkey have
donated their time, medical equipment & supplies,
food & funds to support:
• Hospitals & medical clinics
• Frontline workers
COVID-19 testing facility at Island Gold
• Vulnerable members of our communities
TSX:AGI ǀ NYSE:AGI 27Young-Davidson – flagship, long-life production
Location: Ontario, Canada Stage: Producing
Ownership: 100% interest Operation: Underground
• One of Canada’s largest underground gold mines
• 15 year mine life based on YE 2021 Mineral Reserves
• Large resource base & exploration potential to support mine life extension
• Significant Canadian dollar exposure; ~95% of costs
2020A 2021A 2022E
Total capital (US$M) 6
Gold Production (k oz) 136 195 185-200
Operating cash flow (US$M) 2
Cost of Sales1 (US$/oz) $1,491 $1,254 -
Mine-site free cash flow (US$M)2
Total Cash Costs2 (US$/oz) $1,019 $846 $850-900 $189
Mine-site AISC2 (US$/oz) $1,214 $1,072 $1,125-1,175
Total Capital4,5 (US$M) $102 $82 $55-65 $114 $113
Exploration Spending5 (US$M) - $7 $5 $99 $98 $101 $100
Mine-site FCF2 (US$M) $0 $100 -
$34
Tonnes Grade oz Au $4 $11 $13
Gold Reserves & Resources3
(000) (g/t Au) (000)
$0
P&P Mineral Reserves 43,690 2.42 3,394
M&I Mineral Resources 8,815 3.30 936
-$80 -$87 -$89
-$95 -$100 -$102
Inferred Mineral Resources 2,093 2.99 201
2016A 2017A 2018A 2019A 2020A 2021A
1 Cost of sales includes mining and processing costs, royalties and amortization 4 Total capital excludes capitalized exploration
2 Please refer to Cautionary Notes on non-GAAP Measures and Additional GAAP Measures 5 Exploration spending in 2021 was $7.2M, of which $6.5M was capitalized. Guidance of $5M in 2022, $4M of which is capitalized.
3 See Mineral Reserve and Resource estimates and associated footnotes in appendix 6 Includes capitalized exploration TSX:AGI ǀ NYSE:AGI 28Young-Davidson – transition to lower mine infrastructure completed July 2020
Lower mine infrastructure larger,
more productive & highly
automated
Upper mine
infrastructure
Upper mine Lower mine %
infrastructure infrastructure Change
Long term – July
Timeline Pre-July 2020
2020 onward
Design ore
6,000 tpd 8,000 tpd +33%
capacity
Skip capacity 17.5t 24.5t +40%
Fine ore bin
500t 6,000t +1,100%
capacity
Lateral material
Trucking Conveying
handling
Avg. stope size 24kt 37kt +54%
Lower mine infrastructure
TSX:AGI ǀ NYSE:AGI 29Young-Davidson 2021 exploration drilling – significant potential
o 2021 marks first significant exploration
program at YD since 2011
o Mineralization open at depth, along strike
to west
o Combined 13,000 m of underground
exploration drilling from drill platforms in
the mid-mine and lower mine
o 4,500 m of surface exploration drilling in
H2/21
TSX:AGI ǀ NYSE:AGI 30Young-Davidson exploration drilling – extending gold mineralization within syenite
Detailed Longitudinal – 8960L drilling
o Gold mineralization intersected within
syenite 220 m below previous Mineral
Resources in 2020 and extended an
additional 150 m below Inferred Mineral
Resources in 2021 YTD
o High-grade mineralization intersected
200 m outside of the syenite in the hanging
wall and 100 m from syenite contact in the
footwall
TSX:AGI ǀ NYSE:AGI 31Young-Davidson – increasing mining rates & productivity
Q3/16 Q4/16 Q1/17 Q2/17 Q3/17 Q4/17 Q1/18 Q2/18 Q3/18 Q4/18 Q1/19 Q2/19 Q3/19 Q4/19 Q1/20 Q2/20 Q3/20 Q4/20 Q1/21 Q2/21 Q3/21 Q4/21
Gold production (oz) 43,629 44,662 40,400 47,300 55,800 56,500 41,000 39,100 49,000 50,900 45,000 45,000 50,000 48,000 28,700 23,100 36,400 48,000 48,000 45,100 50,000 51,900
Cost of sales1 (US$/oz) $1,032 $1,077 $1,148 $1,113 $966 $1,107 $1,273 $1,350 $1,276 $1,184 $1,293 $1,278 $1,191 $1,149 $1,515 $2,059 $1,421 $1,264 $1,291 $1,354 $1,203 $1,181
Total cash costs (US$/oz) 2,3 $607 $667 $710 $677 $572 $690 $824 $890 $824 $764 $839 $822 $781 $766 $1,093 $1,564 $923 $792 $873 $941 $810 $775
Mine-site AISC (US$/oz) 2,3 $849 $926 $851 $895 $744 $859 $994 $1,083 $1,029 $974 $1,068 $1,077 $960 $1,083 $1,242 $1,809 $1,196 $934 $1,075 $1,157 $1,051 $1,017
Underground mine
Tonnes mined per day 5,467 6,675 6,400 6,377 6,544 7,227 6,501 6,087 6,005 6,402 6,540 6,728 6,606 7,000 4,290 2,686 6,713 7,651 7,791 7,504 8,017 8,240
Grades (g/t) 2.82 2.40 2.56 2.60 2.89 2.70 2.35 2.35 2.59 2.71 2.54 2.42 2.62 2.65 2.17 2.50 2.24 2.20 2.25 2.22 2.30 2.47
Development metres 2,677 3,044 3,242 3,425 3,344 2,776 3,144 3,079 2,811 2,975 2,900 2,877 2,817 2,925 3,202 2,894 3,231 3,223 3,352 2,868 3,031 3,116
Unit UG mining costs (US$/t) $34 $32 $36 $33 $34 $34 $43 $41 $41 $38 $39 $40 $39 $39 $57 $82 $34 $34 $38 $40 $35 $33
Unit UG mining costs (CAD$/t) $45 $42 $47 $44 $43 $44 $54 $53 $54 $51 $52 $53 $51 $51 $77 $114 $45 $44 $48 $49 $44 $42
Mill processing facility
Tonnes processed per day 6,833 7,552 7,718 6,917 7,553 7,786 7,437 6,574 7,293 8,104 6,777 7,516 7,124 6,761 5,107 4,344 6,430 7,932 8,147 7,562 8,029 7,861
Grades (inc. OP stockpile) 2.37 2.18 2.18 2.45 2.65 2.59 2.22 2.17 2.43 2.39 2.47 2.26 2.48 2.65 1.93 1.85 2.19 2.21 2.23 2.22 2.30 2.47
Recoveries (%) 93% 90% 89% 92% 93% 92% 90% 92% 93% 92% 90% 91% 92% 92% 91% 93% 93% 91% 91% 92% 92% 91%
1 Cost of sales includes mining and processing costs, royalties and amortization
2 Please refer to Cautionary Notes on non-GAAP Measures and Additional GAAP Measures
3 Excludes Net Realizable Value (“NRV”) inventory adjustments. See associated MD&A for a full reconciliation TSX:AGI ǀ NYSE:AGI 32Island Gold – high-grade, low-cost production
Location: Ontario, Canada Stage: Producing
Ownership: 100% interest Operation: Underground
• World’s sixth highest grade gold mine1
• Phase III Shaft Expansion to 2,000 tpd expected to be completed 2025
• Significant exploration potential laterally & at depth
2020A 2021A 2022E
Gold Production (k oz) 139 141 125-135 7
Cost of Sales2 (US$/oz) $801 $802 - Total capital (US$M)
Total Cash Costs3 (US$/oz) $451 $529 $550-600 Operating cash flow (US$M) 3
Mine-site AISC3 (US$/oz) $660 $863 $850-900 Mine-site free cash flow (US$M)
3
Total Capital4 (US$M) $69 $101 $180-200 $182 $173
Exploration Spending5 (US$M) $13 $24 $22 $133
$101
Mine-site FCF3 (US$M) $101 $53 - $76
$59 $65 $53
$41 $26
Tonnes Grade oz Au $10
Gold Reserves & Resources6
(000) (g/t Au) (000)
P&P Mineral Reserves 4,112 10.12 1,338 -$2
-$43 -$33
M&I Mineral Resources 1,096 8.12 286 -$66 -$69 -$81
Inferred Mineral Resources 7,906 13.59 3,454 -$120
8
2016A 2017A 2018A 2019A 2020A 2021A
1 Source: Mines and Metals, July 13, 2020; based on reserve grade for deposits containing reserves of more than 1M oz 5 Exploration spending: 2021 totaled $23.5M, of which $18.8M was capitalized; 2022 guidance of $22M includes $20M of capitalized exploration
2 Cost of sales includes mining and processing costs, royalties and amortization 6 See Mineral Reserve and Resource estimates and associated footnotes in appendix
3 Please refer to Cautionary Notes on non-GAAP Measures and Additional GAAP Measures 7 Includes capitalized exploration
4 Includes capital advances; excludes capitalized exploration 8 Total capital includes $1.4M of capital advances in 2021 TSX:AGI ǀ NYSE:AGI 33One of Canada’s highest-grade gold mines
Mineral Reserve Grade (g/t Au)
21.9
+58%
13.4
10.1 9.8
9.2
8.4
6.9 6.5 6.4 6.3 5.9
5.1 5.0 4.9
4.4 4.1
3.0
2.4
1.6
Source: Company filings
TSX:AGI ǀ NYSE:AGI 34Island Gold Shaft Expansion – cash flow profile at $1,450/oz Au
$270 $266
$244
$229 $229 $223
$202 $188
$179 $173
$174 $173 $153
$150 $151 $161 $160 $152
$134 $136 $132 $131
$122 $117
$103 $68
$56 $68
$12
-$1
-$14 -$15
-$40 -$42 -$35 -$30
-$54 -$59 -$47 -$52 -$48
-$65
-$77
-$124
-$162 -$169
-$186
2020 2021 2022 2023 2024 2025 2026 2027 2028 2029 2030 2031 2032 2033 2034 2035
Total capital (US$M) Operating cash flow (US$M) After-tax mine-site free cash flow (US$M)
• Modest investment required at $1,450/oz Au4
• Spending on long lead items starting in 2021
• $170M average annual after-tax FCF4 starting in 2025 (post project3)
1 Pleaserefer to Cautionary Notes on non-GAAP Measures and Additional GAAP Measures.
2 LOM capital is from January 1, 2020 onward
3 Annual average post completion of the shaft expansion in 2025
4 Based on an assumed US$/C$ foreign exchange rate of 0.75:1 TSX:AGI ǀ NYSE:AGI 35Island Gold Shaft Expansion – cash flow profile at $1,750/oz Au
$332
$301 $302 $291
$253 $251 $239
$236 $196
$214 $220
$207 $223
$203 $192 $204 $195
$175 $177 $172 $173
$161 $162 $156
$137 $86
$98 $86
$52
-$15 -$9 -$14 -$15 -$1
-$26 -$40 -$35 -$30
-$52 -$48 -$42
-$77 -$65
-$124
-$162 -$169
-$186
2020 2021 2022 2023 2024 2025 2026 2027 2028 2029 2030 2031 2032 2033 2034 2035
Total capital (US$M) Operating cash flow (US$M) After-tax mine-site free cash flow (US$M)
• Self-financed at $1,750/oz Au4
• $210M average annual after-tax FCF4 starting in 2025 (post project3)
1 Pleaserefer to Cautionary Notes on non-GAAP Measures and Additional GAAP Measures.
2 LOM capital is from January 1, 2020 onward
3 Annual average post completion of the shaft expansion in 2025
4 Based on an assumed US$/C$ foreign exchange rate of 0.75:1 TSX:AGI ǀ NYSE:AGI 36Island Gold Shaft Expansion – detailed mine plan
2021 2022 2023 2024 2025 2026 2027 2028 2029 2030 2031 2032 2033 2034 2035
Mill Feed mined (tonnes) 438,000 437,999 437,994 439,198 557,150 719,805 730,000 731,957 729,934 729,951 730,000 731,947 730,000 721,154 296,654
Waste mined (tonnes) 440,063 611,313 688,082 478,034 317,066 336,839 471,093 414,888 371,636 255,838 190,337 32,774 571 - -
Total tonnes mined 878,063 1,049,312 1,126,076 917,233 874,216 1,056,643 1,201,093 1,146,845 1,101,570 985,789 920,337 764,721 730,571 721,154 296,654
Grades (g/t Au) 10.17 9.85 8.37 9.70 13.08 11.41 9.22 10.62 13.91 8.81 9.37 10.32 11.09 9.60 9.77
Gold production (oz) 138,231 133,802 113,743 132,131 226,081 254,866 208,849 241,279 314,971 199,445 212,271 234,370 251,179 214,715 89,925
Operating costs
Unit mining costs (C$/tonne) $103 $96 $97 $115 $108 $96 $84 $87 $91 $95 $95 $103 $103 $101 $92
Unit milling costs (C$/tonne) $33 $33 $33 $34 $33 $30 $30 $30 $30 $30 $30 $30 $30 $30 $33
Unit G&A costs (C$/tonne) $47 $47 $46 $48 $42 $36 $33 $34 $34 $35 $36 $39 $39 $39 $43
Total unit operating costs 2 (C$/tonne) $195 $188 $188 $211 $200 $177 $159 $165 $175 $173 $174 $187 $187 $183 $179
Total cash costs (US$/oz) 1,3 $464 $460 $542 $527 $370 $375 $418 $375 $304 $475 $449 $438 $408 $460 $442
Mine-site AISC (US$/oz) 1,3 $771 $818 $941 $899 $566 $531 $668 $573 $437 $651 $592 $497 $469 $465 $442
Capital expenditures
Sustaining capex (US$M)3 $43 $48 $45 $49 $44 $40 $52 $48 $42 $35 $30 $14 $15 $1 $0
Growth capex (US$M) 3 $82 $139 $117 $120 $21 $0 $0 $0 $0 $0 $0 $0 $0 $0 $0
1 Pleaserefer to Cautionary Notes on non-GAAP Measures and Additional GAAP Measures.
2 Total
unit operating costs are inclusive of royalties and silver credits which average a combined C$14/tonne over the life of mine
3 Based on an assumed US$/C$ foreign exchange rate of 0.75:1 TSX:AGI ǀ NYSE:AGI 37You can also read