COVID-19 BCG Perspectives - Facts, scenarios, and actions for leaders
←
→
Page content transcription
If your browser does not render page correctly, please read the page content below
COVID-19

                                                                   Copyright © 2020 by Boston Consulting Group. All rights reserved. Updated 24 April 2020 Version 3.1.
BCG Perspectives
Facts, scenarios, and actions for leaders
Publication #3 with a focus on Emerging Stronger from the Crisis

Version: 24 April 2020
COVID-19
       BCG Perspectives
       Objectives of this document

                                                                                                                                   Copyright © 2020 by Boston Consulting Group. All rights reserved. Updated 24 April 2020 Version 3.1.
       COVID-19 is a global                                      Leaders need to drive an integrated
       societal crisis                                           response to navigate the crisis

       We at BCG believe that the COVID-19 outbreak is           It is the duty of health, political, societal, and business
       first and foremost a societal crisis, threatening lives   leaders to navigate through this crisis. A complex
       and the wellbeing of our global community. Society        interplay of epidemic progression, medical response,
       now, more than ever, needs to collaborate to protect      government action, sector impact, and company action
       people's lives and health, manage mid-term                is playing out. This document intends to help leaders
       implications, and search for lasting solutions.           find answers and shape opinions to navigate the crisis
                                                                 in their own environments. It encourages thinking
                                                                 across the multiple time horizons over which we see
                                                                 the crisis manifesting itself.

Source: BCG                                                                                                                    1
Executive Summary | COVID-19 BCG Perspectives

Many countries are starting to establish preconditions for a controlled restart, as COVID-19 continues to be a global challenge to societies
• Governments' actions and societal adherence continue to deliver results in flattening the curve; allowing us to consider relaxation of lockdowns
• However, health care capacity (e.g. masks) and testing (e.g. currently unreliable serology) remain major issues
• Business preparation (e.g. health protocols; workplace safety) and public response (e.g. revised social norms) are key to ensure a sustainable transition

Impact on economy, sectors, and business remains severe in 2020; rebound to pre-crisis levels not expected by end of 2021
• Length of 'Fight' phase dependent on many unknowns; accelerated movement toward vaccine or treatment at scale could limit 'Fight' phase to 12-24

                                                                                                                                                              Copyright © 2020 by Boston Consulting Group. All rights reserved. Updated 24 April 2020 Version 3.1.
  months; data from therapeutics will emerge in a few months—drugs likely to reduce severity of infection
• Estimating the economic, sector, and business impact requires scenario-thinking to navigate the crisis
• Current consumer sentiment suggests some willingness to resume activities post lockdown but not to pre-crisis levels (even with treatment)
• Economic forecasts point to severe downturn in 2020—global rebound to pre-COVID levels not expected before 2021
• Total shareholder returns (TSR) have rebounded over the last 20 days, most sectors still hit; there are clear winners even in hard hit sectors

To emerge stronger from the crisis requires fast, decisive action; business leaders need to concurrently think across multiple time horizons
• To navigate through the crisis, leaders can leverage real-time, high-frequency, leading indicators to understand patterns and societal shifts
• Experience from prior crises suggests that winners innovate to accelerate out of crisis and seek bold moves, e.g. M&A
• We recommend nine action areas to business leaders that allow companies to emerge stronger
• 'Winning the Fight' improves odds to also 'Win the Future'

                     We believe during this crisis, leaders need to think along two dimensions:
     1 Taking an integrated perspective on health/medical progression, governmental responses, societal reactions,
                         and economic implications to understand business/sector impacts and
           2 Thinking multi-timescale (the now, near, and long-term future—in a flatten-fight-future logic).

Source: BCG                                                                                                                                            2
COVID-19 will be a journey with three distinct phases requiring
an integrated perspective

                      Flatten                                             Fight                                                Future

Typically the initial phase after a pandemic        Finding paths to collectively fight the virus,          Disease controlled through vaccine/cure/
outbreak – goal is to urgently limit number         restart the economy, and support society in             herd immunity, and treatment within
of confirmed cases, especially critical care        balancing lives and livelihood                          sustainable medical capacities possible

                                                                                                                                                              Copyright © 2020 by Boston Consulting Group. All rights reserved. Updated 24 April 2020 Version 3.1.
Social distancing (lockdown) and partial business   Moderate economic activity with recovering              Reactivated economy with strong business
closures outside a few, lead to economic            GDP, some business reopenings, and social               rebound and job growth, social restrictions
recession with large employment impact              distancing on sustainable level                         limited or completely suspended

                                                      1. Disease progression, health care system capacity, and response

                                                      2. Government policies and economic stimulus

                                                      3. Economic scenarios

                                                      4. Business engagement and response

                                                      5. Public engagement and response

                 All of the above five factors result in specific economic and social outcomes in each phase

Source: BCG                                                                                                                                               3
1   COVID-19 Progression and Response
    Disease progression and health care capacity
    Government policies and action

                                                       Copyright © 2020 by Boston Consulting Group. All rights reserved. Updated 24 April 2020 Version 3.1.
    Economic and Business Impact
2
    and Scenarios
    Economic response
    Scenarios and key drivers

3   Guide for Leaders
    Principles for leadership
    Navigating businesses through uncertainty
    Emerging stronger

                                                   4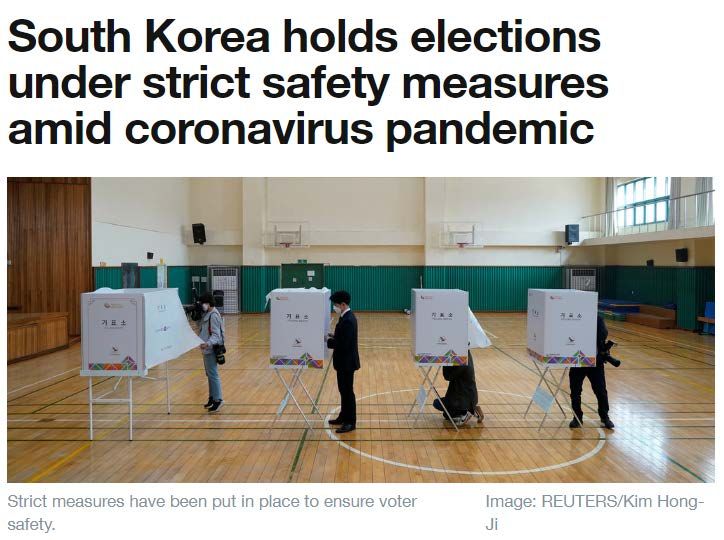
DISEASE PROGRESSION &
  COVID-19 pandemic spread: Cases doubling every ~20 days1 globally                                                                                                               HEALTH CARE CAPACITY

  As of 23 April 2020

                                                               UK

                                                          France                                                                               9th Apr'20        16th Apr'20          23rd Apr' 20
                                                        Spain
                                                                      Italy
                          USA                                                                          China                  Japan
                                                                                        Iran
                                                                                                                        South
                                                                                                  India
                                                                                                                        Korea
                                                                                                                                                  10                  15                  20

                                                                                                                                                                                                          Copyright © 2020 by Boston Consulting Group. All rights reserved. Updated 24 April 2020 Version 3.1.
                                                                                                                                                  8
                                                                                                                                                 days                days                days
                                                                                                                                                 days

                                                                                                                                                   # of days of doubling1 the cases globally

                                                                                                                                                 354k                542k                738k
Days of doubling cases:

     0-3 days                      3-6 days                         6-14 days                       14-30 days                      >30 days                  Total # of recoveries

       183                                       2.7M                     [∆4%]3                    191k                        [∆5%]3
                                                                                                                                                  59                  65                  66

Countries with cases2                         Confirmed cases globally                                    Fatality globally                            # of countries with >1k active cases

  Note: Continued cases and fatalities are subject to different testing, propensity, reporting standards and hence imperfect measures
  1. No. of doubling days based on 7 day CAGR 2. Basis Johns Hopkins CSSE ; 3. Daily growth rate basis 7 day CAGR
  Sources: Johns Hopkins CSSE, Our world in data, WHO situation reports, BCG analysis                                                                                                                5
DISEASE PROGRESSION &
The week that was…                                                                                   HEALTH CARE CAPACITY

From 18 to 23 April 2020

                                                                                                                             Copyright © 2020 by Boston Consulting Group. All rights reserved. Updated 24 April 2020 Version 3.1.
                           April 20, 2020

                                                 A critical shortage of swabs and other testing
                                            components is, in many cases, making it impossible for
                                               labs across the country to expand their capacity.

                                                                                                                     6
DISEASE PROGRESSION &
Leaders need to get the preconditions for Restart right                                                                                                                   HEALTH CARE CAPACITY

                              Health care readiness                                                                                Public/economic readiness

       Disease                            Health care                             Virus                              Business                    Public                   Government

                                                                                                                                                                                                      Copyright © 2020 by Boston Consulting Group. All rights reserved. Updated 24 April 2020 Version 3.1.
     progression                           capacity                             monitoring                          preparation                 response                  preparation
     and impact                                                                  system
 Control of virus impact               Adequate supply of                    Widespread and                       Workplace health         Training and availability    Leadership capacity,
in terms of case growth                  hospital beds,                    private virus testing;               protocols and business      of hygiene products         Policy framework for
  rate, environmental                ventilators, ICUs, PPE,              contact tracing, tracking,                  readiness                 and PPE; civil          public health, sectors,
  factors1, and disease                trained staff, new                      and isolation                                               awareness, compliance            and economy
         impact                            treatments                                                                                               rates

  Leading indicator that                Capacity sufficient to                  Testing to inform                    Businesses ensure        Public educated and       Leadership capacity and
  measures are effective,              care for COVID-19 and                   decisions, resource                  workplace safety for    empowered to adhere to        decision-making on
     public health is                        other health                   allocation, and outbreak                 those returning to      guidelines, to play role    policy; clear guidance
        protected                               needs                               resolution                              work                in containment;            and expectations
                                                                                                                                               societal response2

1. Environmental factors: population density, demographics (age, health conditions), weather, etc.; mixing from other localities
2. Societal behavior: physical distancing, gatherings, intergenerational living, mass transit usage, shopping behavior, etc.
Source: BCG analysis                                                                                                                                                                              7
DISEASE PROGRESSION &
Disease progression | Many countries currently flattening the curve                                                                                                                      HEALTH CARE CAPACITY

As of 22 April 2020

                                         Daily growth rate of total cases (seven-day average)                              Total cumulative number of confirmed cases (log scale)
Flatten                                                                                                                                       Countries2 with doubling rate > 14 days
                                         20%                                                                               1,000,000                                                                  US
 Rates improving from top to bottom

                                                                                                                                                                                                     Spain Italy

                                                                                                                                                                                                                         Copyright © 2020 by Boston Consulting Group. All rights reserved. Updated 24 April 2020 Version 3.1.
                                                                     Singapore5                                                                                                                         Germany
                                         15%                                                                                100,000                                                                    France
                                                                                     Russia                                                                                                                   China
                                                                                                                                                                                       Iran    Belgium
                                                                                                                                                                                                Switzerland
                                                                                                               Cases                                                                             Netherlands
                                                                                                               doubling:                                                               Portugal
                                                                                                                                                                                                Austria
                                         10%                                                                   8 days        10,000
                                                                                                                                                                                                           South Korea
                                                                    India                                                                                       UK                       Norway
                                                                              Brazil                           Cases
                                                                                     Central & South America   doubling:                                        Sweden
                                                                      Africa
                                                               Japan                                           14 days                                                                   Iceland
                                                                         Canada
                                          5%                               Netherlands UK Belgium                             1,000
                                                            Sweden                                      US
                                                                  Portugal                 France
                                                               Austria Switzerland Germany            Spain
                                                        Norway                                  Italy
                                               Iceland
                                                                                   Iran Greater China
                                                       South Korea
                                          0%                                                                                    100
 Fight                                     1,000                10,000        100,000          1,000,000                               0      10           20            30            40       50         60
                                                   Cumulative number of confirmed cases (log scale)                                                                                          Number of days3
                                      Africa    Asia1     Central & South America4        Europe      North America                                    Asia1            Europe              NA

1. Includes Middle East 2. Countries selected from the chart on the left 3. # of days after exceeding 100 confirmed cases 4. Excludes Brazil 5. Singapore observed a steady decline in growth rate of cumulative
cases from 22 Mar to 6 Apr post which the rate has mostly increased as of 22 Apr 2020. Source: Johns Hopkins CSSE, Our World in data, WHO situation reports
                                                                                                                                                                                                                   8
DISEASE PROGRESSION &
Disease progression | Governments actions are delivering results HEALTH CARE CAPACITY
Up to 15 Apr 2020
Close Close Cancel public Close public Public info Restrict internal International
schools workplaces events transportation campaigns movement travel controls
# of countries 18 19 9 10 7 16 8
Copyright © 2020 by Boston Consulting Group. All rights reserved. Updated 24 April 2020 Version 3.1.
Daily growth rate
60%
50%
40%
30%
-20pp. -21pp. -19pp. -29pp.
20% -24pp.
-16pp. -20pp.
10% -9pp.
-7pp.
-10pp. -6pp. -6pp. -5pp. -8pp.
0%
Day 0
Day 0
Day 0
Day 0
Day 0
Day 0
Day 0
Day 14
Day 28
Day 14
Day 28
Day 14
Day 28
Day 14
Day 28
Day 14
Day 28
Day 14
Day 28
Day 14
Day 28
75th percentile Median 25th percentile Days since measure implementation
Note: "Day 0" reflects day measure was taken in each country and can vary across measures; daily growth rate of reported infections based on compound growth in 3-day window prior to date; Chinese province of Hubei
considered as separate country for purpose of presentation; correlations between effects of measures not taken into account; threshold of 100 cases at date of measure introduction used per measure, not across measures
Countries (ISO 3166-1 alpha-2): AT, BE, BR, CH, CL, CN (Hubei), CZ, DE, ES, FI, GR, ID, IL, IN, IQ, IR, IS, IT, JP, KR, MY, NO, PK, PT, QA, SE, SI, TH, US, ZA 9
Source: Oxford COVID-19 Government Response Tracker, Johns Hopkins University CSSE data, BCG analysisHealth care capacity | To support broader usage of masks, DISEASE PROGRESSION &
HEALTH CARE CAPACITY
different countries planning ramp-up of production
As of 23 April 2020
Illustrative: Modeled* for a country with 100M population
PPE: Masks
Range of potential recommendations
Public facilities Vulnerable groups Essential workers Optional daily use Mandatory daily use
& patients & patients & patients for general public for general public
Copyright © 2020 by Boston Consulting Group. All rights reserved. Updated 24 April 2020 Version 3.1.
Anyone using public Recommended use Recommended but
Groups affected & Any worker going into a Required use for anybody
facilities (e.g. shops, for vulnerable people optional use for anybody
usage description workspace with others leaving home
transport) leaving home leaving home
Examples of where Austria China USA USA6 China USA Czech Rep. Morocco
guidance is adopted Mongolia Japan S Korea India6 Japan S Korea Slovakia Turkey
No. people affected
per month (M) 391 352 203 100 100
Total masks/
month (M)4,5 18 34 154 85 180
NB: Analysis above is for 'population masks' and not those that are FDA or FDA EUA approved for health care workers interacting with COVID-19 patients
*Model has been built with US as a representative country and can be used as a near base case for developed countries
1. Brookings (2020); 2. Assumes one member of household goes shopping/to pharmacy 5x monthly –Census.gov (2020); 3. KFF (2020); 4. No of masks needed per person daily assumed to 1 for Public facilities & patients,
Vulnerable groups & patients, Optional daily use for general public, Mandatory daily use for general public; and 4 for Essential workers & patients; 5. Assumes that 50-60% of people go out daily, 50% of general population 10
will wear masks & 70% of vulnerable population will wear masks; 10% buy surgical masks instead of using homemade face coverings; 6. For selected statesDISEASE PROGRESSION &
Virus monitoring | Testing continues to be a pressing issue HEALTH CARE CAPACITY
As of 22 April 2020
Countries1 are continuing to ramp-up testing Testing-to-cases ratios differ widely
Cumulative # of tests per million population Total #
of cases 0.3 53 3.5 11 20 1.7 146 11 184 825 204 129 117
(000')
Copyright © 2020 by Boston Consulting Group. All rights reserved. Updated 24 April 2020 Version 3.1.
# of tests administered per reported case
(based on cumulative average)
662
41
Apr 22 30
27
24 23 Successful benchmark
countries with ratio >20
20
14
Apr 01 11
8
5 4 3 2
Cumulative # of cases per million population
France
US
Vietnam
Germany
Japan
S. Africa
Italy
Spain
India
S. Korea
Russia
Iceland
UK
Note – 1. Non-exhaustive list
Source: World Bank, Worldometers.info, Our World in Data, Johns Hopkins 11Virus monitoring | Currently available serological tests DISEASE PROGRESSION &
HEALTH CARE CAPACITY
too unreliable to provide strong solution
As of 17 April 2020
Two test types available for Illustration: Implications of Accuracy for Covid-19 Testing
Covid-19 that differ in what they Base data: 100,000 tests performed1; 5% disease prevalence
detect and how well they detect Sick patients = 5,000 Healthy patients = 95,000
False Negative Patients False Positive Patients
(sick patients mis- (healthy patients mis-
Copyright © 2020 by Boston Consulting Group. All rights reserved. Updated 24 April 2020 Version 3.1.
1 diagnosed negative)
Current Molecular "gold
diagnosed positive)
standard" test for COVID-19
"Gold standard" molecular tests Sensitivity 98%
provide the most accurate detection of 100 Specificity 99% 950
Detection ~2-4 days before
the virus genetic material (RNA), symptoms
typically from respiratory swabs, and can
detect the virus before symptoms appear Rapid finger-stick serology
Misdiagnosed "high quality"
Sensitivity 80%
infectious people
1000 Specificity 90% 9,500 A positive serology
2 do not isolate
and propagate Detection ~6-10 days after
test result (true or
false positive) that
infection further symptoms
suggest an active
Serological tests COVID-19 infection
detect the human immune response to Rapid finger-stick serology will need a
"low quality" 2
the virus ~1 week from when symptoms confirmatory
appear; many "rapid" serology tests 3,500 Sensitivity 30%
Specificity 60%
38,000 molecular test
launched vary significantly in accuracy Detection~6-10 days after
relative to molecular tests symptoms
1. Roughly equivalent to US nationwide daily throughput as of March 31, 2020 2. The Guardian ("Coronavirus test kits withdrawn in Spain over poor accuracy rate", March 27,
2020); Source: Expert interviews, BCG analysis. Note (i): Serology tests detect active COVID-19 infection starting ~6-10 days after symptoms appear (IgM earlier, IgG later), or
previous exposure to the virus (IgG only); Note (ii): The situation surrounding COVID-19 is dynamic and rapidly evolving on a daily basis. Although we have taken great care prior to
producing this presentation, it represents BCG’s general view at a particular point in time. This presentation is not intended to: (i) constitute medical, legal or safety advice, nor be
a substitute for the same; nor (ii) be seen as a formal endorsement or recommendation of a particular response. As such you are advised to make your own continued assessments
as to the appropriate course of action to take, using this presentation as general guidance only. Please carefully consider local laws and guidance in your area, particularly the most 12
recent advice issued by your local (and national) health authorities, before making any decision.Business preparation | Business readiness across health protocols and DISEASE PROGRESSION &
HEALTH CARE CAPACITY
workplace safety key to ensure smoother transition during Restart
Face
Face
masks
masks Hand
Hand
sanitizer
sanitizer
Special
Special
Copyright © 2020 by Boston Consulting Group. All rights reserved. Updated 24 April 2020 Version 3.1.
cleaning teams
cleaning
teams
Revised social
norms
Revised
social norms
Remote
working
Remote
working
Thermal
imaging
Good morning!
Physical separation
John Doyhle
(e.g. non-overlapping shifts)
Non-overlapping Paid sick
TEMPEARTURE
Thermal shifts Paid sickleave
OK
Tracking
DO YOU FEEL SICK?
imaging &Tracking
tracing leave
& tracing 131 COVID-19 Context and Development
Disease progression, health care system capacity, and response
Government policies and action
Copyright © 2020 by Boston Consulting Group. All rights reserved. Updated 24 April 2020 Version 3.1.
Economic and Business Impact
2
and Scenarios
Scenarios and economic impact
Business implications
3 Guide for Leaders
Principles for leadership
Navigating businesses through uncertainty
Emerging stronger
14Economic and Negative economic impact during 'Flatten' depends on LENGTH of
suppression and DEPTH of economic drop
'Flatten'
Business Impact Understanding of countries' sector composition critical to estimate
direct negative economic impact of reduced contact
and Scenarios
Accelerated movement toward vaccine or treatment at scale could limit
Copyright © 2020 by Boston Consulting Group. All rights reserved. Updated 24 April 2020 Version 3.1.
'Fight' phase to 12-24 months
Development in China gives a first idea on what LEVEL of recovery the
'Fight'
economy can achieve
Current consumer sentiment suggests some willingness to resume activities
post lockdown, but not to pre-crisis level even with treatment
Economic forecasts point to severe downturn in 2020—
global rebound to pre-COVID levels not expected before 2021
Total shareholder return (TSR) has rebounded over last 20 days but impact
Impact
visible across many sectors; no sector above pre-crisis level across regions
While all sectors are affected by the downturn there is a large spread
with some winners within each sector
Source: BCG 15Scenarios and potential outcomes driven by five key questions SCENARIOS AND
ECONOMIC IMPACT
As of 24 April 2020 Illustrative
Flatten Fight Future
Shut down Restart Cure
Economic
Copyright © 2020 by Boston Consulting Group. All rights reserved. Updated 24 April 2020 Version 3.1.
activity 1a 2a
100% 3
2b
1b Potential pathways
Critical care
patients
What will be the LENGTH of "Flatten"? What will be the LENGTH of "Fight"?
1a What are the preconditions to transition? 2a What are the preconditions to transition?
Five questions When will we achieve them? When will we achieve them? Where does the
will shape the 3 economy return to
relative to the pre-
economic COVID era in "Future"?
To what DEPTH does the economy What LEVEL of recovery does the
outcomes 1b
drop in "Flatten"?
2b
economy achieve in "Fight"?
Source: BCG 16'Flatten': Economic impact depends on LENGTH of suppression SCENARIOS AND
ECONOMIC IMPACT
and DEPTH of economic drop
As of 24 April 2020
US (Preliminary figures)
Annualized economic impact1 (in % of USD/year)
Scenario and impact outcome differs based on geography and industry
15-20% loss 2-3% 3-4% 3-5%
Copyright © 2020 by Boston Consulting Group. All rights reserved. Updated 24 April 2020 Version 3.1.
Depth of
economic drop
1b
in 'Flatten' 20-25% loss 2-4% 3-5% 5-7%
(weekly economic loss as
a % of USD/week)
25-30% loss 3-4% 4-6% 6-8%
W2 May2 W1 June2 W4 June2
(7 weeks) (10 weeks) (13 weeks)
1a
Length of 'Flatten'
(in weeks)
1. % in matrix indicate the annualized economic loss (as a % of USD/year) that occurs for a combination of the weekly economic loss (as a % of USD/week) and the length of the suppression
period (in weeks). Lower end of ranges rounded down and upper end of ranges rounded up to reflect uncertainty. 2. Lockdown duration scenarios based on empirically observed 4-8 weeks
from peak infection. Does not reflect impact from peak infection rate, local healthcare capacity, local testing/monitoring capability or local government policies. 17'Flatten': Understanding of countries' sector composition critical SCENARIOS AND
ECONOMIC IMPACT
to estimate direct negative economic impact of reduced contact
As of 24 April 2020
US (Preliminary figures)
US employment by sector (%)
e.g. e.g.
e.g. e.g. e.g. e.g.
Government Biopharma Telecom
Copyright © 2020 by Boston Consulting Group. All rights reserved. Updated 24 April 2020 Version 3.1.
Health care providers & Groceries Software & Legal Auto.& Mining Restaurants & Tourism
& Banking & Construction
15 39 14 14 18
of employment of employment of employment of employment of employment
US revenue by sector (%)
56 13 20 11
of revenue of revenue of revenue of revenue
Open under stay-at-home order Limited under stay-at-home order Limited under stay-at-home order Limited under stay-at-home order
Low-to-high contact intensity Low contact intensity Medium contact intensity High contact intensity
Source: US Economic Census; St. Louis Fed Reserve; BCG COVID response teams; BCG Analysis 18'Fight': Accelerated movement toward vaccine or treatment at scale SCENARIOS AND
ECONOMIC IMPACT
could limit 'Fight' phase to 12-24 months
As of 24 April 2020
Timeframe (years) 0 1 2 3 4 5
Small-scale clinical trial material Commercial scale-up
Traditional vaccine
Copyright © 2020 by Boston Consulting Group. All rights reserved. Updated 24 April 2020 Version 3.1.
development takes Discovery /
Phase 1 Phase 2 Phase 3 Commercial launch
screening
> 5 years
Scale-up at risk Commercial scale up Key success factors/indicators:
Scale to support
Small-scale clinical trial material
global demand
• Published safety data to show vaccine has been
Potential well tolerated in healthy volunteers
Phase 3
accelerated pathway Disc
Phase 1 (1,000s Commercial
(10s patients) launch • Manufacturing scale-up beginning immediately
for Covid-19 vaccine patients)
(expected ~6-12 month lead time)
Phase 2 • Expansion of clinical trials to include volunteers
Limited pre- (100s patients)
Emergency use
over 60 years old
clinical testing authorization for a
small volume release • Established a clear view on a surrogate of efficacy
(e.g. challenge model)
Start Ph 2 with • Data from therapeutics emerging in a few months
interim Ph1 data – drugs likely to reduce severity of infection
Potential animal
challenge study in parallel
Source: Company websites, BCG analysis, https://www.fiercepharma.com/vaccines/china-s-cansino-bio-advances-covid-19-vaccine-into-phase-2-preliminary-safety-data,
https://www.weforum.org/agenda/2020/04/bill-gates-7-potential-coronavirus-vaccines/, https://academic.oup.com/jid/article/doi/10.1093/infdis/jiaa152/5814216, 19
https://www.nature.com/articles/d41586-020-00927-3'Fight': China gives a first idea on what LEVEL of recovery the SCENARIOS AND
ECONOMIC IMPACT
economy can achieve
As of 24 April 2020
China
People and goods are Coal consumption moving Property transactions are
starting to move again higher restarting
2.0 65
70
Copyright © 2020 by Boston Consulting Group. All rights reserved. Updated 24 April 2020 Version 3.1.
1.9 60
2019 2019
2019 60
Daily coal consumption (10K tons)
Traded area of buildings in 30 cities
1.8 55
Average Congestion Delay Index
1.7 50
50
1.6
(10K sq.m.)
45 40
1.5
40
30
1.4
35
2020
2020
1.3 20 2020
30
1.2
Wuhan 25 10
1.1
1.0 20 0
-18
17-Jan -2 21-Feb14 30
23-Mar 46 62
23-Apr -18
17-Jan -2 14
21-Feb 3023-Mar 46 62
24-Apr -18
17-Jan -2 21-Feb14 30
23-Mar 46 62
22-Apr
Note: As of 24 April 2020; China data re-based for weekdays excl. weekends. Congestion delay index average include Beijing, Shanghai, Guangzhou, Shenzhen, and Wuhan; Daily
coal consumption of major power plants = sum of daily average coal consumption of Jerdin Electric, Guangdon Yudean Group, Datang International Power Generation, and
Huaneng Power International, Inc.; Source: www.cqcoal.com, and BCG Center for Macroeconomics 20'Fight': Consumer sentiment suggests some willingness to resume SCENARIOS AND
ECONOMIC IMPACT
activities post lockdown, but not to pre-crisis level even with treatment
As of 13 April 2020
US
Willing to resume some Activities
level of the activity (%) Observations
Flights2 Hotel2 Local Restaurant Shopping
Available vaccine and/or 82 85 84 84 91
Even with treatment, activity level not
drugs to treat going back to pre-crisis level for 9-18%
Copyright © 2020 by Boston Consulting Group. All rights reserved. Updated 24 April 2020 Version 3.1.
No new cases in my country 82 80 76 83 91
Number of new cases 61 56 56 65 74
in my country slows
Even if governments remove restrictions,
Government removes restrictions 46 46 47 55 62
38-54% not willing to resume activity
I'm already comfortable doing this 16-33% already comfortable with
16 18 18 27 33
or will be as soon as they reopen resuming activities 'no matter what'
I would never do this, even after we 5 4 9 7 4
return to 'normal' times (%)
Source: BCG COVID-19 Consumer Sentiment Survey, April 10-13, 2020 (N=2,960 US), unweighted; representative within 3% of US census demographics.
Note: Question text: "When will you feel comfortable [on activity]? Please select up to 3." Respondents who are already comfortable with an activity are assumed to be comfortable with all other
measures as well; respondents who selected "government removes restrictions" are assumed to be comfortable with "number of new cases in my country slows."
1. Data includes only respondents who have been on a cruise in 2016-2020.; 2. Data includes only respondents who have done these activities on 2019-2020. 21Economic forecasts point to severe downturn in 2020— SCENARIOS AND
ECONOMIC IMPACT
global rebound to pre-COVID levels not expected before 2021
As of 22 April 2020
GDP growth forecast vs. baseline GDP level forecast1
2020 2021 EOY 2021 vs. EOY 2019
-10% -8% -6% -4% -2% 0% 2% 4% 6% 8% 10% -10% -8% -6% -4% -2% 0% 2% 4% 6% 8% 10%
Forecast -5.9% Baseline 2.0% 1.7% 4.7%
US 96-103%
Copyright © 2020 by Boston Consulting Group. All rights reserved. Updated 24 April 2020 Version 3.1.
1.2% 6.0% 5.8% 9.2%
China 107-113%
-7.5% 1.3% 1.4% 4.7%
Europe 95-101%
1.9% 5.8% 6.5% 7.4%
India 106-112%
-5.2% 0.7% 0.5% 3.0%
Japan 96-100%
Note: As of reports dated 31 March 2020 to 22 April 2020, YoY forecasts; Last week's forecast based on forecast of IMF and same banks 1. Range calculated with 25th & 75th percentile values
of forecast range; 2. Range from forecasts (where available) of International Monetary Fond, JP Morgan Chase; Morgan Stanley; Bank of America; Fitch Solutions; Credit Suisse; Danske
Bank; ING Group; HSBC; Source: Bloomberg, IMF, BCG analysis 22
Forecast (IMF Apr 2020) Baseline (IMF Jan 2020) Forecast range (IMF & Banks2) Last week's forecast rangeTSR improved over last 20 days, but impact visible across BUSINESS
IMPLICATIONS
all sectors; no sector above pre-crisis level across regions
As of 22 April 2020
Order of sectors reflects economic scenario and consumer sentiment
Americas Europe Asia
TSR performance1 21 Feb '20 – 21 Feb '20 –
20 Mar '20 22 Apr '20
21 Feb '20 – 21 Feb '20 –
20 Mar '20 22 Apr '20
21 Feb '20 – 21 Feb '20 –
20 Mar '20 22 Apr '20
Observations
Food/staples Retail -10% -3% -15% -12% -8% -10%
Pharma -19% 1% -20% -5% -22% -1%
Non-discretionary/essential service less hit but
Healthier sectors Household Products -19% -6% -16% -8% -5% 5% still had recovery
Telecom -17% -11% -20% -19% -14% -6%
Copyright © 2020 by Boston Consulting Group. All rights reserved. Updated 24 April 2020 Version 3.1.
Semiconductors -30% -10% -43% -24% -27% -17%
Food & Beverage -26% -14% -24% -17% -12% -3%
Utilities -33% -17% -30% -28% -6% 7%
Health Equipment -33% -14% -31% -15% -11% -4% Broad set of industries experiencing
Software -30% -14% -32% -22% -28% -16% pressure, with some regions particularly
Tech Hardware -29% -17% -25% -11% -23% -18% affected for certain sectors
Pressured sectors Prof. Services -30% -21% -29% -21% -31% -23%
Materials -34% -20% -31% -19% -30% -23% Utilities and health equipment generally
Retailing better off in Asia
-42% -28% -36% -29% -24% -8%
Capital Goods -38% -24% -35% -27% -29% -23%
Financials -36% -22% -35% -25% -19% -12%
Transport -37% -25% -38% -33% -13% -14%
Media -36% -24% -47% -42% -14% 0%
Insurance -42% -34% -40% -32% -27% -19%
Hospitality -44% -30% -47% -37% -23% -17%
Hardest hit sectors had some recoveries but
Vulnerable sectors Banks -41% -37% -44% -47% -26% -23%
still performing way below 21 Feb 2020 levels
Real Estate -42% -33% -26% -22% -22% -11%
Auto -47% -38% -45% -35% -32% -25%
Durable Goods -49% -38% -32% -23% -21% -14%
Energy -57% -43% -45% -30% -41% -31%
Note: Based on top S&P Global 1200 companies; Industries are based on GICS definitions 1. Performance is tracked for two periods, first from 21 February 2020 (before
international acceleration of outbreak) to 20 March 2020 (trough of the market) and from 21 February 2020 through 22 April 2020
Source: S&P Capital IQ; BCG ValueScience® Center; BCG 23Credit risk continues to be a concern for majority of sectors BUSINESS
IMPLICATIONS
As of 22 April 2020
Median 5-year CDS1 implied Companies in
probability of default2 distress (%)3
21 Feb 2020 22 Apr 2020 21 Feb 2020 22 Apr 2020 Observations
Food/staples Retail 4% 5% 0% 0%
Pharma 3% 3% 0% 11% Less discretionary and cash-rich sectors
Healthier sectors Household Products 4% 4% 0% 0% are largely at lower risk of default in
Telecom 4% 7% 0% 15% current climate
Semiconductors 5% 7% 0% 0%
Copyright © 2020 by Boston Consulting Group. All rights reserved. Updated 17 April 2020 Version 2.1.
Food & Beverage 3% 4% 0% 0%
Utilities 3% 4% 0% 0%
Health Equipment 4% 5% 0% 0%
Software 4% 4% 0% 0%
Tech Hardware 4% 4% 0% 0% Retailing with spike in companies in
Pressured sectors Prof. Services 5% 5% 0% 0%
distress (~50% of retailing sector with
> 15% implied probability of default)
Materials 4% 6% 4% 19%
Retailing 5% 7% 0% 47%
Capital Goods 3% 5% 2% 10%
Financials 4% 6% 0% 0%
Transport 3% 3% 0% 32%
Media 5% 8% 0% 14%
Insurance 4% 7% 0% 0%
Hospitality 5% 12% 7% 43% Auto, hospitality, and energy industries
Vulnerable sectors Banks 4% 7% 0% 8% facing greatest risk of default based on
Real Estate 5% 9% 0% 20% current credit profile
Auto 5% 13% 0% 33%
Durable Goods 4% 6% 0% 5%
Energy 5% 13% 0% 41%
Note: As of 22 April 2020; Based on top S&P Global 1200 companies; Sectors are based on GICS definitions
1. Credit Default Swap 2. Performance is tracked on 21 February 2020 (before international acceleration of outbreak), and 22 April 2020 3. Distressed comprises over 15%
implied probability of default Source: S&P Capital IQ; BCG ValueScience® Center; BCG 24Business leaders can navigate through 'Flatten' and 'Fight' BUSINESS
IMPLICATIONS
leveraging a dynamic cockpit for their specific industry
Dynamic Cockpit
External data sources Internal data sources
Macro indicators Category demand evolution Demand data Stock data
Copyright © 2020 by Boston Consulting Group. All rights reserved. Updated 24 April 2020 Version 3.1.
• Segments / categories, • Sell-in / sell out scenarios
Public health situation Category economic scenarios channels, company vs. • Sell-in / sell out actuals
competition (customer, week and location /
• Virus spread scenarios EPI MODEL
• COVID eco. impacts CONSUMER channel level)
SPEND
on categories
• Medical demand/ PLAN
supply assessment • Scenario-based SALES
future sales
SCENARIOS
Product and customer
Macroeconomic developments Orders
• Short-term demand by
master data
DEMAND
• GDP estimated ECONOMIC
product/location
SCENARIOS
SENTINEL • Stock levels, purchase • Product and customer
development
materials and location attributes and hierarchies
• Government policies
UNEMPLOYMENT Customer behavior shifts
• Labor impact SCENARIOS
DEMAND
• Online user behaviors SENTINEL
Governmental measures
• Sentiment surveys CONSUMER
Production data Commercial data
• Government OUTBREAK SPEND
SCENARIOS • Production planning for • Promo calendar
response timelines
coming weeks
• Lockdown status and
estimated end date
Source: BCG 25BUSINESS
Example for the Fashion and Luxury industry IMPLICATIONS
As of 12 April 2020
US Pre-crisis to bottom Pre-crisis to current 7 days momentum
Fashion Luxury Fashion Luxury Fashion Luxury
Payment patterns -45% -63% -45% -63% -42% ~-2%
Web traffic -4% -14% -4% -4% -4% +6%
Copyright © 2020 by Boston Consulting Group. All rights reserved. Updated 24 April 2020 Version 3.1.
Online search trends -42% -23% -22% -5% +3% +11%
Demand
Open retail space -100% -100% -
Unemployment rate +146% +146% +5%
Fashion
& Luxury Average -67% -69% -63% -63% -9% +4%
Job listings -80% -48% +156%
Discount penetration ~-7% ~+198% ~-7% ~+198% -14% +4%
Supply Average discount rate ~+3% ~-9% ~+3% ~-9% +2% +1%
Cotton Futures -17% -13% -1%
Average -23% -71% -14% -62% +42% +38%
Source: BCG
Note: Bottom is defined as the lowest point during the (partial) lockdown period, for Fashion & Luxury in the US this would be 15 March 2020; pre-crisis refers to 21 April 2019 26BUSINESS
Example for the Machinery industry (including automation) IMPLICATIONS
As of 12 April 2020
US Pre-crisis to bottom Pre-crisis to current 7 days momentum
Energy consumption ~-21% ~-21% ~-1%
Carbon certificate price - - -
Automotive ~-33% ~-21% ~+16%
Debt trading
Construction ~-11% ~-9% ~-1%
Copyright © 2020 by Boston Consulting Group. All rights reserved. Updated 24 April 2020 Version 3.1.
Oil & Gas ~-5% ~+9% ~-1%
Food & Beverage ~-11% ~+1% ~+4%
Demand Chemicals ~-9% ~+2% ~+7%
Machinery Insolvency filing +6 - 0
(including
Automotive prod. volume loss ~-15% ~-15% ~-5%
automation)
Chemical commodities' price develop ~-9% ~-9% ~-4%
Average ~-13% ~-6% ~-2%
Job listings ~-76% ~-76% ~+1%
Traffic load ~-50% ~-38% ~0%
Supply
Cargo volume ~+45% - ~-42%
Average ~-27% ~-57% ~-20%
Price levels ~-10% ~-9% ~+2%
Source: BCG
Note: Bottom is defined as the lowest point during the (partial) lockdown period, for MIA in the US this would be 5 April 2020; pre-crisis refers to 1 January 2020 27While all sectors are affected by the downturn, some companies BUSINESS
IMPLICATIONS
emerge as winners within each sector
As of 22 April 2020
Year-to-date shareholder return in % per sector
20
0
-20
-40
-60
-80
Copyright © 2020 by Boston Consulting Group. All rights reserved.
Pharma
Media
Food & Beverage
Food/staples Retail
Transport
Health Equipment
Materials
Durable Goods
Household Products
Telecom
Tech Hardware
Hospitality
Software
Financials
Real Estate
Banks
Auto
Retailing
Insurance
Semiconductors
Energy
Utilities
Capital Goods
Healthier sectors Pressured sectors Prof. Services Vulnerable sectors
Top 10% Bottom 10% Median Performance spread between bottom & top 10%
Note: Data as of 22 April 2020; Sectors are based on GICS definitions; Companies sampled from S&P Global 1200
Source: S&P Capital IQ; BCG ValueScience® Center 281 COVID-19 Context and Development
Disease progression, health care system capacity, and response
Government policies and action
Copyright © 2020 by Boston Consulting Group. All rights reserved. Updated 24 April 2020 Version 3.1.
Economic and Business Impact
2
and Scenarios
Economic response
Scenarios and key drivers
3 Guide for leaders
Principles for leadership
Navigating businesses through uncertainty
Emerging stronger
29PRINCIPLES OF
LEADERSHIP
Guiding principles Be visible, purposeful, Leverage the principle
and authentic of “commander’s intent"
for leadership Communicate in ways that engage and Share only key objectives and rationale
in crisis increase the relevance of your teams of required actions to allow the
and clarify the reasons underlying your organization to be flexible and adaptive,
communications and allow a focus on execution
Copyright © 2020 by Boston Consulting Group. All rights reserved. Updated 24 April 2020 Version 3.1.
“THESE are the times that try Use multiple clock-speeds Engage externally
men's souls. The summer soldier
and the sunshine patriot will, in Think on multiple timescales by Communicate with customers and
this crisis, shrink from the service considering the now, the next, and the stakeholders to gather frequent, fresh,
of their country; but he that later. Ensure that leadership teams look firsthand information to adapt and
stands by it now, deserves the love ahead and prepare for the future respond effectively
and thanks of man and woman.
Tyranny, like hell, is not easily
conquered; yet we have this
consolation with us, that the Cut through bureaucracy Keep imagination alive
harder the conflict, the more
glorious the triumph." Assemble a multi-functional task force Look out for new needs and opportunities
that is empowered to make decisions to serve clients now and beyond the crisis.
and suspend normal decision protocols We will not be reverting to a 2019 reality
Thomas Paine, The Crisis
Source: When Leadership Matters Most, BCG Henderson Institute 30Questions on every business leader's mind right now NAVIGATING BUSINESS
THROUGH UNCERTAINTY
• What are potential long-term impacts to consumer behavior?
1 What will the "new • How will business economics be structurally different?
future" look like? • What will the competitor landscape look like in the future?
• What (digital) trends will have accelerated due to COVID-19?
Copyright © 2020 by Boston Consulting Group. All rights reserved. Updated 24 April 2020 Version 3.1.
• Which new trends will appear?
• Can our supply chain still rely on international trade?
• How will the future of work develop?
• Which changes in employee routines will remain?
• How do we emerge stronger after the crisis?
2 How should we • How do we build capabilities for the future?
prepare and win? • What "no regret" or "low regret" moves can we make? When
should we make various moves?
• How can we accelerate innovation, adoption of future digital,
and technology trends?
• How do we collaborate effectively with society and
government?
Source: BCG 31Winners Example based on companies that leveraged the 2008 crisis
to innovate
innovate to
accelerate out BCG 50 Most Innovative Companies
(as identified in 2007)
Morgan Stanley Capital International (MSCI) World
119
of a crisis
Copyright © 2020 by Boston Consulting Group. All rights reserved. Updated 24 April 2020 Version 3.1.
+4.0%
100 99 TSR p.a.
100 98
86 97
89
83
63 79
58
2007 2008 2009 2010 2011 2012
Note: Chart compares TSR performance of publically listed MIC (Most Innovative Companies) 50 companies in
2007 (pre-financial crisis) and follows their TSR performance through the crisis until 31.12.2012;
Source: Accelerating out of the great recession book, BCG Innovation Journey Analytics Database; CapitalIQ 32In the new normal, existing trends will accelerate NAVIGATING BUSINESS
THROUGH UNCERTAINTY
and winners will define new ones
Medtech example
1 What will the "new future" look like? Not exhaustive
COVID-19 likely accelerating COVID-19 may introduce new
existing/anticipated trends long-term trends/impacts
Copyright © 2020 by Boston Consulting Group. All rights reserved. Updated 24 April 2020 Version 3.1.
Telemedicine Point Provider Digital Protectionism Economic
of care consolidation engagement downturn
Increasing patient Disruption in industry Potential liquidity crisis New investments in More restrictive flow of Global recession will lower
adoption of virtual will see rise of new care could put smaller digital marketing and goods, innovation, and overall demand for elective
interactions with models; may spark players out of business novel sales tactics could people could result in health care services; rise in
physicians for a wider move away from and advantage larger yield long-term structural balkanized markets and unemployed and uninsured
range of maladies/ hospitals for some less networks of provider changes to how the need to focus on will dampen demand
treatments invasive/complicated services going forward manufacturers engage different set of markets
surgeries (e.g. hip with physicians (and for future growth
replacements) physicians with patients)
Note: These analyses represent only potential scenarios based on discrete data from one point in time. They are not intended as a prediction or forecast,
and the situation is changing daily (as of April 6, 2020); Source: BCG 33In the new normal, existing trends will accelerate NAVIGATING BUSINESS
THROUGH UNCERTAINTY
and winners will define new ones
Retail (non essential) example
1 What will the "new future" look like? Not exhaustive
Market Channels Operating model
Copyright © 2020 by Boston Consulting Group. All rights reserved. Updated 24 April 2020 Version 3.1.
Many sub-sectors Marketplaces and Large share of Omnichannel growth Customer Cost base will be Supply chains will
will consolidate essential retailers physical retail may will challenge communication restructured for become diversified
into a triumvirate will disruptively permanently close retailer economics, will largely move to most companies, with pressure to
of or two traditional steal share in non- as lower spending, and require business digital marketing potentially through shift inventory to
players, at-scale essential categories and decline in model and customer as retailers lose bankruptcy or vendors as retailers
marketplaces, and (less so where barriers relevance of malls, experience innovation, ability to use stores insolvency seek to reduce
niche players to entry are high or brings less foot as consumers push to drive traffic (less so proceedings (e.g. inventory costs,
(including pureplays, supply chains are traffic (less so where toward e-commerce as for categories with Chapter 11, cash-outs, and the
direct to consumer) different e.g. DIY) stores provide the norm structural need for Company Voluntary risk of product not
experience) stores e.g. DIY) Agreements) selling
Note: These analyses represent only potential scenarios based on discrete data from one point in time. They are not intended as a prediction or forecast,
and the situation is changing daily (as of April 6, 2020); Source: BCG 34Reevaluate portfolio Adjust portfolio priorities to capture
demand across key categories, over
strategy and restructure "Fight" and "Future" phases
Accelerate innovation—reimagine the
Innovate across the system to scale value-creating ideas
across the value chain and customer
value chain
To emerge journeys
Copyright © 2020 by Boston Consulting Group. All rights reserved. Updated 24 April 2020 Version 3.1.
(e.g. Transform go-to-market approach)
stronger,
leverage Evaluate org. structure; Transform organization to enable
strategic change—leverage 'future of
disruption ways of working work' models
by making bold,
strategic moves Double down on shift to digital during
Accelerate E2E digitization COVID—embrace opportunities across
all processes
Consider inorganic Pursue attractive M&A options or other
opportunistic moves during downturn—
opportunities consider macro and company landscape
35Weak-economy M&A deals outperform strong-economy deals EMERGING STRONGER
2 How should we prepare and win?
Observations
Cumulative relative total shareholder return index
Weak-
Copyright © 2020 by Boston Consulting Group. All rights reserved. Updated 24 April 2020 Version 3.1.
106.4 economy Weak-economy deals
106.1 deals outperform strong-economy
100.4 deals by more than 9
100 percentage points
100.2
+9.6 The benefits are even higher
99.4 for non-core acquisitions
(outside the buyer's industry)
T-3 T+3 96.5
Both experienced M&A
Strong-
dealmakers and occasional
economy
acquirers create value from
Year 1 deals
downturn deals
Year 2
Note: Strong-economy (weak-economy) years are those in which the respective global real GDP growth rate is in the top (bottom) third of all growth rates in the observation
period. The total of 9,987 M&A transactions comprises pending, partly completed, completed, unconditional and withdrawn majority deals announced between 1980 and 2018
with a deal value greater than $250 million. Only deals with a public buyer were considered. The share price three days before the announcement date (T-3) equals 100. Share
performance from T-3 to three days after the announcement (T+3) equals the announcement effect.
Source: Revinitiv; Datastream; BCG analysis 362 How should we prepare and win?
1 Managed services and
Cloud – Health care 2 BPO – Banking,
Securities, and Retail 3 All IT services –
Insurance
• Increase in requirement for • Increased adoption of remote • Increase in number of claims,
digitization of records and cloud banking and digital processing by fresh policies and renewals, higher
storage for analytics banks; increased e-commerce volumes will require more
transactions to positively impact outsourcing for processing
IT Services example BPO services requirement
• However, In the shorter term
• Government may mandate need • Transaction-based services like insurance companies will have
Copyright © 2020 by Boston Consulting Group. All rights reserved. Updated 24 April 2020 Version 3.1.
for more providers to be connected brokering, collections, are stretched financials
Six pools that to cloud to be able to access inflow negatively impacted; physical due to high claim ratio
and capacity real-time retail stores may see lasting
could potentially footfall decrease as e-commerce
adoption increases
provide good
acquisition Unified Communications
targets 4 Cybersecurity –
Banking and Securities 5 and Collaboration across
industries 6 Engineering services –
Health care
• Increased focus on cybersecurity of • Increased requirement for remote • Increased spending on testing
assets as WFH/remote working and secured connectivity due to and health care (ventilators)
proliferates remote operations equipment
Tailwind • Increase in online banking and • More spend on collaborations • More spent on health care
digitization of processes software including task infrastructure across the board
management, communication, etc. by governments world over
Headwind
37Flatten Fight Future
9
Establish crisis 1 Develop Scenario-Based
Planning Approach to
2 Create a Rapid Response
and Transformation
management manage uncertainty (RR&T) team
Copyright © 2020 by Boston Consulting Group. All rights reserved. Updated 24 April 2020 Version 3.1.
3 Revamp Organization and
People for the new normal 6 Manage Cost, Cash,
and Liquidity
action areas Navigate 4 Drive Topline Security
and Customer trust 7 Emerge Stronger; drive
advantage in adversity
for business through
Flatten, Fight,
leaders and Future 5 Stabilize and restart Supply
Chain, Manufacturing 8 Accelerate Digital and
Technology transformation
9 Help Society during
COVID-19
Note: RR&T = Rapid Response and Transformation Team
Source: BCG 38Detailed measures across priority action areas (1/3)
Flatten Fight Future
Establish crisis
management
• Deep-dive into possible outcomes of disease spread, demand • Frequently run scenarios and update plan; focus on
shifts, supply/ops issues, regulatory requirements, and understanding the de-averaged impact by geography
potential operations restart; adjust for sector-specific issues and line of business, depth of demand drop, duration
Develop Scenario-Based of Fight phase
1 Planning Approach to
• Perform scenario stress tests around cash-flow
• Establish preconditions for what it will take to get workforce • Develop recommendations for daily planning,
manage uncertainty back to offices, factories, etc. resources, supply chain, workforce, and other
Copyright © 2020 by Boston Consulting Group. All rights reserved. Updated 24 April 2020 Version 3.1.
stakeholder management as per modeled scenarios
• Set up teams to work on different time horizons (Flatten, Fight,
Future) to avoid reverting to crisis management across all
• Establish nimble cross-functional Rapid Response & • To manage the massive complexity of "restarting",
Create a Rapid Response Transformation team (RR&T) enhance Rapid Response & Transformation team
2 • Refine processes to manage the crisis situation, remote structures
and Transformation
working, disruption in supply • Develop approach for how to bring people back to work,
(RR&T) team • Ensure smooth transition of operations and workforce to how/when to engage customers
the 'new reality' • Establish governance and standardization to effectively
• Shift to digital/remote customer interactions coordinate other areas from the RR&T
Navigate through
Flatten, Fight, and Future • Define policies to keep employees safe with high morale • Get ahead of the curve on team to manage policies
to get teams back to work safely
• Engage across levels to retain talent
• Move to online/remote working; redefine rosters and train • Take a clear view of forward demand and the new
for efficiency/effectiveness normal: manage/restructure organization to fit
Revamp Organization and
3 People for the new normal • Establish preconditions for coming back to the working
environment; clearly communicate them
capacity needs
• Create dedicated focus to accelerate digital,
process automation, new ways of working
• Build SWAT teams to address critical business areas, such as
product launch, digital channel redesign, retail delivery models
Source: BCG 39Detailed measures across priority action areas (2/3)
Flatten Fight Future
Navigate through
Flatten, Fight, and Future
• Reach out to customers for their situation and needs, • Assess changes in customers' behaviors
• Drive actions to inspire confidence and ensure ability to • Adapt and transform channels
Drive Topline Security &
4 Customer Trust
deliver (e.g., multichannel, people-light approaches)
• Manage volatility in demand, and refine sales motions
(e-commerce), sales, marketing spend, pricing, and support
• Ramp up commercial efforts significantly to seize market
Copyright © 2020 by Boston Consulting Group. All rights reserved. Updated 24 April 2020 Version 3.1.
(e.g. to virtual) and objectives shifts; leverage learnings to accelerate digital capabilities
• Take measures to ensure operations continuity: • Ensure quick and safe restart of facilities; drive
workforce safety and management, stop-gap measures centrally driven efficiency measures
Stabilize and restart for supply chain, site readiness (access, maintenance, • Set up capabilities (org, control tower) to
5 Supply Chain, services, suppliers) manage unstable supply chain; explore alternate
Manufacturing • Ensure open and direct communication with employees networks, dual/multiple suppliers for critical
• Explore solutions to retain key talent goods and services, delivery methods, etc.
• Accelerate production as demand rebounds;
account for product shifts
• Build forecasts for COVID-19 impact on P&L, • Build central team to simulate financials as per
balance sheet, investor base evolving scenarios; drive agile working ways
Manage Cost, Cash, • Review capital sufficiency scenarios and possible • Decisively take structural actions: TURN PMO,
6 and Liquidity effects on credit risk zero-based budgets, delayering/restructuring,
re-base tech portfolio, etc.; deploy rapidly as
• Manage credit and debt commitment for short term
speed is predictive of success in downturns
• Create agile FY20-21 business plans and budgets to
deal with uncertainty
Source: BCG 40Detailed measures across priority action areas (3/3)
Flatten Fight Future
Navigate through
Flatten, Fight, and Future
• Stress-test current value proposition and business • Plan for new projects to shift the portfolio and
offerings, and scan crisis impact on key leverage the 'new normal'; plug capability gaps
customer/market trends
• Identify white spaces in own industry and ecosystem
Emerge stronger; drive
7 advantage in adversity
• Selectively invest in areas where opportunistic M&A
can be conducted
Copyright © 2020 by Boston Consulting Group. All rights reserved. Updated 24 April 2020 Version 3.1.
• Develop and implement strategy to exploit greater
talent availability
• Address and serve immediate workforce needs for • Identify and implement key digital use cases and
Accelerate Digital & remote working adapt to agile way of working
8 Technology transformation • Leverage tools for conducting key processes online • Accelerate use cases to meet demand shifts
• Adapt traditional processes to become digitally viable • Redesign key customer journeys with emphasis
on digital interventions
• Ensure immediate support to employees, suppliers, • Determine how to contribute in the crisis to
communities, etc. employees, customers, through medical response,
• Team with government/local communities/across supply of essential items for society, or by playing
a positive economic/employment role
Help Society during industries to address crisis
9 COVID-19 • Leverage assets, supplier relationships, logistics • Allocate innovation resources where possible to
focus on solutions to COVID-19 crisis
networks, and employees to help adjacent communities
• Work across industry boundaries to identify cross- • Leverage expertise developed to support
sectoral synergies to deploy solutions government policies and responses, rebuild
business for local customers, suppliers, etc.
Source: BCG 41Additional perspectives on COVID-19
Selected overarching publications Selected sector publications
Copyright © 2020 by Boston Consulting Group. All rights reserved. Updated 24 April 2020 Version 3.1.
Transformation Strategy Public Sector Automotive Financial Institutions
COVID19: Win the Fight, Advantage Beyond the Beyond the Curve: How to Restart Auto Companies Will Outlast Global Risk 2020: It's Time for
Win the Future Crisis in the Wake of COVID-19 COVID-19 & Come Out Stronger Banks to Self-Disrupt
Globalization Crisis Response Checklist Energy Health Care Consumer
COVID-19 and the Checklist How Uncertainty Is Hitting M&A Biopharma Applies New Service & COVID-19 Consumer Sentiment
Emerging-Market Consumer in Oil and Gas Support Models amid COVID-19 Snapshot #5: Hitting the Straightaway
Leadership & Talent People & Organizations Travel & Tourism Telecommunications Transportation & Logistics
Leading Out of Adversity Take Care of Tech Talent The Great Reset for Revenue Time for action: In times of Transportation & logistics
When it Matters Management in Travel COVID-19 Telcos need to move companies must adapt to keep
rapidly to be part of the solution supplies moving
Source: BCG 42You can also read