COVID-19 Effects on Arizona's Tourism and Trade with North America
←
→
Page content transcription
If your browser does not render page correctly, please read the page content below

COVID-19 Effects on
Arizona’s Tourism and Trade
with North America

                     1
2

    CONTENTS

    EXECUTIVE SUMMARY................................................................................................................. 3
    INTRODUCTION............................................................................................................................ 6
    1.    EFFECT OF COVID-19 ON TOURISM, LEISURE AND HOSPITALITY .................................. 7
          1.1. Tourism and Travel Revenues Down Significantly ........................................................................... 7
          1.2. Canadian Visitors to Arizona ..................................................................................................................... 9
          1.3. U.S.-Mexico Tourism ..................................................................................................................................10
          1.4. Arizona-Mexico Tourism...........................................................................................................................12
    2.    ARIZONA – CANADA TRADE.............................................................................................. 17
          2.1. Arizona-Canada Exports ..........................................................................................................................17
          2.2. Arizona-Canada Imports...........................................................................................................................19
    3.    ARIZONA-MEXICO TRADE ................................................................................................. 22
          3.1. Arizona-Mexico Exports ............................................................................................................................23
          3.2. Arizona-Mexico Imports ...........................................................................................................................27
    4.    MEXICO ESSENTIAL BUSINESS .......................................................................................... 29
          4.1. Mexico’s Reopening Guidelines.............................................................................................................29
          4.2. COVID-19 Effects on Mexico’s Manufacturing Exports ................................................................30
          4.3. Most Impacted: Automotive Industry .................................................................................................31
          4.4. Sonora’s Automotive Industry ................................................................................................................32
    5.    THE EFFECTS OF COVID-19 ON NORTH AMERICAN SUPPLY CHAINS.......................... 34
          5.1. A Shock to the System ..............................................................................................................................36
          5.2. Renewed Focus on the Resilience of Supply Networks ...............................................................37
          5.3. Outlook for Fall and Winter .....................................................................................................................37
    CONCLUSION .............................................................................................................................. 38

                     Maricopa Association of Governments – Regional Economic Development
3

    EXECUTIVE SUMMARY
    This white paper examines the effects of the COVID-19 global pandemic on Arizona’s tourism and
    hospitality sector and the state’s trade with Mexico and Canada. Specifically, it examines the
    tourism flows from Mexico and Canada and the implications for Arizona’s economy. This paper
    also discusses the effects of the disruption in Arizona's global supply chains caused by the
    pandemic.

    Tourism and Hospitality Sector

    The voluntary lockdown and social-distancing measures instituted to slow the spread of COVID-19
    brought leisure and business travel, as well as gatherings in public places, to a sudden stop in mid-
    March 2020. In Arizona, the abrupt cancellation of the baseball spring training season and other
    sports events, business meetings and conventions, along with the closing of restaurants, bars and
    casinos, resulted in hundreds of millions of dollars in lost sales.

    The leisure and hospitality sector, requiring in-person interaction, was the hardest hit. Arizona's
    hotel/motel sector experienced a devastating 81% drop in year-over-year sales in April, partially
    recovering to a 33% year-over-year decreases for June and July. This loss in revenue caused mass
    layoffs. Passenger counts at Sky Harbor Airport in April 2020 reflected the drop in air travel and
    were down 92% compared to April 2019. Despite partially rebounding in June and July, passenger
    traffic was still down 65% compared to July 2019.

    North American Tourism

    While the U.S.-Canada and Mexico land borders remain closed to nonessential traffic as of early
    October 2020, Canadian and Mexican travelers flying into the U.S. do not face any quarantine
    requirement or movement restrictions. Canadian travel insurance companies now include COVID-
    19 medical coverage in travel insurance policies for Canadians. This is an important development
    and allows Canadian visitors to visit the state as the winter travel and snowbird season begins in
    mid-October/early November.

    In 2019, the number of Mexican tourists visiting Arizona reached 4 million, of which 16% stayed
    overnight, with an estimated $840 spent per party on each trip. Of those visitors, 84% visited
    Arizona for leisure, and among these, 75% reported to be visiting to shop, and 16% for business.

    Between the months of January through July, only 2.1 million persons crossed the northbound
    border between Arizona and Sonora, Mexico, a reduction of 62.6% from 2019. It is important to

               Maricopa Association of Governments – Regional Economic Development
4

    note that the crossing restriction for Mexican and Canadian tourists remains in effect until October
    21, with a high likelihood for it to be extended.

    The Mexican economy also has been affected by the border crossing restrictions. American arrivals
    into Mexico decreased by 58.4% compared to the previous year. However, during the first 6
    months of the year, U.S. visitors to Mexico still represented more than half of the total visitors
    arriving via air, followed by Canada with 17.8%.

    The pandemic shows how interconnected North American economies are, and the extent to which
    the tourism industries in all three countries depend on cross-border visitors. The tourism industry
    forecast for the Phoenix market in 2021 shows an uptick, with an expected 56% occupancy rate,
    representing an increase of 16.1% over 2020. This small increase is similar to the national forecasts,
    but is still far below pre-pandemic levels.

    Arizona Trade with North America

    Mexico and Canada are Arizona's largest trading
    partners. Combined, they account for 43.6% of
    the state's global trade footprint. Exports from
    Arizona to Canada for the first two quarters of
    2020 totaled $1.04 billion, a 13% decrease from
    $1.2 billion in the first half of 2019. Arizona’s top
    exports to Canada during the first half of 2020
    were agricultural products, computer and
    electronic products, transportation equipment,
    machinery, and electrical equipment.

    Imports from Canada were significantly higher from January 2020 through June 2020 compared to
    the first half of 2019. This increase in Arizona’s imports from Canada is a stark contrast to the
    national drop in imports, with the exception of a decrease in imports for the month of April 2020.
    This increase in Canadian imports is likely due to strong industrial demand as well as the
    completion of purchase contracts that predated the COVID-19-driven shutdowns. This increase
    also likely reflects Arizona’s strong pre-pandemic economy and robust manufacturing base in the
    defense and aerospace sectors, as well as residential and commercial construction, particularly in
    the Phoenix region.

    Arizona trade with Mexico has grown exponentially over the past decade. Trade flow through the
    Nogales border port of entry in 2019 reached $26.29 billion. However, due to COVID-19
    containment measures taken in the beginning of the year, Arizona’s exports into Mexico decreased
    21%, and imports also decreased by 12% compared to the same period in 2019.

                Maricopa Association of Governments – Regional Economic Development
5

    Notably, manufactured imports from Mexico decreased 43.3%. Electrical equipment, computer,
    and electronic products showed a drop in imports. The drop was especially marked in
    transportation equipment, with a reduction of $155.67 million for the same period compared to
    2019.

    This white paper features a special segment dedicated to understanding the essential business
    criteria instituted by the Mexican government, and how the manufacturing industries that export to
    the U.S. are recovering from the shutdown in operations from April to the beginning of June 2020.

    Effect on Supply Chains

    The initial precautionary measures instituted to slow the spread of COVID-19 dealt a seismic shock
    to global supply chains and logistics operations. The closures of businesses created cascading
    disruptions in highly integrated supply chains from Canada to Mexico in every non-regional
    consumer and industrial sector. Delayed shipments of key parts for electronics, transportation, and
    aerospace manufacturing along with shortages in consumer and medical products caused stoppages
    in production lines. These disruptions hurt businesses’ bottom lines, with a subsequent effect on
    employment.

    Consumer spending began increasing in May and retail spending returned to pre-pandemic levels
    by July. Retail sales in August 2020 exceeded that of August 2019 by 2.6%. The return of economic
    activity in key sectors spurred the resumption of freight movement in North America. The logistics
    and warehousing driven by e-commerce has been a particular bright spot for the economy. The
    COVID-19 supply and demand shocks have prompted original equipment manufacturers (OEMs),
    their suppliers and third-party logistics companies to focus on the resilience and security of supply
    chains.

    The disruption in supply chains and buying habits, combined with shifting demand and supply
    forecasts, have accelerated the following trends: growth of e-commerce, particularity in retail sales;
    a movement towards securing supply chains; a renewed focus in electric cars, which have fewer
    moving parts and simpler supply chains; growth in “fintech” and digital banking products; and the
    transformation of traditional supply chain models into digital supply networks that provide greater
    visibility into the web of supplier networks.

               Maricopa Association of Governments – Regional Economic Development
6

    INTRODUCTION
    The COVID-19 pandemic led to an
    unprecedented disruption to the global economy
    and world trade when lockdowns and social
    distancing measures halted production lines and
    depressed consumption across the globe. To
    contain the spread of COVID-19, governments
    introduced temporary travel and mobility
    restrictions, many of which remain in effect as of
    October 2, 2020, for travelers in North America.
    While driven by public health considerations,
    these measures have created a massive economic          Coronavirus graphic courtesy CDC Science Photo Library
    shock and have had significant trade
    implications, as mobility across borders is a key facilitator of trade in goods and services. 1

    Starting in March 2020, as the coronavirus pandemic took hold, the fiscal impact of these swift
    economic changes was felt in cities across the country. 2 This white paper highlights the cascading
    effects on Arizona’s economy and the state’s strategic economic ties with its largest trade partners,
    Mexico and Canada.

    Trade and tourism are critical to Arizona’s prosperity, as they fuel economic growth, support good
    jobs, raise living standards and help Arizonans provide their households with affordable goods and
    services. These two industries are also a key driver of regional economic growth. In 2019, travel
    and tourism in North America reached $2.1 trillion in total Gross Domestic Product (GDP),
    representing 8.8% of the total GDP 3. Tourism is an important component of Arizona’s economy
    and Canadian and Mexican tourism is a key component in this sector.

    Exports bring new money into a regional economy, while indirect and induced effects of exports
    support a multitude of other businesses. Export industries generally pay higher wages and imports
    fill demand by manufacturer and consumers. In today’s integrated supply chains, Arizona’s exports
    and imports to North America are affected by border closings as well as disruptions in supply
    chains in Asia.

    1
      World Trade Organization, Cross-border Mobility, COVID-19 and Global Trade.
    2
      National League of Cities, Fiscal Conditions Report 2020.
    3
      World Travel and Industry Council, Economic Impacts Report.

                Maricopa Association of Governments – Regional Economic Development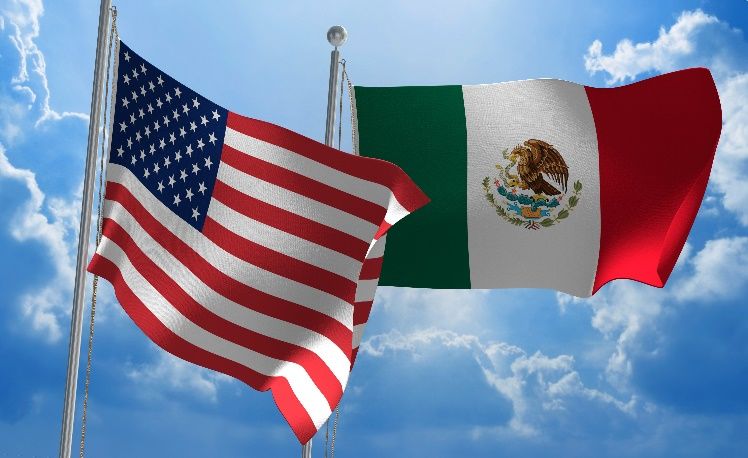
7

    1. EFFECT OF COVID-19 ON TOURISM,
       LEISURE AND HOSPITALITY
    1.1. Tourism and Travel Revenues Down Significantly

    The voluntary lockdown and social-distancing
    measures instituted to slow the spread of
    COVID-19 brought leisure and business travel,
    as well as gatherings in public places, to a
    sudden stop in mid-March 2020. This had a
    profound negative effect on tourism, travel,
    and hospitality industry sectors in both the
    nation and Arizona, and triggered a severe
    economic downturn. Nationally, the arts,
    entertainment, and recreation revenue for the
    second quarter of 2020, adjusted for seasonal
    variation, was $32.5 billion, 51.2% lower than the first quarter of 2020, and 56.5% less than the
    second quarter of 2019. 4

    The national weekly hotel occupancy rate hit a low of 21% in April 2020 and was only 48.6% as of
    September 19, 2020. While that is an improvement over the dismal rate in April, it is still a 30.2%
    decrease compared to the same period in 2019. In Arizona, the abrupt cancellation of the baseball
    spring training season and other sports seasons, business meetings and conventions, along with the
    closing of restaurants, bars and casinos, resulted in hundreds of millions in lost sales.

    According to the Arizona Tourism and Lodging Association’s (AZTLA) market overview for the
    month of August 2020, the year-over-year room occupancy rate decreased 26%. The Average Daily
    Rate (ADR) is the average daily revenue earned for an occupied room in the state. The ADR
    decreased by 9.7%, which indicates modest price reductions in the face of a huge number of empty
    rooms.

    One of the most affected areas in the state was Northern Arizona, which experienced an 18% drop
    in occupancy and a 12.6% ADR decrease. Nevertheless, Phoenix suffered the largest decrease in
    occupancy rates with a 31% decrease, followed by Tucson with a 27% decrease. The Phoenix
    area’s ADR for August was 7.7% below the prior year period, with room rates averaging $82.
    Additionally, room supply dropped by only 1.7%, while room demand dropped by 32.2%

    4
        U.S. Census Bureau, Quarterly Services Survey, September 11, 2020.

                   Maricopa Association of Governments – Regional Economic Development
8

    compared to the same period in 2019. 5 This accumulated loss in revenue led to mass layoffs
    starting in March and they continued through the summer.

    The chart below indicates job losses for key sectors from February 2020 to June 2020. The leisure
    and hospitality sector, which entails travel and in-person interaction, was by far the hardest hit
    during this five-month period.

    Figure 1 – Changes in Phoenix-Mesa-Chandler MSA Jobs by Industry, February 2020-
    August 2020 (Thousands)

                               Other Services                                                                2.1
                        Mining and Logging                                                            -0.1
                          Financial Activities                                                        -0.4
                                  Information                                                        -2.3
        Trade, Transportation, and Utilities                                                     -3.4
                              Manufacturing                                                      -3.5
                                Construction                                                    -5.4
             Education and Health Services                                                           -10.7
        Professional and Business Services                                                           -25.8
                     Leisure and Hospitality                                                         -61.1

    Source: University of Arizona, Eller School of Business Economics and Business Research Center

    The table on the following page shows the year-over-year changes in key economic indicators in
    the following services sectors:
        • The hotel/motel sector experienced a devastating 81% drop in year-over-year sales in April,
            partially recovering to 33% year-over-year decreases for June and July.
        • Monthly sales in the entertainment services sectors, including restaurants and bars, were
            down by double-digit amounts from last year.
        • Airport passenger traffic at Sky Harbor Airport was down 92% year-over-year in April 2020;
            despite increases in June and July, July passenger traffic was still down by 65% compared to
            July 2019.
        • The food retail sector was the rare sector to show a year-over-year increase in sales, and this
            increase was likely due to people staying home and cooking more. 6

    5
        Arizona Tourism and Lodging Association (AZTL), STR Tourism Industry Forecast, September 2020.
    6
        University of Arizona, Eller School of Management, Monthly Indicators.

                   Maricopa Association of Governments – Regional Economic Development
9

    Table 1 – Phoenix-Mesa-Chandler MSA Monthly Sales, Revenues and Passenger Traffic –
    March-July 2020 ($ millions, accrual)

     RETAIL SALES                              March 2020       April 2020      May 2020       June 2020        July 2020

     Aggregate Retail                              6,740.64        5,704.40        6,685.47         6,964.02        6,535.70
     % Change from Year Ago                         -6.28%         -16.20%          -2.25%            5.68%            3.17%
     Retail (less food and gasoline)               4,661.20        3,958.90        4,737.40         4,944.40        4,577.40
     % Change from Year Ago                         -2.90%         -11.50%           5.30%           13.10%            8.40%
     Food   (1)
                                                      877.6           881.4           885.1            888.7            892.2
     % Change from Year Ago                           5.80%          5.79%           5.76%            5.73%            5.68%
     Restaurants and Bars                             758.7           581.2             755            776.5            703.2
     % Change from Year Ago                        -34.20%         -42.40%         -23.60%          -12.40%          -15.40%
     Gasoline (2)                                     416.4           254.6           278.4              324              332
     % Change from Year Ago                         -0.70%         -49.10%         -47.20%          -30.20%          -25.50%
     Hotel/Motel                                      164.2             43.7            61.5               91             74.9
     % Change from Year Ago                        -53.50%         -80.70%         -63.20%          -33.30%          -33.00%
     Amusement Venues                                   66.2            25.3            32.9             28.9             22.3
     % Change from Year Ago                        -54.10%         -67.20%         -66.60%          -77.90%          -71.10%
     Phoenix Sky Harbor Airport
     Total Passengers                            2,398,309         282,243         584,283        1,102,143        1,351,807
     % Change from Year Ago                        -45.00%         -92.90%         -85.20%          -71.20%          -64.70%
     Total Aircraft Operations                       36,217          15,467          14,019           17,669           22,886
     % Change from Year Ago                        -10.70%         -58.80%         -61.60%          -48.90%          -35.30%
     (1) Food Sales estimated by EBRC (food is not taxable in Arizona), Restaurant and Bar Sales (ADOR), and Gasoline Sales
        (EBRC).
     (2) Estimated by EBRC using gallons sold in Arizona (ADOT) and Phoenix price for regular gasoline mid-month (AAA).

    Source: University of Arizona, Eller School of Business Economics and Business Research Center

    1.2. Canadian Visitors to Arizona

    There have been 155,301 total confirmed cases of COVID-19 across Canada since the outbreak,
    equivalent to a rate of 413 per 100,000. As of September 28, 2020, there were 13,416 active cases of
    COVID-19, or 36 per 100,000. The infection rates vary across the country, with the largest number
    of confirmed cases in the provinces of Quebec and Ontario. The Canadian government has
    activated the Federal/Provincial/Territorial Public Health Response Plan for Biological Events to
    manage a coordinated response across Canada. It has developed a free COVID alert app that sends

                  Maricopa Association of Governments – Regional Economic Development
10

 a notification if a person has been near someone who has tested positive and has notified the app in
 the last 14 days.

 The Canadian government has issued a global travel advisory and is advising Canadians to avoid
 travel outside of Canada until further notice. International passenger flights are only allowed to
 land in the following four cities’ airports: Calgary, Montreal, Toronto and Vancouver.

 Canadians who travel to the U.S. for nonessential reasons are required to self-isolate for 14 days
 upon their return. While the U.S.-Canada land border is closed to nonessential traffic, Canadian
 travelers flying into the U.S. do not face any quarantine requirement or movement restrictions.

 Until recently, the lack of COVID-19 coverage in travel insurance policies for Canadians was
 considered to be a deterrent to Canadian visitors. However, as of September 18, four different
 Canadian insurance companies have announced that they will offer medical insurance policies for
 Canadian traveling to the U.S.

 Three Canadian insurance providers, Medipac, Tour+Med and Blue Cross (in Ontario and
 Quebec) offer COVID-19 medical coverage as part of their regular travel insurance plans and
 Manulife will offer coverage as of October 2020, coinciding with the start of the Canadian
 snowbird season. This is particularly important because Canadian visitors are an important
 segment of Arizona visitors. The state welcomes about 1 million Canadian visitors per year, and
 they are estimated to spend upward of $1 billion in the state. In addition, an estimated 100,000
 Canadians own a home in Arizona and spend the winter months here.

 If COVID-19 infection and hospitalization rates in Arizona do not rise, snowbirds from the
 Midwest, Northeast and from Canada should be able to return to the state this winter. Given that a
 large number of snowbirds are retirees who face a higher mortality rate and a risk of complications
 from COVID-19, the widespread availability of rapid testing and the development of an effective
 treatment (barring a vaccine) is likely to increase their comfort with traveling to the state during
 winter months.

 1.3. U.S.-Mexico Tourism

 The U.S. historically has been a key market for the Mexico tourism industry. During the period of
 January-July 2020, there were 6.79 million U.S. visitors arriving via air, representing 55.3% of the
 total international arrivals (followed by Canada 17.8%). 7 Due to COVID-19, there was a 58.4%
 reduction to the number of air arrivals of U.S. visitors in 2020. In the month of July alone, a prime

 7
     Mexican Department of Interior, Migration Policy, Registry and Identity Unit. Tourist by Country of Origin Report.

                Maricopa Association of Governments – Regional Economic Development
11
month for vacationing in Mexico, there were only 268,294 arrivals compared to 1.06 million in
2019.
According to the government of Mexico, there were 863 cruises that landed in Mexico from
January-July 2020, which represented a decrease of 50.4% compared to 2019.
The overall expenditures of international visitors in Mexico during the period of January-July 2020
was $7.21 million, which represented a decrease of 53.9% compared to the same period of 2019. 8
The average spending of international tourists traveling via air into Mexico was $1,026.40 dollars,
which represented an increase of 0.8% compared to that observed in the same period of 2019.
However, the largest drop happened from March ($1,022) to April ($747.50) and the recovery came
during the month of July.
Table 2 – U.S. Tourists Arrivals at Mexico’s Top Destinations, January-July 2020.
Destinations U.S. Visitors via Air, July 2020
Cancún, Quintana Roo 109,266
Guadalajara, Jalisco 48,251
Los Cabos, Baja California Sur 41,696
Mexico City 24,416
Puerto Vallarta, Jalisco 15,801
Source: Immigration Policy, Registration, and Identity of Persons Unit of the Mexican Ministry of the Interior.
Historical information of Visitors by Airport and by Residence, July 2020.
Airline passenger arrivals from national and international flights into Mexico from January
through June 2020 reached 19.28 million, representing a decline of 49.8% compared to the same
period in 2019 with 38.42 million passengers. 9 Total arrivals to Hermosillo, Sonora, were down by
202,776 passengers by June 2020, representing 46% fewer passengers than the same period in 2019.
Other major destinations, such as Mexico City, were down by 51%, Los Cabos by 52%, and
Cancun by 54.6%.
According to the Tourism Activity Report of the Mexican Tourism Ministry, “same day travelers
in border areas” in 2019 reached 24,936 visitors, and in 2020 only 16,105 representing a drop of
35.4%. The average expenditure of these one-day visitors is reported to be $38.70 dollars,
increasing 3.1% in 2020. Mexico’s “same day international travelers” accounted for 36,894 in the
period from January-July 2019 and 20,228 for the same period in 2020, a drop of 45.2%.
8
INEGI and Bank of Mexico, International Arrivals Survey.
9
Mexican Bureau of Airports and Auxiliary Services, Passengers and Flights Report.
Maricopa Association of Governments – Regional Economic Development12
Table 3 – Mexico’s Airports Total Passenger Arrivals
January - June Variation YoY
2018 2019 2020 2020-2018 2020-2019 2020-2018 2020-2019
Total
Passengers 36,125,958 38,427,429 19,282,932 -16,843,026 -19,144,497 -46.6% -49.8%
Source: Airports and Auxiliary Services. Mexican Ministry of Communications and Transportation, August 2020.
1.4. Arizona-Mexico Tourism
During the first seven months of 2020, the Mexican government calculates that there were 4.81
million Mexican tourists traveling to international locations, this is considered a drop of 55.7% of
those of 2019. 10
According to the Bank of Mexico and the National Institute of Statistics and Geography (INEGI)
the expenditure amount by Mexicans traveling internationally was $2.37million during January-
July 2020, less than $3.23 million in the same period in 2019 period, equivalent to an expenditure
drop of 57.7%.
The Arizona Office of Tourism Mexico Market Profile indicates that Mexican tourism in the state
were motivated to visit cultural and historical attractions. That was followed by gastronomy and
urban attractions and nightlife. In 2019, their visitation volume reached 4 million, of which 16%
stayed overnight, with each party spending an average of $839 per trip. Eighty-four percent of those
visitors visited Arizona for leisure and 16% for business.
Of those Mexican visitors who stayed overnight 61% reported staying in hotel accommodations
and 39% at a private home. The preferred location for those overnight stays was the metro Phoenix
area, followed by the Tucson metro area. Additionally, thirty-five percent of those visitors stayed
three nights and 26% only two. 11
The travel restrictions due to COVID-19 limited land border crossings in North America to
“essential travel.” This eliminated trips for individuals traveling for tourism purposes, such as
sightseeing, recreation, gambling, or attending cultural events in the U.S. This had consequences
on Arizona’s tourism industry, specifically in the local revenue from Mexican visitors.
10
Mexico Secretariat of Tourism, Tourism Activity Report, July 2020.
11
Arizona Office of Tourism, Tourism Economics, Reporting 2013-2019 VisaVUE Travel, Mexican Visitor Study.
Maricopa Association of Governments – Regional Economic Development13
The crossings at the border region between Arizona and Sonora, Mexico, are shown in the table
below. It is important to note that the land restriction to tourist will remain in effect at least until
October 21, with a high possibility to be extended. 12
Table 4 – Crossing through Arizona BPOE
Crossing Mode YTD JUNE 2019 YTD JUNE 2020 % Change
Pedestrian 3,274,945 2,308,460 -29.51%
Buses 5,861 3,535 -39.69%
Personal Vehicle 4,258,037 2,995,824 -29.64%
Source: University of Arizona, Arizona-Mexico Indicators, Bureau of Transportation Statistics, Border Crossings.
There were only 1.1 million vehicles crossing northbound, a decrease of 51.1% from the same period
in 2019.
An Uncertain Outlook for Tourism and Leisure in North America
The summer months are generally slower months, both in terms of the number of visitors and the
revenues generated from business and leisure spending in the Phoenix region. Starting in mid-
October, the improving weather generally ushers in a seasonal increase in visitors and business
travel.
However, the outlook for the seasonal return of travel and tourism spending is uncertain for the
remainder of 2020 and the beginning of 2021. Continuing concerns about contracting the virus are
likely to result in fewer people traveling for business and leisure, and hence fewer meals eaten in
restaurants. It also may mean fewer snowbirds (seasonal travelers) and business travelers returning
to Arizona, which would affect the restaurant, tourism and leisure industries. These industries rely
on the estimated $7 billion to $8 billion these visitors spend in the state. 13
Furthermore, due to reduced domestic air travel and the closure of land borders to nonessential
visitors from abroad, the tourism and hospitality sector is expected to continue experiencing lower
sales for the foreseeable future.
Once the travel restriction is lifted, Mexican visitors to Arizona will need to consider economic
factors while visiting the state. Business closures and unemployment have affected the local
economies all over the world, and deeply within Mexico, limiting the spending capability of
Mexican travelers. The cost to Mexican visitors of traveling in Arizona's major metro areas is
represented by the Arizona-Mexico Tourism Cost Index. The index is composed of three major
components of tourism expenditures: hotel room rates, gasoline prices, and food away from home.
12
University of Arizona, Arizona-Mexico Indicators, September Update.
13
The Arizona Republic, Chris Coppola, “Tracking snowbirds’ financial impact in Valley Tricky” January 19, 2015.
Maricopa Association of Governments – Regional Economic Development14
In August 2019, the Phoenix Metro area index was $262.52, while the same month in 2020 was
$293.64, a cost increase of 11.85%. The price data is seasonally adjusted then converted to Mexican
pesos using the monthly U.S. dollar exchange rate. 14 The Tucson metro area also showed a 9.86%
increase in cost, from $245.38 in August 2019 to $269.57 in August 2020.
Figure 2 – Mexican Peso per $1 U.S. Dollar Exchange Rate
30
25
Mexican Pesos (MX)
20
15
10
5
0
Source: University of Arizona, Economics and Business Research Center
Additionally, the fluctuation in the foreign exchange rate for pesos per dollar has a great impact on
Mexican tourism in Arizona. Due to the impact on the global economy, the exchange rate in
January was $18.84 Mexican pesos per U.S. dollar. This exchange rate remained steady for most of
2019 until reaching a historical high in the month of March of $24.17 Mexican pesos per U.S.
dollar. However, eventually this number came down to $22.20 pesos in August.
14
University of Arizona, U.S.-Mexico Economic Indicators, Mexico Tourism Cost Index.
Maricopa Association of Governments – Regional Economic Development15
Phoenix Sky Harbor Airport, the largest in
Arizona, has 23 international nonstop
destinations, 15 nine of them to Mexico. This
could be an area of opportunity for effectively
marketing Arizona in Mexico. The Arizona
Office of Tourism has undertaken significant
efforts to communicate across the different
sectors and government to promote economic
recovery for this industry. One example is the
marketing of the virtual Official State Travel
Photo courtesy Phoenix SkyHarbor Airport
Guide 2020-2021 to appeal to international and
domestic visitors.
Table 5 – Phoenix Sky Harbor Airport Non-Stop Flights to Mexico
City State
Culiacan Sinaloa
Cancun Quintana Roo
Chihuahua (Newly added 16 in 2019) Chihuahua
Guadalajara Jalisco
Hermosillo Sonora
Mexico City Mexico City
Mazatlán Sinaloa
Puerto Vallarta Jalisco
Los Cabos Baja California Sur
Due to the large impact on the tourism industries in North America, the best strategy is to continue
to work to strengthen North American collaboration and standardization of sanitation guidelines to
reduce the spread of the virus and regain the confidence of employers and travelers. As the
economic activity in both countries slowly resumes, it is to be expected that cross-border tourism
will regain force.
An example of how collaboration and innovation can lead us to a fast recovery is the Arizona
Lodging and Tourism Association’s creation of a unified standard for safety and cleanliness, which
builds upon “various sanitation best practices and recommendations from national hospitality and
public health experts and various hotel brands” called AZSAFE + CLEAN Hotel guidance.
15
Phoenix Sky Harbor, International Destinations.
16
Phoenix Sky Harbor, Press Releases, January 2020.
Maricopa Association of Governments – Regional Economic Development16
Another example is the Southwest Tourism Expansion Act 17, a federal legislative effort to extend
the border crossing card zone statewide for Mexican visitors. The current border crossing card zone
is 75 miles. Extending the zone means an additional $181 million in new spending to the state of
Arizona each year going forward.
The Border Crossing Card (BCC) is a visitor
visa expedited by the U.S. Department of
State. The visitor visas are nonimmigrant visas
for persons who want to enter the United
States temporarily for business (visa category
B-1), for tourism (visa category B-2), or for a
combination of both purposes (B-1/B-2). The
BCC is both a BCC and a U.S. nonimmigrant
visa (B1/B2) designed for Mexican citizens.
Holders of the border crossing card are some of
the most vetted visitors to the United States Specimen of the U.S. Border Crossing Card, issued by the
U.S. State Department.
and are at low risk for overstays. This is an
opportunity to grow the state’s tourism. Statewide extension will mean greater opportunities for
tourists to enjoy the entirety of our state’s scenery, cultures, and amenities.
In December 2019, the Southwest Tourism Expansion Act was introduced in the United States
Congress. This bill (HR 5405) is the result of the Maricopa Association of Governments’ (MAG)
efforts to improve the state and regional economy by allowing for statewide travel of Mexican
visitors who have a Border Crossing Card once the travel restrictions are lifted.
Ultimately, a return to pre-pandemic spending levels are likely to depend on developing a widely
available vaccine combined with an effective treatment for COVID-19. These are two key factors
needed to make the general public comfortable with traveling and patronizing restaurants, bars, as
well as sports and concert venues. Such developments would finally allow the state’s economy to
fully recover.
17
116th Congress “Southwest Tourism Expansion Act” H.R. 5405
Maricopa Association of Governments – Regional Economic Development17
2. ARIZONA – CANADA TRADE
2.1. Arizona-Canada Exports
Mexico and Canada are Arizona's largest
trading partners. Combined, they account for
43.6% of the trade footprint, a footprint that
has grown steadily over the past decade.
Arizona’s trade with Canada was $4.77 billion
for 2019, with exports of $2.15 billion and
imports of $2.62 billion. Exports to Canada
have been holding steady since 2015, ranging
between $2.1 and $2.3 billion annually.
Figure 3 – Arizona Exports to Canada
2,500
Exports in U.S. $ Millions
2,000
1,500
1,000
500
0
2015 2016 2017 2018 2019
Source: International Trade Administration, U.S. Department of Commerce
The value of exports from Arizona to Canada for the first two quarters of 2020 was $1.04 billion, a
13% decrease from $1.2 billion from the first half of 2019.
Maricopa Association of Governments – Regional Economic Development18
Figure 4 – Total Arizona Exports to Canada
1,400
1,200
1,200
1,045
Exports in U.S. $ Millions
1,000
800
600
400
200
0
YTD JUNE 2019 YTD JUNE 2020
Source: International Trade Administration, U.S. Department of Commerce
Arizona’s top exports to Canada during the first half of 2020 were agricultural products, computer
and electronic products, transportation equipment, machinery, and electrical equipment.
Figure 5 – Top 5 Arizona Exports to Canada by Industry
350
313.931
303.430
300
244.429
250
Exports in U.S. Millions
200 185.964
169.182
150.736
141.647
150 123.193
93.028
100 77.056
50
0
AGRICULTURAL COMPUTER AND TRANSPORTATION MACHINERY; EXCEPT ELECTRICAL
PRODUCTS ELECTRONIC EQUIPMENT ELECTRICAL EQUIPMENT;
PRODUCTS APPLIANCES &
COMPONENTS
YTD June 2019 YTD June 2020
Source: International Trade Administration, U.S. Department of Commerce
Maricopa Association of Governments – Regional Economic Development19
With the exception of agricultural products, the other categories experienced year-over-year
decreases in exports to Canada. Machinery exports showed the largest decreases of 27%, followed
by computer and electronic exports with a 24% decrease. Electrical equipment exports decreased
year-over-year by 17% and transportation equipment was a relatively small decrease of 6%.
2.2. Arizona-Canada Imports
Imports from Canada were relatively steady between 2015 and 2018 before growing more than
70% in 2019.
Figure 6 – Total Arizona Imports from Canada
3,000
2,500
Imports in U.S. $ Millions
2,000
1,500
1,000
500
0
2015 2016 2017 2018 2019
Source: International Trade Administration, U.S. Department of Commerce
Arizona’s imports from Canada totaled $2.624 billion in 2019. For the first two quarters of 2020,
imports from Canada totaled $1.084 billion, a 74% year-over-year increase from the first half of
2019.
In addition, with the exception of April 2020 when there was a year-over-year decrease in imports
of 21.7%, monthly imports were significantly higher from January 2020 through June 2020
compared to the prior-year periods. Arizona’s strong growth in imports from Canada was a stark
contrast to the national trend of sharp decreases in Canadian imports.
Maricopa Association of Governments – Regional Economic Development20
Table 6 – Imports from Canada 2020 ($ Millions)
Jan-20 Feb-20 Mar-20 Apr-20 May-20 Jun-20 Jul-20
Arizona $156.6 $311.0 $212.4 $98.8 $176.9 $128.7 $116.5
% Change from Year Ago 28.16% 198.90% 46.95% -21.67% 45.89% 3.73% 4.56%
U.S. Total $25,381.3 $24,346.7 $25,124.3 $14,975.6 $15,869.7 $20,357.5 $22,340.5
% Change from Year Ago 8.52% 5.45% -9.45% -44.04% -45.71% -26.48% -16.63%
Source: International Trade Administration, U.S. Department of Commerce
Initial analysis indicates aircraft parts, electric machinery, iron materials, minerals, wood products
and agricultural products were the product categories driving the sharp increases in imports from
Canada. This increase likely is due to strong industrial demand and the completion of purchase
contracts that predated the COVID-19-driven shutdowns. This increase likely is a reflection of
Arizona’s strong economy and robust manufacturing in aerospace and defense, and in residential
and commercial construction, particularly in the Phoenix region.
Figure 7 – Total Arizona Imports from Canada
1,200 1,084
1,000
Imports in U.S. $ Millions
800 742
600
400
200
0
YTD JUNE 2019 YTD JUNE 2020
Source: International Trade Administration, U.S. Department of Commerce
Maricopa Association of Governments – Regional Economic Development21
Figure 8 – Top Arizona Imports from Canada by Industry
450
400
350
300
Imports in U.S. $ Millions
250
200
150
100
50
0
GOODS RET TO CA TRANSPORTATION MACHINERY; WOOD PRODUCTS COMPUTER AND
(EXP); US GOODS EQUIPMENT EXCEPT ELECTRICAL ELECTRONIC
RET & REIMPS (IMP) PRODUCTS
YTD June 2019 YTD June 2020
Source: International Trade Administration, U.S. Department of Commerce
The Phoenix region entered the year in a very strong position in key sectors: booming residential
and commercial construction, strong home sales (with shortages of inventory), growth in the
financial and healthcare services sectors, and very robust increases in population from migration
from other parts of the U.S.
While most of the region’s sectors suffered significantly from voluntary lockdown measures,
particularly the leisure and hospitality sector, the construction sector was deemed an essential
service and was not disrupted. Employees in the finance and insurance sectors were mostly able to
work from home.
Maricopa Association of Governments – Regional Economic Development22
3. ARIZONA-MEXICO TRADE
In 2019, Mexico was the United States’ second
largest export market for goods and accounted
for more than half of total goods exported from
Arizona, New Mexico, and Texas. Nationally,
Canada and Mexico together bought one third
of all U.S. goods exported in 2019.
The U.S. Department of Homeland Security’s
U.S. Customs and Border Protection agency
(CBP) facilitates lawful international travel and
trade in the United States. There are 10 Ports
of Entry in Arizona. 18 These include Douglas, Lukeville, Naco, Nogales, Phoenix, San Luis,
Sasabe, and Tucson, as well as locations at the Phoenix-Mesa Gateway and Scottsdale airports.
CBP combines customs, immigration, border security, and agricultural protection into one
coordinated and supportive activity.
In 2019, total exports through the main six Arizona Border Ports of Entry (BPOE) reached $11.70
billion, and imports accounted for $17.25 billion. The latest data suggest that in the period of
January through July 2020, there was a reduction in these trade flows as shown in the table below.
Table 7 – Total Exports and Imports through Arizona BPOE (U.S. $ Millions)
Total YTD July Total YTD July Percent
Commodities
Total BPOE 2019 Total BPOE 2020 Change
Imports 11080.07 9893.91 -10.70%
Exports 7079.08 5654.41 -20.12%
Source: University of Arizona Monthly U.S. Imports and Exports to Mexico by AZ BPOE, U.S. Census Bureau
obtained via USA Trade Online.
Notably, the port with the highest trade flow in the state of Arizona is the Mariposa Cargo
Facility 19, located at the Nogales BPOE. In 2019, the trade flow through the Nogales BPOE
reached $26.294 billion worth of commodities. In 2020, the exports through Nogales from January
through July decreased 21% compared to the same period in the prior year. Imports also decreased
by 12%.
18
U.S. Customs and Border Protection, Arizona’s Ports of Entry.
19
U.S. Customs and Border Protection, Nogales POE.
Maricopa Association of Governments – Regional Economic Development23
Table 8 – Total Exports and Imports through Nogales BPOE (U.S. $ Millions)
Commodities YTD July 2019 TYD July 2020 % Change
Imports 9824.95 8598.05 -12.48%
Exports 6316.25 4978.64 -21.17%
Source: University of Arizona Monthly U.S. Imports and Exports to Mexico by AZ BPOE, U.S. Census Bureau
obtained via USA Trade Online.
3.1. Arizona-Mexico Exports
Arizona’s exports mean sales. The exporting companies in the state of Arizona sell goods and
services around the world. Exporting supports the local economies as it diversifies the customer
base and grows business’ bottom line. However, exporting is a competitive task and changes in the
global market affect these sales immediately. Exporting business in Arizona have found that North
America is a reliable and profitable market. As this paper illustrates, Mexico is Arizona’s first
export destination. In 2019, Arizona exported $8.18 billion worth of products to Mexico, holding a
steady trend since 2015.
Figure 9 – Arizona Total Exports 2015–2019
10,000 9,162.004
9,000 8,285.205 8,186.534
7,575.908 7,653.011
8,000
(U.S. $ Millions)
7,000
6,000
5,000
4,000
3,000
2,000
1,000
0
2015 2016 2017 2018 2019
Source: International Trade Administration, U.S. Department of Commerce
Maricopa Association of Governments – Regional Economic Development24
Figure 10 – U.S. Exports to Mexico
140,000 129,473.629
120,000
99,034.618
100,000
(U.S. $ Millions)
80,000
60,000
40,000
20,000
0
YTD(JUN) 2019 YTD(JUN) 2020
Source: International Trade Administration, U.S. Department of Commerce
The United States exports to Mexico in the period of January through June 2020 totaled $99.03
billion, a drop of more than $30 billion from the same period in 2019.
Arizona’s main export market destination is Mexico, followed by Canada and China. As described
in the chart below, there is a sharp contrast in the reduction of exports to Mexico compared to the
exports to the other two main partners when comparing the period of January through June in
2018 and 2019 to the same period in 2020.
Figure 11 – Arizona’s Top Exporting Destinations
4,500
4,000
3,500
(U.S. $ Millions)
3,000
2,500
2,000
1,500
1,000
500
0
YTD(JUN) 2018 YTD(JUN) 2019 YTD(JUN) 2020
Mexico Canada China
Source: International Trade Administration, U.S. Department of Commerce
Maricopa Association of Governments – Regional Economic Development25
The month of April showed a significant drop in the state’s total exports to Mexico to $213.7
million, or a decline of 32.1%.
Similarly, Arizona’s manufacturing products exports dropped 41.5% in April, a decline of 44.9%
from its value a year ago. 20 However, during the months of June and July, there is an increase of
manufacturing export commodities, reaching almost the same amounts as the month of February
2020.
Figure 12 – Arizona Manufacturing Exports to Mexico
600
500
(U.S. $ Millions)
400
300
200
100
0
January February March April May June July
2019 537.335 484.679 515.909 547.950 554.319 501.432 511.572
2020 525.259 498.988 516.130 301.801 300.501 417.876 483.178
2019 2020
Source: University of Arizona, US Census Bureau via USA Trade Online
Data show that the biggest exports during the first half of 2020 were minerals and ores, followed by
computer and electronic products, electrical equipment, transportation equipment and plastics and
rubber products. There is a notable decrease in the most prominent exports compared to the same
period in 2019.
20
University of Arizona, Arizona Trade During Global Pandemic.
Maricopa Association of Governments – Regional Economic Development26
Figure 13 – Top Arizona Exports to Mexico by Industry
1,000
900
800
700
(U.S. $ Millions)
600
500
400
300
200
100
0
MINERALS & ORES COMPUTER AND ELECTRICAL TRANSPORTATION PLASTICS & RUBBER
ELECTRONIC EQUIPMENT; EQUIPMENT PRODUCTS
PRODUCTS APPLIANCES &
COMPONENTS
YTD (June) 2019 YTD (June) 2020
Source: International Trade Administration, U.S. Department of Commerce
Arizona’s total exports from January through June decreased by more than $700 million in the
same period in 2019. Arizona is not alone among border states in experiencing a decrease in
exports. Arizona experienced a decline of 21.85%, while Texas and California also presented a
drop of 23.40% and 21.85% respectively. However, New Mexico showed an increase in exports to
Mexico of 11.18%.
Table 9 – Border States Exports to Mexico
U.S.-Mexico Border State YTD (June) 2019 YTD (June) 2020 YoY
California 14428.31 11275.58 -21.85%
Arizona 4175.11 3409.09 -18.34%
New Mexico 976.89 1086.13 11.18%
Texas 54035.67 41387.56 -23.40%
Source: International Trade Administration, U.S. Department of Commerce.
The most common freight transportation modes in North America are trucking and rail. As
illustrated in the table on the following page, the truck crossing between Arizona and Mexico
showed a decrease of less than 5% in July 2020 compared to the prior year. The largest impact was
in commodities transported via rail, decreasing almost by 17% from the previous year.
Maricopa Association of Governments – Regional Economic Development27
Table 10 – Commercial Crossing through AZ BPOE
Mode YTD (June) 2019 YTD (June) 2020 YoY
Truck Crossing 250,396 239,977 -4.16%
Train Crossings 377 314 -16.71%
Source: EBRC, Research and Innovative Technology Administration, Bureau of Transportation Statistics, U.S.
Dept. of Transportation.
3.2. Arizona-Mexico Imports
As Arizona exports into Mexico are a key revenue and job source for local economies, it also is
important to mention that the state purchases products and services from Mexico. These imports
tend to be nonexistent or scarce local products and services purchased a competitive price. For the
last 5 years, Arizona has imported more than $41.28 billion worth of commodities, as shown in the
table below.
Figure 14 – Arizona Imports from Mexico 2015-2019
10,000 9,005.058 9,302.137
9,000
7,640.550 7,893.118
8,000 7,447.049
7,000
(U.S. $ Millions)
6,000
5,000
4,000
3,000
2,000
1,000
0
2015 2016 2017 2018 2019
Source: International Trade Administration, U.S. Department of Commerce
However, due to COVID-19 containment measures taken in the beginning of the year, the
Arizona-Mexico Economic Indicators state that Arizona’s manufactured imports from Mexico
decreased 43.3%.
Maricopa Association of Governments – Regional Economic Development28
Figure 15 – Arizona Manufacturing Imports from Mexico
1,200
1,000
U.S. $ (Millions)
800
600
400
200
0
January February March April May June July
2019 2020
Source: University of Arizona, US Census Bureau via USA Trade Online
There were $1.4 billion worth of fresh produce imports from January through June, a drop of only
4.6% compared to 2019. With the exception of the agricultural products and the fact that the
Arizona imports of Primary Metal Manufacturing (MFG) segment doubled in size, electrical
equipment, computer, and electronic products, some of the major Arizona imports from Mexico,
show a sharp reduction in numbers in the period of January through June 2020. Transportation
equipment saw a reduction of $155.67 million. This may be related to the shutdown of operations
of the Mexican manufacturing industry from April to the beginning of June 2020.
Figure 16 – Arizona Imports from Mexico by Industry
2,500
2,000
(U.S. $ Millions)
1,500
1,000
500
0
AGRICULTURAL ELECTRICAL COMPUTER AND TRANSPORTATION MACHINERY; EXCEPT
PRODUCTS EQUIPMENT; ELECTRONIC EQUIPMENT ELECTRICAL
APPLIANCES & PRODUCTS
COMPONENTS
YTD(JUN) 2019 YTD(JUN) 2020
Source: International Trade Administration, U.S. Department of Commerce
Maricopa Association of Governments – Regional Economic Development29
4. MEXICO ESSENTIAL BUSINESS
4.1. Mexico’s Reopening Guidelines
Concerns expressed by business interests on both sides of the U.S.–Mexico border led the Mexican
Ministry of Health and the Ministry of Economy to issue “The New Normality. Strategies for the
reopening of social, educational, and economic activities.” 21 This was the government of Mexico’s
plan to reopen activities. These activities include construction, mining, and the manufacturing of
transportation equipment, which include the automotive and aerospace industries.
The plan involved three stages; the first stage started on May 18, 2020, and included the reopening
of the Municipalities of Hope, those businesses without a reported case of COVID-19, and
businesses that do not neighbor municipalities affected by the virus. There were 269 municipalities
in 15 states where workplaces, schools, public areas were allowed to open.
The second stage ran from May 18 -31, 2020, and the government announced the protocols to be
followed to guarantee a safe return to economic activities. 22 This involved the training of workers
from mid-May to the beginning of June to start operations at a reduced capacity.
Mexican Government “Susana Distancia” and “Semaforo COVID-19” marketing campaign.
The third stage of the essential business plan established that on June 1, 2020, a biweekly traffic-
light-style monitoring system will be in place to guide each state in Mexico to proceed to the next
phase of the country’s reopening plan.
21
Mexican Ministry of Economy, New Normally Plan.
22
Foley Arena, Publications, Mexican Government, Back to Work Check List.
Maricopa Association of Governments – Regional Economic Development30
The COVID-19 traffic light monitoring system comprises four colors based on the contagion risks
per state:
Table 11 – Mexico’s COVID-19 Traffic Light Monitoring System
Maximum High Medium Low
Only essential In addition to essential economic All work activities are allowed, with All activities
economic activities activities, companies of nonessential maximum care measures to prevent are allowed,
allowed. economic activities will be allowed the spread of COVID-19. including
to work at 30% operation capacity, school
People allowed to with maximum care measures to Open public space allowed reopening.
go for a walk prevent the spread of COVID-19. regularly, and closed public spaces
outside their Open public spaces allowed at a can be opened with reduced
residence only. reduced capacity. capacity.
4.2. COVID-19 Effects on Mexico’s Manufacturing Exports
Mexico’s response to COVID-19 emergency included the closure of nonessential businesses, and
non-health related manufacturing commodities were classified as such. The closure of automotive
plants in Mexico began March 23 until May 31. Due to the sudden disruption, the automotive
industry production decrease was not immediately offset by another sector.
The Mexican National INDEX Export Industry Analysis 23 indicates that the largest negative
impact caused by COVID-19 in the export manufacturing industry was related to employment.
This was seen in states where there is a larger number of Maquiladora, Manufacturing and Export
Services Industry (IMMEX) plants, such as Baja California, Coahuila, Chihuahua, Nuevo León
and Tamaulipas.
The analysis also states that there is a strong tie between the United States and Mexico production
and exports rates. While the lowest peak of the United States industry occurred in April, in
Mexico’s IMMEX’ plants it occurred in May.
The structure of IMMEX exports during the first five months of 2020 was:
• Manufactured goods 87.8%,
• Petroleum products 4.5%
• Non-oil extractive products 1.8%
23
INDEX Industry Analysis, August 2020.
Maricopa Association of Governments – Regional Economic Development31
In May, the overall production shutdown of the manufacturing industry due to COVID-19 affected
non-oil exports, those targeting the United States at a drop of 57.2% at an annual rate and those
channeled to the rest of the world by a decrease of 51.8%. The most important annual reductions
were in:
• Automotive products (-90.1%)
• Rubber and plastic products (-50.8%)
• Electrical and electronic equipment and devices (-51.7%)
• Professional and scientific equipment (-45.8%)
• Machinery and special equipment for various industries (-42.4%)
The annual decline in exports of automotive products was the result of reductions of -90.7% in
pipelined sales to the United States and -86.7% in those targeted to other markets.
According to the industry analysis in May, Mexico’s total domestic exports reached $18.06 billion,
from which IMMEX's exports accounted for 63.9%. IMMEX exports began to stabilize as
companies resumed their operations following the government of Mexico’s “New Normality” plan
that included manufacturing sector as essential business.
4.3. Most Impacted: Automotive Industry
In March 18, General Motors, Ford, Fiat Chrysler, Honda, Toyota, and Audi announced
temporary suspensions at their Mexican plants. Two days later, Nissan and Volkswagen joined the
list, to be followed by BMW and Mazda. This created a domino effect as Tier 1 suppliers, such as
windshield, tire manufacturers Pirelli, Michelin, and Bridgestone also started shutting down their
plants.
In Mexico, under strict health protocols to protect workers from COVID-19, some IMMEX plants
began operations in mid-May and others started in June. Although the automotive sector was
reactivated in June, there was a heavy consequence in the world market.
Due to COVID-19, Mexico was the most affected supplier-exporter of lightweight vehicles in the
U.S. market, at least in May, falling 94.5%, which was comparatively higher than its competitors.
As example, INDEX states that Korea decreased only 0.8%, Japan had a 19% reduction, and
Germany fell 45%.
The Mexican Association of the Automotive Industry (AMIA) stated that in the month of May,
only 1.2% of autos in the United States were manufactured in Mexico, whereas a few months
before they reached 16%. This meant that only 1 of each 100 vehicles purchased in the United
States came from Mexican exports; the remaining countries did not suffer reductions above 50%.
Maricopa Association of Governments – Regional Economic DevelopmentYou can also read