COVID-19: Modelling Update - January 14, 2021 - Saskatchewan Union Of Nurses
←
→
Page content transcription
If your browser does not render page correctly, please read the page content below
COVID-19: Modelling Update

       January 14, 2021

                             1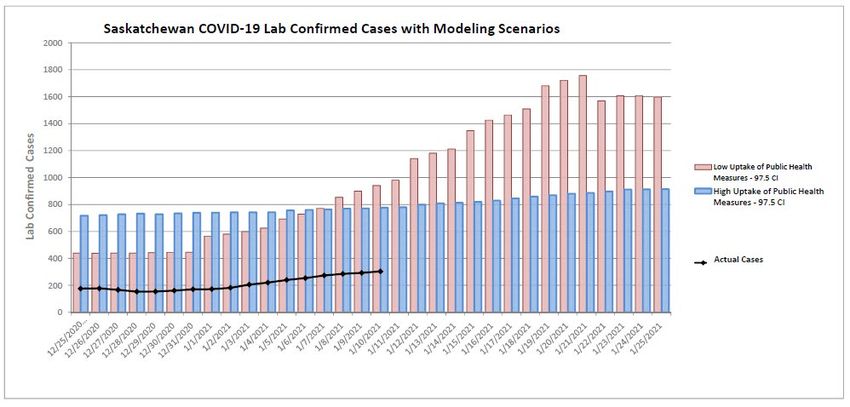
• Modelling cannot predict what will happen.
• It tells us what could happen over the next six
  months, based on actions taken.
• It supports decision makers by comparing the
  potential impact of public health measures and
  behaviour changes.
• Goal: to make the best policy decisions based on
  public health information, keeping children in
  school, and not exceeding the health system’s
  capacity to care for both COVID-19 and non-
  COVID-19 patients.
Assessing our Situation:
 COVID- 19 Indicators

                           3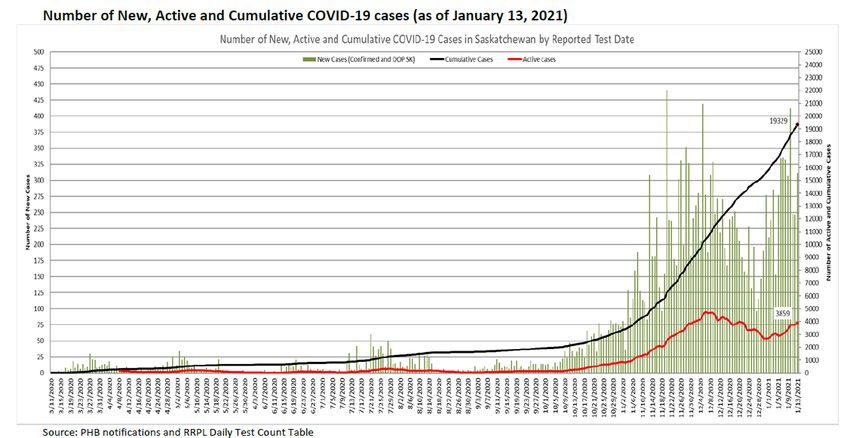
Saskatchewan’s Epidemic Curve
Mar 11, 2020 – Jan 13, 2021 (19,329 cases)

                                      Total

                                     Active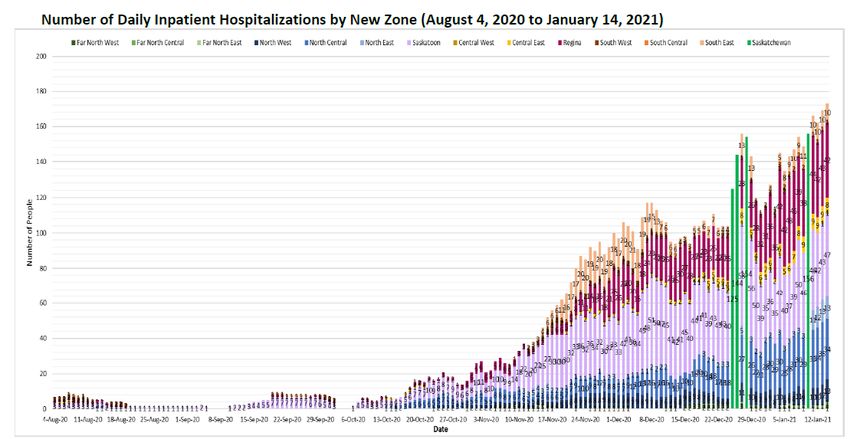
COVID-19 Active Cases per 100,000
                                         To date:
                                         • 19,329 total
                                            cases
                                         • 3,859 active
                                            cases
                                         • 781 hospitalized
                                              (169 in ICU)
                                         • 206 deaths
                                            (1.1% fatality
                                            rate)

                        Source: Public Health Agency of Canada, Jan 14,
                        2021 https:https://health-infobase.canada.ca/covid-
                        19/epidemiological-summary-covid-19-
                        cases.html?stat=rate&measure=active#a2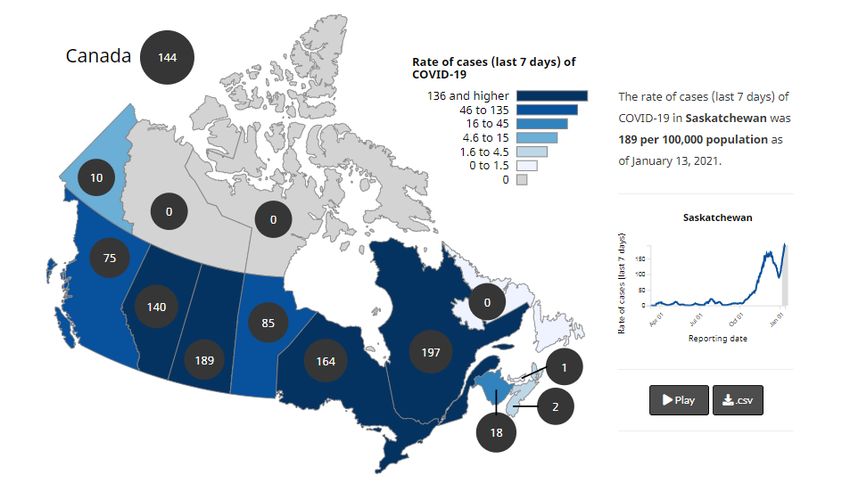
COVID-19 Rate per 100,000,
Last 7 Days (Jan 7, 2020-Jan 13, 2021)
                                              In the last seven
                                              days :
                                              • 2193 cases
                                              • 25.9/100,000
                                                  avg 7 day new
                                                  case rate
                                              • 75 new
                                                  hospitalizations
                                                  13 new ICUs
                                              • 22 deaths

                           Source: Public Health Agency of Canada, Jan 14,
                           2021 https:https://health-infobase.canada.ca/covid-
                           19/epidemiological-summary-covid-19-
                           cases.html?stat=rate&measure=total_last7#a2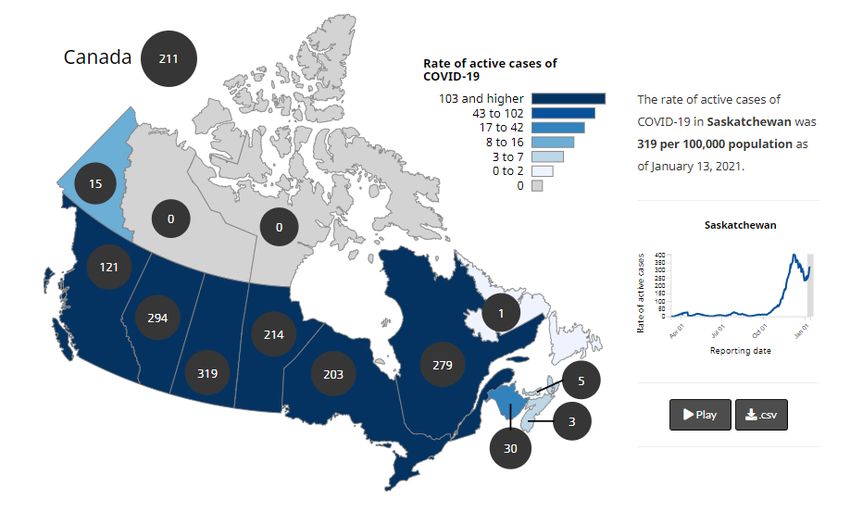
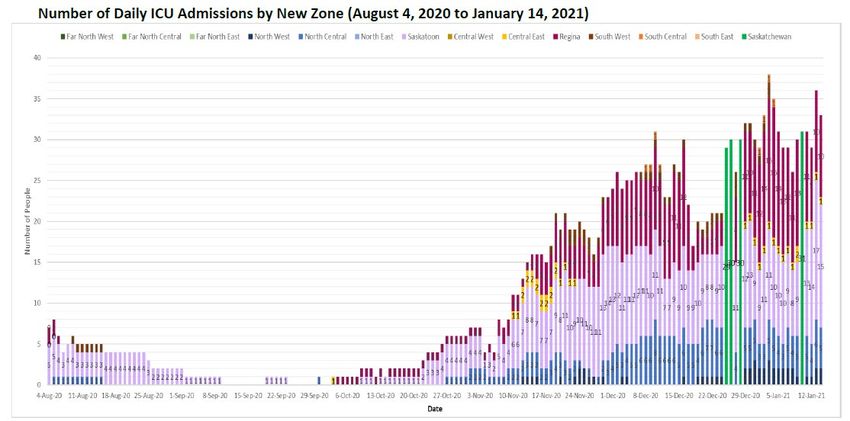
COVID-19 Hospital and ICU Case Census,
       Aug 4, 2020 – Jan 14, 2021

Hospitalization

           ICU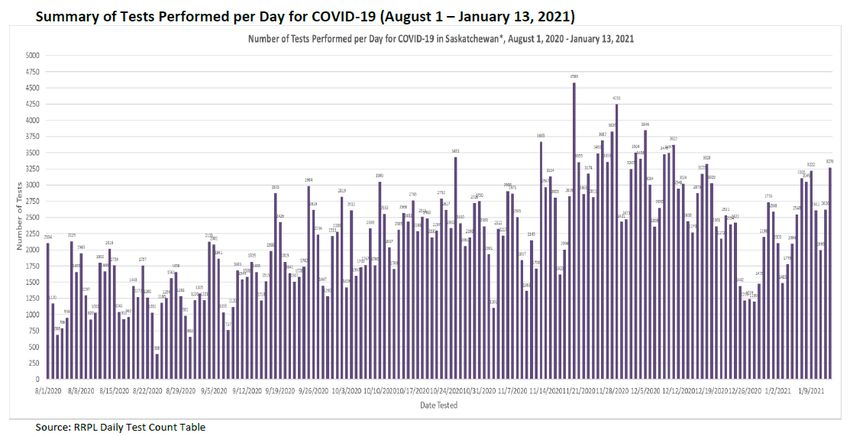
Provincial COVID-19 Testing, Aug 1, 2020 to Jan 13, 2021

                                                Available with
                                                daily dashboard
                                                posting at
                                                Saskatchewan.ca/
                                                covid19
Indicator Summary (Jan 5 -Jan 11, 2021)
Indicator Summary ( Jan 5 – Jan 11, 2021)
Area Epidemic Curves, Mar 11 – Jan 10
                     200   Far North                      200       North
                     160                                  160

                                            Number of cases
   Number of cases
                     120                                  120
                     80                                       80
                     40                                       40
                      0                                        0

                            Reported date                           Reported date

               200         Saskatoon                          200   Regina
               160

                                            Number of cases
                                                              160
  Number of cases

               120                                            120
                     80                                        80
                     40                                        40
                      0                                         0

                            Reported date                           Reported date

                     200    Central                           200   South
                     160
                                            Number of cases

                                                              160
  Number of cases

                     120                                      120
                      80                                       80
                      40
                                                               40
                       0
                                                                0

                            Reported date                           Reported date
COVID-19 Hospital, ICU and Deaths
by Age Groups (to Jan 10, 2021)
Number of hospitalization, ICU and deaths, to Jan 10, 2021
Number of
Number of cases Number of
Age group cases ever in
ever hospitalized Deaths
ICU
19 and under 18 1 0
20 to 39 99 11 11
40 to 59 178 59 13
60 to 79 265 76 62
80+ 190 17 113
Total 750 164 199Hospitalization and Death Rate (%) by Age Based on
Cumulative COVID-19 Cases to Jan 7, 2021
Saskatchewan Canada
Hospitalization and death rate (% ) by age group, as of Hospitalization and death rate (% ) by age group, as
January 7, 2020 of January 7, 2021, 2020
Age # Rate (%) # % Age # Rate (%) # %
group Hospitalized Hospitalized Deaths Death group Hospitalized* Hospitalized Deaths Death
0-19 17 0.5% 0 0.0% 0-19 440 0.5% 0 0.0%
20-39 89 1.5% 9 0.1% 20-39 2482 1.4% 0 0.0%
40-59 164 3.8% 11 0.3% 40-59 5974 4.1% 321 0.2%
60-79 247 11.3% 54 2.5% 60-79 11841 16.8% 3862 5.5%
80 + 164 21.3% 100 13.0% 80 + 10727 24.0% 10773 24.2%
SK 681 4.1% 174 1.0% SK 31464 6.1% 14956 2.9%
Data source: Panorama, January 7, 2021 Data source: Stat Canada, January 7, 2021
* Cumulative total includes unknown/unspecified casesCOVID-19 Hospital and ICU
by Age - Jan 5, 2021
Number of current hospitalization and ICU, Jan 5, 2021
Number of cases Number of cases in
Age group
hospitalized ICU
19 and under 3 0
20 to 39 21 3
40 to 59 30 12
60 to 79 66 14
80+ 42 1
Total 162 30COVID-19 Exposures by Type
(to Jan 10, 2021)
Cases Total Cases to
Jan 4 – Jan 10, 2021 Date from March
Health Care Workers 43 869
International Travel 0 157
Domestic Travel 4 149
Health Care Setting 40 194
Congregational/Communal Living Setting 0 751
Mass Gatherings 8 269
Workplace 29 414
Household Exposure 125 1662
Social Exposure 65 567
Public Facilties 14 307
School/Daycare 0 72
Unknown/Not identified 496 4696
Pending 1423 4311
Note: case totals are more than the reported total of cases as HCWs may also
be counted in other exposure categories, depending on exposure.COVID-19 Cases with Unknown and
Pending Exposure (Oct 1 to Jan 3, 2021)
Number of cases with exposure unknown, pending and no identified exposure,
Oct 1 – Jan 10, 2021
Year Month Week # Unknown No identified exposure Pending
2020 October 40 5 2
41 35 4
42 26 24
43 1 72 22
44 107 24
November 45 1 172 62
46 6 269 206
47 5 373 186
48 10 523 171
49 5 123 40
December 49 8 337 123
50 20 438 267
51 15 318 606
52 12 333 438
53 31 171 389
2021 January 1 4 99 229
2 205 288 1091
3 137 11 261
Grand Total 460 3700 4145COVID-19 Outbreaks (Jan 4-10)
Outbreak settings * Confirmed outbreaks
Special care homes (incl. private, affiliates) 2
Personal care homes
Hospital (acute, rehab) 1
Communal/congregate living 3
(group/retirement homes/apartment building)
Shelter
Places of worship
Community events (funerals, weddings, casino)
Restaurant/bar 3
House gatherings 1
Team sports/fitness centres
Community wide (remote or geographically defined)
Store (small grocery)
Correctional facilty
Workplace 6
retail/grocery
manufacturing/assembling/food processing 2
corrections/policing 1
office 1
food service (restaurant, fast food, bar)
health facility (LTC, PCH, acute) 1
mining
Retirement home 1
other (day care, grooming/fitness centre)
*Description (excludes schools and child care centres)
18 new outbreaks were reported in the weeks of January 4-10Mean, Median, Range of Contacts per Case
Past Two Weeks (Dec 21- Jan 3, 2021)
Mean, median, range contacts per case past 2 weeks
Dec 21 - Jan 3, 2021
CLOSE contacts per ALL contacts per case
Measure
case past 2 weeks past 2 weeks
Mean 4.4 5.5
Median 3.0 4.0
Range 1-35 1-75
*Includes contacts of cases reported in the last 2 weeks, Dec 6 to 20, 2020
*Summarized by source (case) Zone - cases out of province or country are excluded.
*Includes cases who named at least one contact
*ALL contact types include close, non-close, not a contact, and missing exposure types.COVID-19 Modelling Update
Scenarios
19Impact of Public Health Measures on Lab Confirmed
Cases - Based on Trends of Dec 25-Jan 12
Modelling chart
includes holiday
season trend.
Rate of growth
depends on
degree of
update of public
health
measures.
CEPHIL Agent Based Model study results with 95% quantile
SK COVID-19 Modelling Initiative – Joint partnership between U of S CEPHIL lab, SHA and the MOHImpact of Public Health Measure on Hospital Census
Based on Trends Dec 25-Jan 12
Modelling chart
includes holiday
season trend.
Hospital census
changes lag
behind changes to
cases by 1-2
weeks.
Rate of growth
slower with higher
uptake of public
health measures.
CEPHIL Agent Based Model study results with 95% quantile
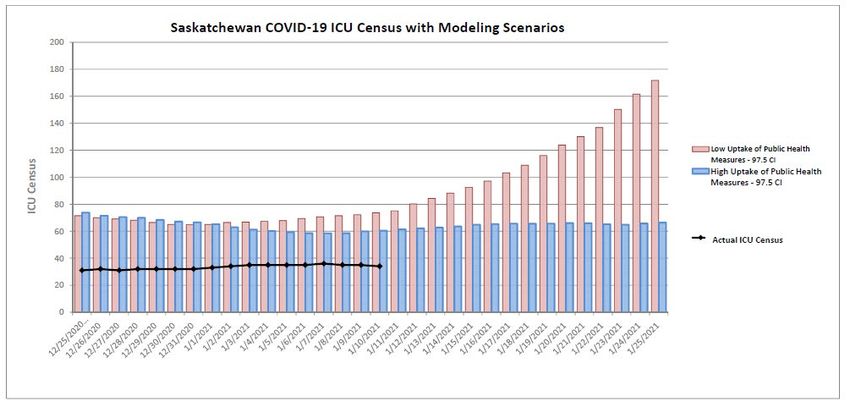
SK COVID-19 Modelling Initiative – Joint partnership between U of S CEPHIL lab, SHA and the MOHImpact of Public Health Measures on ICU Census
Based on Trends Dec 25-Jan 12
Modelling chart
includes holiday
season trend.
ICU census changes
lag behind cases by
1-2 weeks and
hospital census by
another week.
Rate of growth
depends on degree
of update of public
health measures.
CEPHIL Agent Based Model study results with 95% quantile
SK COVID-19 Modelling Initiative – Joint partnership between U of S CEPHIL lab, SHA and the MOHThe actions taken by the people of Saskatchewan collectively
will determine the outcomes.
Simple measures reduce the risk of infection:
• Follow the mandatory mask order
• Physically distance
• Reduce close contacts and non-essential travel
• Outdoors is better than indoors
• Washing hand/sanitizing often
• Abide by the public health guidelines in every public
space
Public Health Order is available at
saskatchewan.ca/COVID19You can also read