A FRAMEWORK FOR ASSESSING PERTURBATIVE METHODS FOR PROTECTION OF CENSUS 2021 DATA AT STATISTICS PORTUGAL - UNECE
←
→
Page content transcription
If your browser does not render page correctly, please read the page content below
« A FRAMEWORK FOR ASSESSING
 PERTURBATIVE METHODS FOR
 PROTECTION OF CENSUS 2021 DATA
 AT STATISTICS PORTUGAL

 Inês Rodrigues (ines.rodrigues@ine.pt) «
 Paula Paulino, Pedro Campos, Teresa Fragoso

 Work Session on Statistical Data Confidentiality
 The Hague, Netherlands
 29 - 31 October 2019
 «
Background « Problem Which SDC methods to apply to Census 2021 data at Statistics Portugal? Framework Data products from Census 2021 - types of disclosure risk Candidate methods according to data product Parameters for each candidate method Risk and utility measures to compare methods/parameters 2/20 «
Background « Framework Data products from Census 2021 - types of disclosure risk Candidate methods 3/20 «
Background « Mainly tabular data Framework Data products from Census 2021 - types of disclosure risk Candidate methods 3/20 «
Background « Mainly tabular data Mainly attribute disclosure Framework Data products from Census 2021 - types of disclosure risk Candidate methods 3/20 «
Background « Framework Data products from Census 2021 - types of disclosure risk EU-project “Harmonized Protection Candidate methods of Census Data in the ESS” - Targeted Record Swapping - Cell Key Method 3/20 «
Background « Framework Data products from Census 2021 - types of disclosure risk EU-project “Harmonized Protection Candidate methods of Census Data in the ESS” - Targeted Record Swapping - Cell Key Method Parameters for each candidate method Risk and utility measures to compare methods/parameters 3/20 «
Background « Framework Data products from Census 2021 - types of disclosure risk EU-project “Harmonized Protection Candidate methods of Census Data in the ESS” - Targeted Record Swapping - Cell Key Method Parameters for each candidate method Risk and utility measures to compare methods/parameters 3/20 «
Methods « Data 10.000 dwellings sampled from PT Census 2011 data Tables Groups 2 and 11 of the EU-hypercubes Commission Regulation (EU) 2017/712, of 20 April 2017 Commission Implementing Regulation (EU) 2017/543, of 22 March 2017 identifying variables (region, sex, age group or size of the locality) variables that might be considered sensitive (marital status, household and family status or country of citizenship) 4/20 «
Targeted Record Swapping
 (Shlomo et al., 2010)

 «
HH1

 HH2

 5/20
 «
Targeted Record Swapping
 (Shlomo et al., 2010)

 «
HH1

 HH2

 1. Identify high risk individuals/households
 2. Sample high risk households for data swapping

 5/20
 «
Targeted Record Swapping
 (Shlomo et al., 2010)

 «
HH1

 HH3
 HH2

 1. Identify high risk individuals/households
 2. Sample high risk households for data swapping
 3. Pair the selected households with other households
 having the same values for the matching variables

 5/20
 «
Targeted Record Swapping
 (Shlomo et al., 2010)

 «
HH1

 HH2
 HH3
 HH2
 HH3

 1. Identify high risk individuals/households
 2. Sample high risk households for data swapping
 3. Pair the selected households with other households
 having the same values for the matching variables
 4. Swap the geographical information
 5/20
 «
RS – variants

 «
 Parameter Variant 1 Variant 2 Variant 3 Variant 4 Variant 5
Swap rate 5% 5% 5% 10% 5%
Variables to age.m || sex ||
 age.m || sex || age.m || sex || age.m || sex || age.m || sex ||
define high risk geo.m || person ||
 geo.m geo.m geo.m geo.m
(risk) lms.l || har
Threshold for
defining high 2 2 0 2 2
risk (th)
Profiles of
 ageg1 || ageg2 || ageg1 || ageg2 || ageg1 || ageg2 || ageg1 || ageg2 ||
matching
 ageg3 || ageg4 || ageg3 || ageg4 || ageg3 || ageg4 || ageg3 || ageg4 || person || ethc
variables
 ageg5 || ethc ageg5 || ethc ageg5 || ethc ageg5 || ethc
(similar)
Where:
 ageg1 = number of people under 20 years old
 ageg2 = number of men aged 20 to 59
 ageg3 = number of men aged 60 and over
 ageg4 = number of women aged 20 to 59
 ageg5 = number of women aged 60 and over
 ethc = number of people not born in the country
 person = number of individuals in the household

 6/20
 «
Cell Key Method

 «
 (Marley & Leaver, 2011; Enderle et al., 2018)

 Microdata
 Record
ID Sex Age …
 key
1 1 45 … 0.13

2 1 32 … 0.78

… … … … …

 7/20
 «
Cell Key Method

 «
 (Marley & Leaver, 2011; Enderle et al., 2018)

 Microdata Frequency table
 Record Age
ID Sex Age …
 key 15-24 25-29 …
1 1 45 … 0.13 Cell Cell Cell
 Count Count Count
2 1 32 … 0.78 key key key
 1 354 0.89 786 0.24 … …
… … … … … Sex
 2 632 0.68 485 0.76 … …
 Total 986 0.31 1271 0.53 … …

 Perturbation table
 Target frequency
 0 1 2 …
 0 1 0 0 …

 Original 1 0.59 0 0.41 …
 frequency 2 0.18 0 0.29 …
 … … … ... …

 7/20
 «
Cell Key Method

 «
 (Marley & Leaver, 2011; Enderle et al., 2018)

 Microdata Frequency table
 Record Age
ID Sex Age …
 key 15-24 25-29 …
 1 1 45 … 0.13 Cell Cell Cell
 Count Count Count
 2 1 32 … 0.78 key key key
 1 354 0.89 786 0.24 … …
… … … … … Sex
 2 632 0.68 485 0.76 … …
 Total 986 0.31 1271 0.53 … …

 Perturbed frequency table Perturbation table
 Age Target frequency
 15-24 25-29 … 0 1 2 …
 1 353 783 … 0 1 0 0 …
Sex
 2 635 487 … Original 1 0.59 0 0.41 …
 Total 987 1270 frequency 2 0.18 0 0.29 …
 … … … ... …

 7/20
 «
CKM – variants

 «
 Parameter Variant 1 Variant 2 Variant 3 Variant 4 Variant 5 Variant 6
Maximum perturbation
 4 5 4 4 4 4
(D)
Perturbation variance
 3 3 6 3 3 3
(V)
Threshold value for
 2 2 2 0 2 2
small frequencies (js)
 NA
Probability of an
 (produces
original frequency to
 the max. NA NA NA 0.5 NA
remain unperturbed
 entropy
(pstay)
 solution)
Monotony condition
 TRUE TRUE TRUE TRUE TRUE FALSE
(mono)

 8/20
 «
RS+CKM – variant

 «
 Parameter Variant 1
Swap rate 5%
Variables to define high risk (risk) age.m || sex || geo.m
Threshold for defining high risk (th) 2
Profiles of matching variables (similar) person || ethc
Maximum perturbation (D) 4
Perturbation variance (V) 3
Threshold value for small frequencies (js) 2
Probability of an original frequency to remain unperturbed (pstay) NA
Monotony condition (mono) TRUE

 9/20
 «
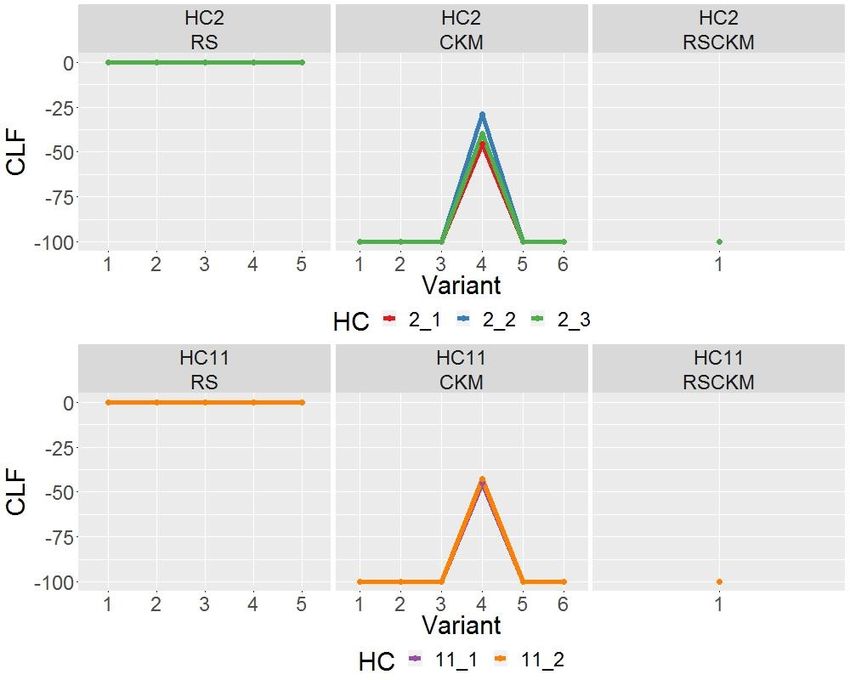
Risk measures « Let: ─ : number of units that fall into cell in the original table ─ ′ : number of units that fall into cell in the protected table ′ ─ : total number of cells in table (or ′) RM 1 Relative change of the number of cells with frequency lower than 3 (change in low frequencies) ′ =1 ( < 3) = − 1 × 100% =1 ( < 3) 10/20 «
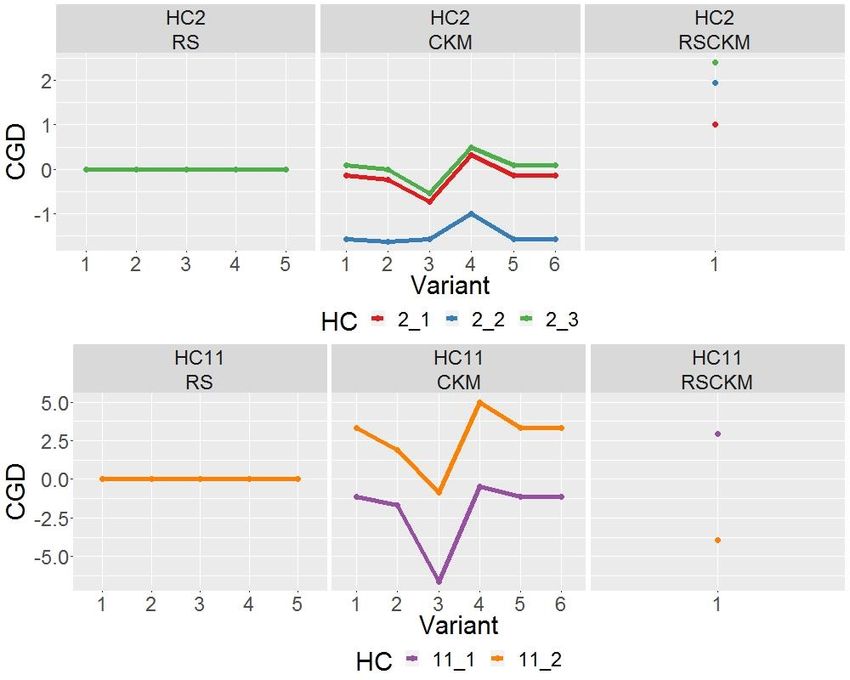
Risk measures « RM 2 Proportion of cells with frequency lower than 3 both in the original and the perturbed table (real low frequencies) =1 ( < 3 ∧ ′ < 3) = × 100% RM 3 Relative change in the number of cells where there can be attribute disclosure - Group disclosure: cell frequency = row or column total - Group disclosure by element: cell frequency = row or column total - 1 - Inferential disclosure: cell frequency = row or column total * (1± %) « 11/20
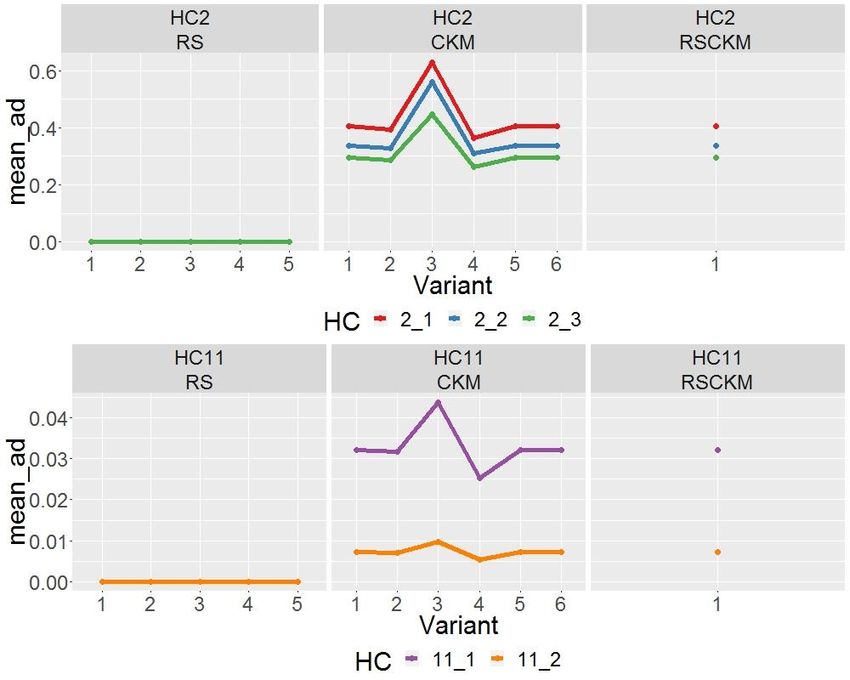
Utility measures « UM 1 (Shlomo & Young, 2005; Shlomo, 2007) Absolute distance (AD) between the original and the perturbed counts = ′ − UM 2 (Shlomo & Young, 2005; Shlomo, 2007) Relative distance (RD) between the original and the perturbed counts ′ − = Simple descriptive statistics (max, mean, sd, median) across all cells 12/20 «
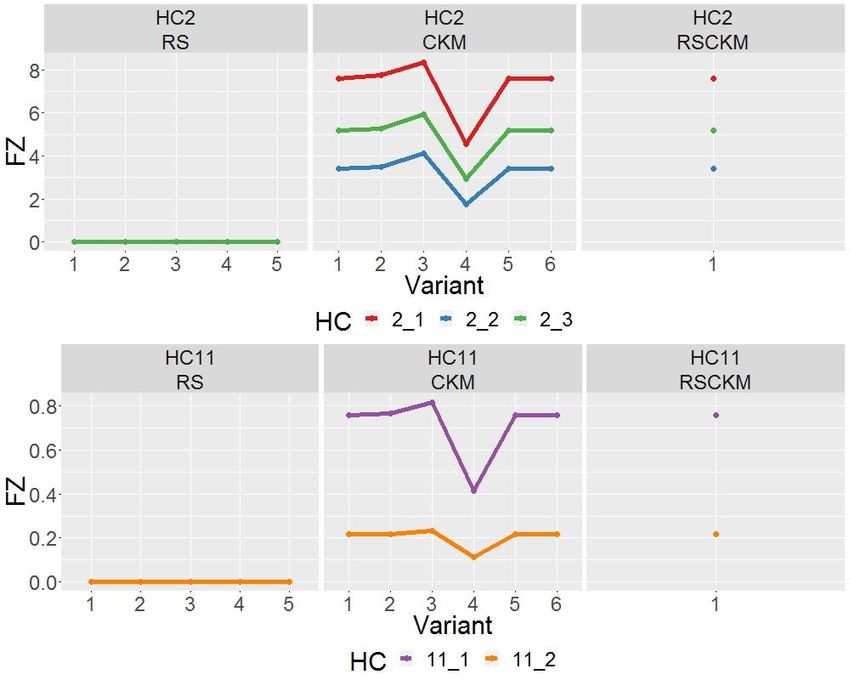
Utility measures « UM 3 (Buron et al., 2017) ′ =1 ( = 0 ∧ ≠ 0) Proportion of false zeros = ′ × 100% =1 ( = 0) UM 4 (Buron et al., 2017) ′ =1 ( > 0 ∧ = 0) Proportion of false positives = ′ × 100% =1 ( > 0) UM 5 ′ =1 ( = ) Proportion of unchanged cells = × 100% 13/20 «
Utility measures « UM 6 (Shlomo, 2007; Marley & Leaver, 2011) Relative change in Cramer’s V for each pair of variables ( , ) ′ = − 1 × 100% 2 2 ′ where = , ′ = min( −1, −1) min( −1, −1) 2 is the Pearson's chi-squared statistic is the number of rows and is the number of columns of the two-way table 14/20 «
Software « EU-project Open source tools for perturbative confidentiality methods - R packages recordSwapping (version 0.1.0), ptable (version 0.2.0) and cellKey (version 0.16.3) 15/20 «
Results

 «
Change in low frequencies (CLF) Change in group disclosure (CGD)

 16/20
 «
Results

 «
Mean of absolute distance (mean_ad) Proportion of false zeros (FZ)

 17/20
 «
Discussion and conclusions « RS can be used with the aim of increasing uncertainty, namely regarding the lowest geographic levels RS should be used together with CKM, to effectively reduce risk CKM results in the loss of table additivity 18/20 «
Discussion and conclusions « RS can be used with the aim of increasing uncertainty, namely regarding the lowest geographic levels RS should be used together with CKM, to effectively reduce risk CKM results in the loss of table additivity Challenge: Communicating to the users 18/20 «
Discussion and conclusions « RS can be used with the aim of increasing uncertainty, namely regarding the lowest geographic levels RS should be used together with CKM, to effectively reduce risk CKM results in the loss of table additivity Challenge: Communicating to the users Users need to be aware that perturbative SDC methods were used 18/20 «
Discussion and conclusions « RS can be used with the aim of increasing uncertainty, namely regarding the lowest geographic levels RS should be used together with CKM, to effectively reduce risk CKM results in the loss of table additivity Challenge: Communicating to the users Users need to be aware that perturbative SDC methods were used Selected disclosure risk and utility indicators might be published, possibly in the quality report 18/20 «
Discussion and conclusions « RS can be used with the aim of increasing uncertainty, namely regarding the lowest geographic levels RS should be used together with CKM, to effectively reduce risk CKM results in the loss of table additivity Challenge: Communicating to the users Users need to be aware that perturbative SDC methods were used Selected disclosure risk and utility indicators might be published, possibly in the quality report The loss of table additivity due to confidentiality protection should be clearly stated 18/20 «
References « Buron, M.L., Cabrera, A. & Lukan, J. (2017) Results of the tests on census hypercube and grid data and information loss analysis. SGA Harmonised protection of census data in the ESS, Work Package 3, Deliverable D3.2 Marley, J.K. & Leaver, V.L. (2011) A method for confidentialising user-defined tables: statistical properties and a risk-utility analysis. In: Proceedings of 58th World Statistical Congress, pp. 1072–1081 Shlomo, N. & Young, C. (2005) Information Loss Measures for Frequency Tables. Joint UNECE/Eurostat work session on statistical data confidentiality Shlomo, N. & Young, C. (2006). Statistical Disclosure Control Methods Through a Risk-Utility Framework. In J. Domingo-Ferrer and L. Franconi, eds., Privacy in Statistical Databases, 68-81. New York: Springer-Verlag, LNCS, vol. 4302. Shlomo, N. (2007). Assessing the Impact of SDC Methods on Census Frequency Tables. Joint UNECE/Eurostat work session on statistical data confidentiality Shlomo N., Tudor C. & Groom P. (2010) Data Swapping for Protecting Census Tables. In: Domingo-Ferrer J., Magkos E. (eds) Privacy in Statistical Databases. PSD 2010. Lecture Notes in Computer Science, vol 6344. Springer, Berlin, Heidelberg 19/20 «
Thank you!
Inês Rodrigues (ines.rodrigues@ine.pt)

 20/20
 «
You can also read