COVID-19: One Year of the Pandemic in BC - March 11, 2021
←
→
Page content transcription
If your browser does not render page correctly, please read the page content below
COVID-19:
One Year of the Pandemic in BC
           March 11, 2021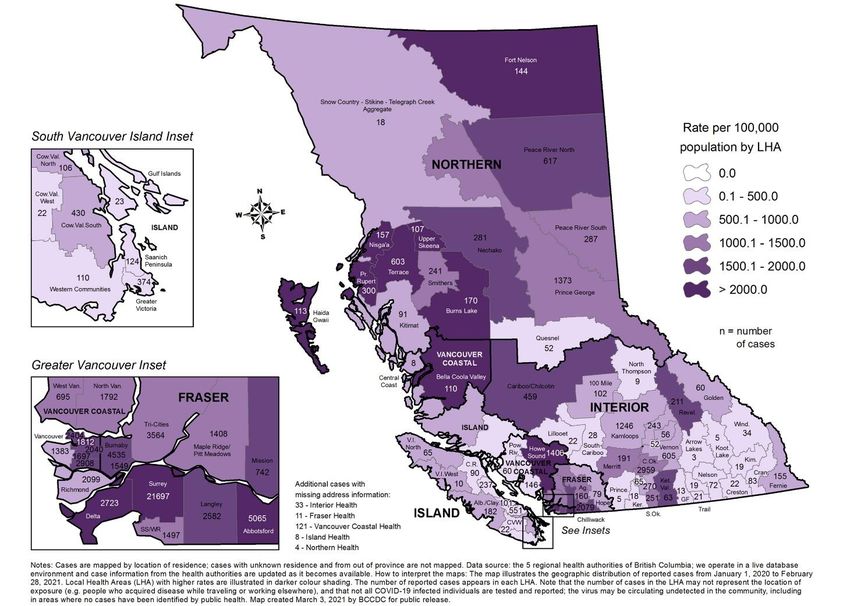
Geographic
Distribution of
COVID-19 by
Health Service
Delivery Area of
Case Residence

                   2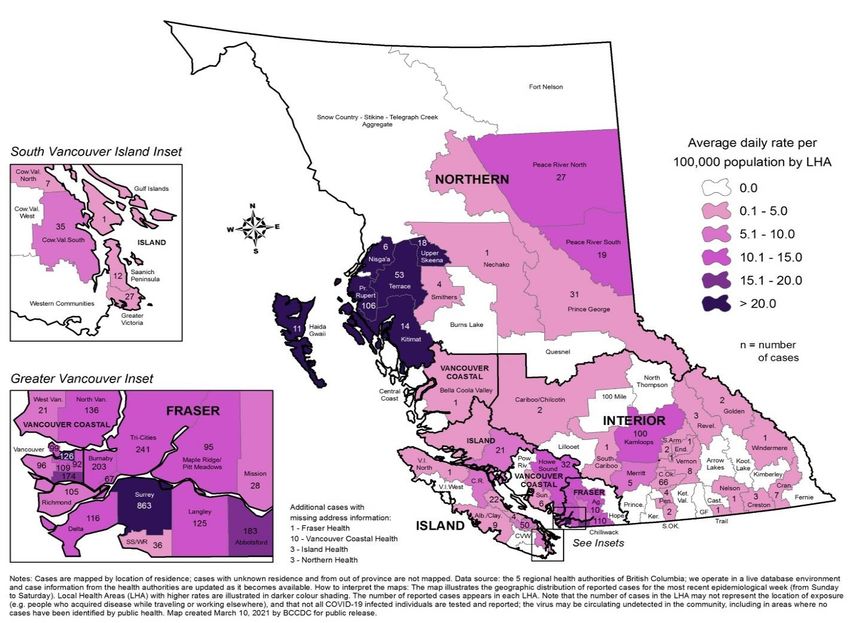
Geographic
Distribution of
COVID-19 by
Local Health Area
of Case Residence
Jan 2020 – Feb 2021

                      3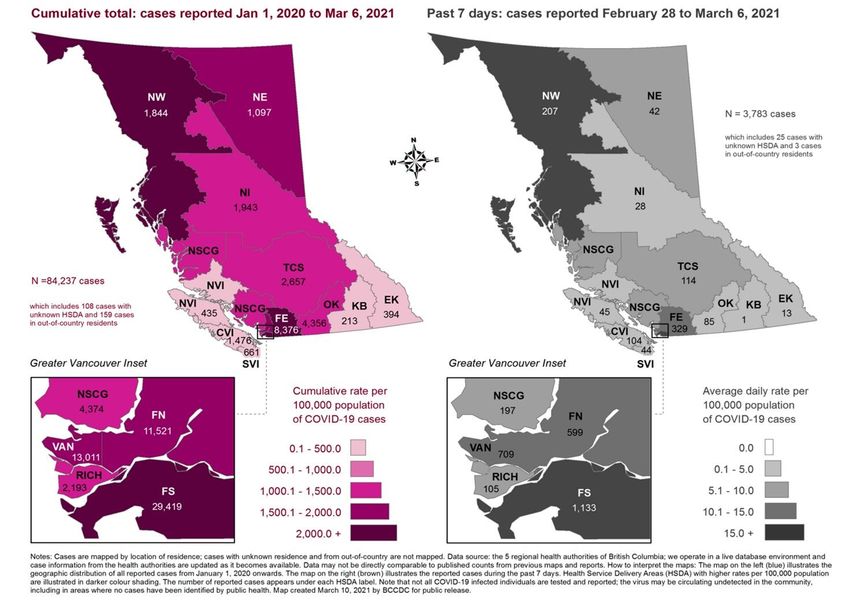
Geographic
Distribution of
COVID-19 by
Local Health Area
of Case Residence
in Past 7 Days

                    4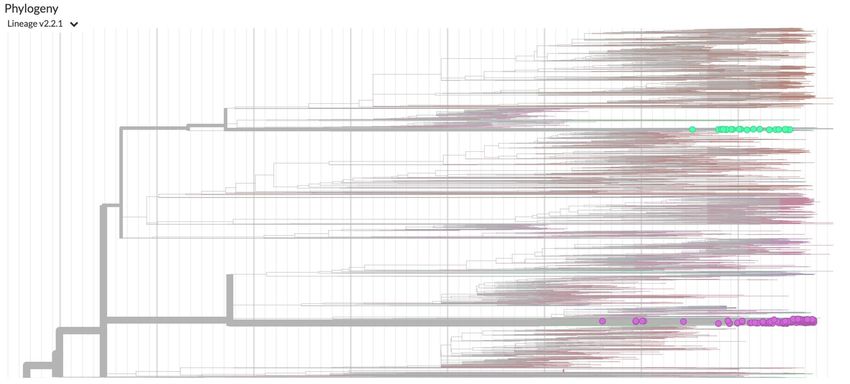
Daily Cases, Hospitalizations, and Deaths by Surveillance Date
                January 2020 – March 8, 2021

           84,569 total cases

           4,601 ever hospitalized

           1,391 deaths

           78,237 removed from isolation

                                                                 5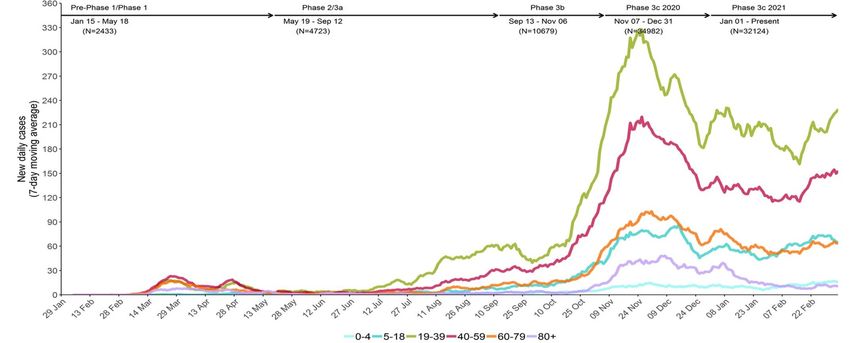
Epidemic Curve, COVID-19 Cases in B.C. by Surveillance Date
              January 2020 – March 8, 2021

                                                              6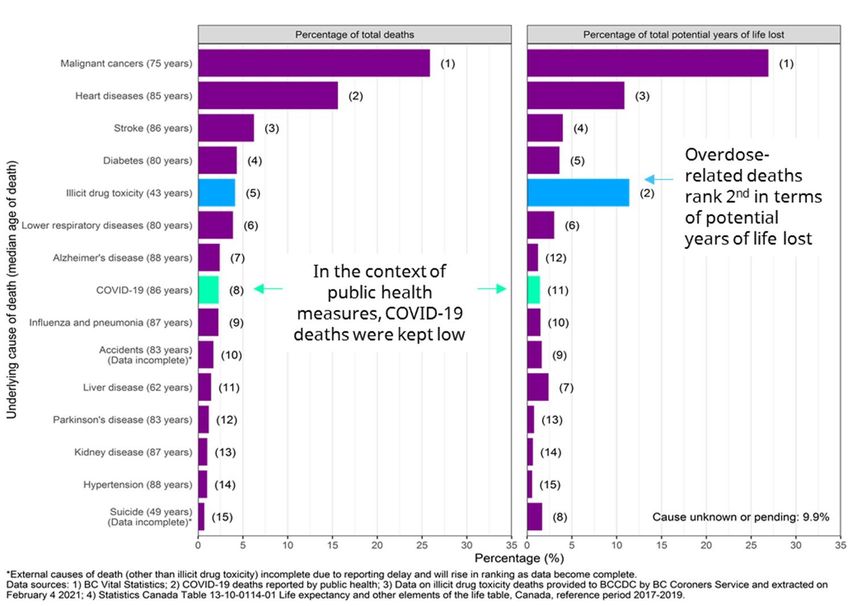
Likely Source of COVID-19 Infection by Episode Date, BC
          January 15, 2020 – February 27, 2021

                                                          7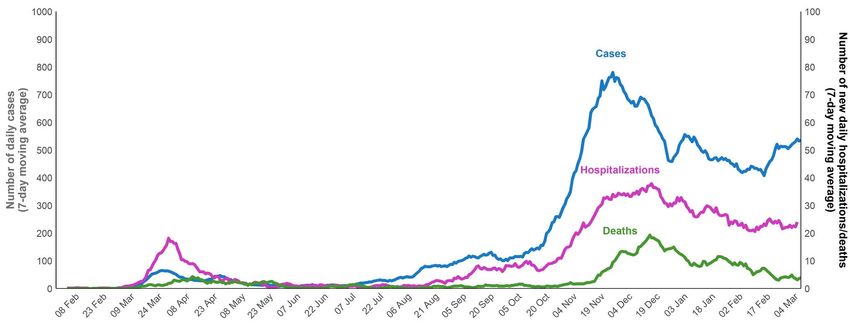
Daily Case Count by Age January 2020 – March 8, 2021
              (7-day Moving Average)

                                                       8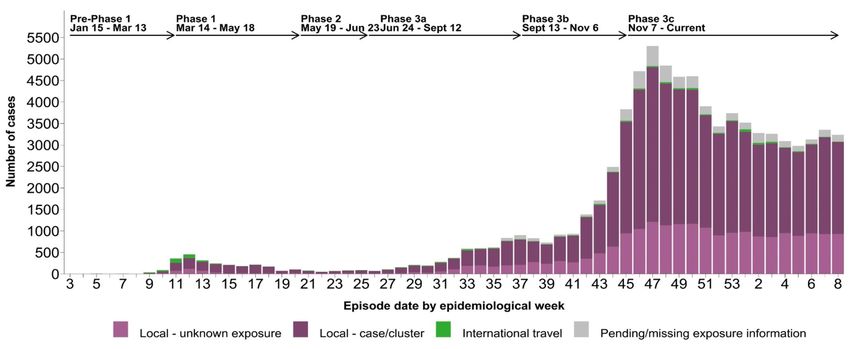
Daily Case Rate, Testing Rate and Percent Positivity by Health
          Authority (March 1, 2020 – March 7, 2021)

                                                                 9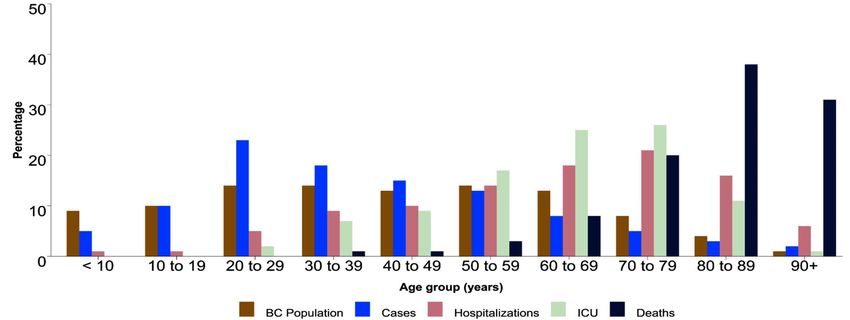
Percentage Distribution of COVID-19 Cases, Hospitalizations,
   ICU Admissions and Deaths by Age, British Columbia,
           January 15, 2020 – February 27, 2021

                                                               10
Multi-Inflammatory Syndrome in Children (MIS-C)
Aged 0 – 18 in British Columbia
• 10 confirmed children with MIS-C among 10,887
total COVID-19 cases 0-18 years
o 7 admitted to ICU
• All recovered, recovering or in stable condition,
no deaths
• Who: Median age 8 years (range 1-15 years)
• Where: 6 in Fraser, 2 in Vancouver Coastal and
2 in Northern
• When: January 2020 to March 10, 2021
11Severe influenza season COVID-19 pandemic
H1N1 pandemic and increased overdose and increased
mortality overdose mortality
All-Cause
Mortality Rates in
BC 2009 – 2020,
Standardized for
Age and Sex*
12Top 15 Causes of
Death in BC in
2020 Based on
Available Data
(10% Still
Unknown or
Pending)
13Daily Case Rates Across Canada
March 1, 2020 – March 7, 2021
BC was able to maintain a low rate
of infection, while keeping schools
and many businesses open
14Daily Death Rates Across Canada
March 1, 2020 – March 7, 2021
15Daily Case Rates: International
March 1, 2020 – March 7, 2021
16Daily Death Rates: International
March 1, 2020 – March 7, 2021
17The Majority of Positive Samples Sequenced are Selected
From the General Population With a Positive COVID-19 Test.
In the past two weeks, ~50% of the specimens are sequenced following screening for mutations.
18Confirmed VoC by Sequencing of Samples That are
Representative of the General Population is Below 10%
19Most VOCs Are Now Locally Acquired; P.1 (variant initially
identified in Brazil) recently detected in BC
600
500
400
Case Count
300
Travel Acquired
Locally Acquired
200
100
0
B.1.1.7 (UK) B.1.351 (SA) P.1 (Brazil)
Variant
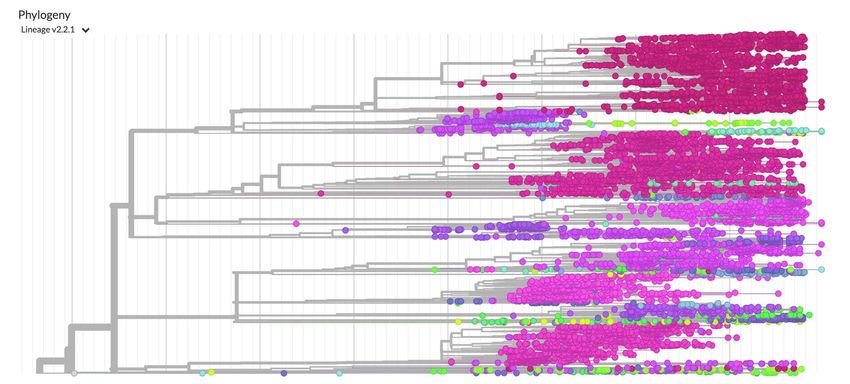
20There are Many Lineages/Variants of SARS-CoV-2 in BC
Each colour is a unique lineage;
each dot is a patient
21Variant Lineages (B.1.1.7* and B.1.351*) are Still Rare in BC
Compared to Other Lineages
Each colour is a unique lineage;
each dot is a patient
B.1.351* (SA)
B.1.1.7* (UK)
22BC Vaccine Rollout
Number of Doses Administered to March 8, 2021 (N=343,381)
300,000
Individuals who received ≥ 1 dose
Individuals Receiving Vaccination
250,000
n= 256,443
200,000 6% of BC population ≥ 18 years
Individuals who
150,000
received 2 doses
n= 86,938
100,000
50,000
0
23Early COVID-19 Vaccine Effectiveness in BC
Research led by Dr. Danuta Skowronski and the BCCDC Influenza and Respiratory Pathogens Team.
Examined cases among vaccinated long term care residents and health
care workers from late December 2020 to early February 2021
Early surveillance data shows drop in cases in both groups at about
14 days after vaccination, with hospitalizations and deaths also lower
Estimates suggest 80% of COVID-19 cases prevented after 2 to 3 weeks
Funding for this research was provided by the Michael Smith Foundation for Health Research.
24Substantial Decline Within a Few Weeks of First Vaccination
(episode date)
Substantial Decline in HCW Cases: Substantial Decline in LTCF Resident Cases:
• To day 62 post-vaccination (Extract Feb 22, 2021: study • To day 54 post-vaccination (Extract Feb 22, 2021: study
period Dec 15, 2020 to Feb 15, 2021) period Dec 23, 2020 to Feb 15, 2021)
• 346 cases of which 86% before day 21 since vaccination • 203 cases of which 89% before day 21 since vaccination
25Population Surveillance Data Suggest Beneficial Vaccine
Impact in Targeted Groups
Decline in HCW Cases: Decline in LTCF Resident Cases:
• Vaccination of HCWs began Dec 15, 2020 (week 51) • Vaccination of LTCF residents began Dec 23, 2020 (week 52)
• Greater decline than in non-HCW cases in BC • Greater decline than in non-LTCF residents in BC
Vaccination Start Vaccination Start
26Dynamic Compartmental Modeling: Recent Trends
Our model shows that Rt is close to or above 1 in most regions of BC.
Whenever Rt > 1, there is a risk that the number of new cases will grow.
BC Fraser Vancouver
Coastal
Interior Vancouver Northern
Island
Solid black line: median Rt , data up to Mar 8, 2021; Grey band: 5%-95% credible interval; Purple bars: all reported cases. Due to lag from symptom onset to reporting, most recent cases are not shown.
27Dynamic Compartmental Modeling: Recent Trends
Our model outputs show differing trends across BC.
Large uncertainty reflects the recent fluctuations in case counts in many regions.
BC Fraser Vancouver
Coastal
Vancouver Northern
Interior
Island
Solid blue line: median model fit; shaded bands: 50% and 90% credible intervals; Open circles: all reported cases, March 1, 2020 – March 8, 2021. X Axis = Case Surveillance Date
28Dynamic Compartmental Modeling: Scenarios
Our modeling scenarios are consistent with an average infectious contact rate of 50-60% of normal.
Infectious contact rate: Infectious contact rate:
40% of normal 50% of normal
Infectious contact rate: Infectious contact rate:
60% of normal 70% of normal
Solid blue line: median model fit; shaded bands: 50% and 90% credible intervals; Open circles: all reported cases, March 1, 2020 – Mar 8, 2021. X Axis = Case Surveillance Date
29COVID-19:
One Year of the Pandemic in BC
March 11, 2021You can also read