Covid-19: Public Policies and Society's Responses - Rede de Pesquisa Solidária
←
→
Page content transcription
If your browser does not render page correctly, please read the page content below
BULLETIN 27                                                                      Mar 05, 2021

Covid-19:

                                                                                                           pixabay.com
Public Policies
and Society’s
Responses
Quality information for refining public policies and saving lives

         Policy Brief 27
         Federal fiscal aid to the states maintained the 2020
         tax revenue at the same level as 2019. However, there
         was an uneven distribution of resources for health.
         Average expenditure on education dropped by 9%,
         even in the states with increased ICMS revenues

Main Conclusions
• In 2020, ICMS revenue (Tax on the Circulation of Goods and Services) registered a real decline of less
  than 2% on average, whereas 12 states registered an increase in the collection of this tax.
• The federal financial assistance to states (Complementary Law 173/2020) was more significant
  than the states' revenue losses. Even states with no tax revenue losses received these transfers.
• Our research found a significant surge in the states' health expenditures, as expected. Furthermore,
  there was a proportional increase in social assistance expenditures, even though the absolute
  volume was not significant, suggesting that some states also focused on this sector on top of the
  federal emergency assistance.
• The lack of a strategy for tackling the pandemic led to an average decline of 9% in education
  expenditures. Surprisingly, most states registered this decline, including states with ICMS gains.
  Some states have reduced spending on education by over 20%.

                                                   1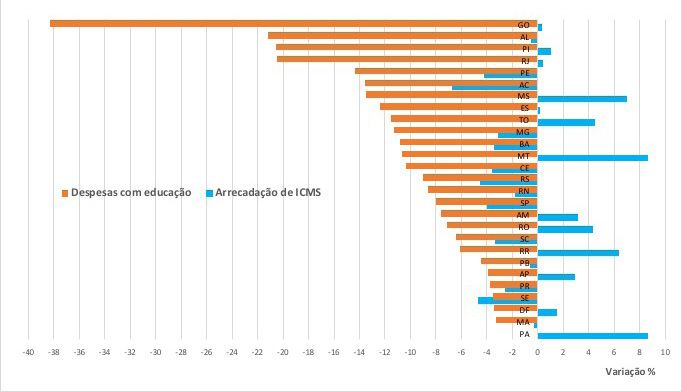
Solidary Research Network - Bulletin 27                                                                             Mar 05, 2021

Introduction
  Brazil's performance in tackling the COVID-19 pandemic ranks as one of the worst in the world.
At the end of February 2021, Brazil had officially registered over 10.5 million infections and almost
260,000 deaths, reaching 1,200 deaths per million inhabitants. The denial of the severity of the
pandemic alongside the constant attack on vaccines, isolation measures, and the use of masks,
and the promotion of drugs without proven efficacy have marked the federal government's actions.
The lack of coordination and strategy prompted the disbandment of the Ministry of Health, the
neutralization of Brazil's Unified Health System (SUS), and the dissolution of its technical authority
to combat epidemics.
  Constant criticism against scientific recommendations and other successful experiences around
the world, alongside criminal negligence in purchasing vaccines, resulted in the present tragic reality,
and one for which the federal government is the main responsible culprit.
 This same pattern repeated itself in socioeconomic policies. The federal government tried to
oppose several measures to mitigate the damage caused by the Covid-19 pandemic, such as the
emergency basic income program and financial assistance to states and municipalities.
  However, the National Congress counteracted and approved bills to ensure emergency financial
resources to compensate lost income during the pandemic to individuals and states, and
municipalities, which were at risk of being unable to finance their struggle against COVID-19 or even
maintain essential public services.
  In 2020, R$ 322 billion were earmarked for transfers to individuals, R$ 79.2 billion in aid to states and
municipalities, R$ 24.5 billion for the purchase of vaccines, tallying circa R$ 600 billion in federal
expenditures for coping with the pandemic. However, there was a complete lack of effective national
coordination to carry out these measures.
  In this policy brief, we analyze state-level revenues and the allocation of public spending on key
public policies, comparing the fiscal behavior of 2020 against 2019. As for expenditures, we provide a
more detailed analysis in the areas of health and education1.
  In March 2020, with an ongoing reduction in economic activity amid the pandemic, states and
municipalities, already enduring poor fiscal performance since 2014, were exposed to an abrupt drop
in ICMS (Tax on the Circulation of Goods and Services) and ISS (Tax Over Services) revenues. Different
organizations and research centers projected a 15% to 20% drop in tax revenue on consumption and
services. Faced with this scenario, the National Congress approved a federal fiscal aid package in May
last year to offset tax revenue losses in states and municipalities and ensure financial conditions to
cope with the emergency surge in health expenditures and maintain other public policies.
  The federal government is the only entity in a position to provide swift financing and, at a lower cost,
centralized debt management and provided resources for the states to preserve and maintain public
services in health, education, and social assistance during the pandemic through a decentralized
process.

1 The area with the greatest expenditure in the states was Social Security, not addressed in this policy brief, followed by Health,
  Education, and Special Charges, which includes the payment of debts, an area also not detailed in this policy brief.

                                                                2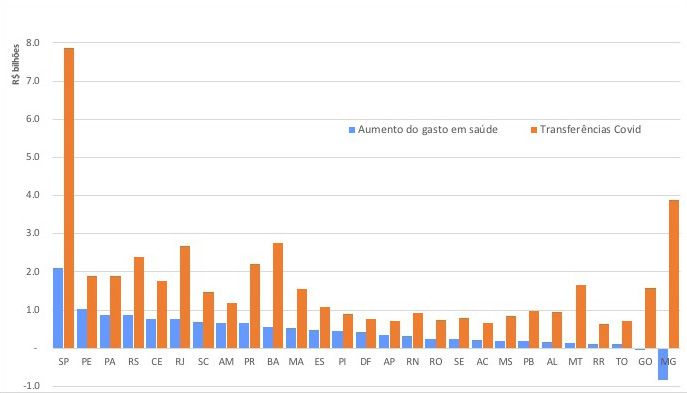
Solidary Research Network - Bulletin 27                                                                            Mar 05, 2021

  The fiscal aid bill was approved through Complementary Law 173/2000 and envisaged the transfer
of R$ 60.15 billion to subnational entities. The National Congress also approved measures to maintain
the transfer levels of state and municipal participation funds (FPE and FPM, respectively) of up to R$
16 billion, and federal transfers were earmarked for culture, the Ministry of Health, as well as other
ministries. On top of these transfers, the bill also allowed states and municipalities to suspend debt
payments to the Federal Government and public and multilateral banks.
  The approved fiscal aid was not confined to the loss of ICMS or ISS or any other tax in 2020. The
approved bill envisioned transferring four fixed installments to states and municipalities between
June and September, based on various criteria2. This model led to a mismatch between tax revenue
losses and received transfers. Therefore, some states received federal transfers even with tax revenue
gains in 2020, as seen in the first half of 2020 after the first installment of the federal aid3.

Revenues
  Brazilian states did not register tax revenue losses forecasted at the beginning of 2020. On the
contrary, data from the Siconfi/Ministry of Economy revealed that losses, when applicable, were
minor, and most states registered real tax revenue gains. The federal resources transferred exceeded
the ICMS losses of the states. Furthermore, the total volume of the states' effectively collected net
current revenue grew 2.4% in 2020 compared to 2019.

                                      Table 1 - Comparison between Net Revenue, Transfers,
                                        and ICMS Revenue in the States e DF (2019/2020)

                         NET REVENUE                    OTHER FEDERAL TRANSFERS                          ICMS

   State         2019        2020           VAR        2019         2020          VAR         2019        2020         VAR
     SP        167.697      165.231        -1,5%       11.053       20.801       88,2%       155.803     149.339       -4,1%
    MG         66.964        70.586         5,4%       2.904        6.948        139,3%       54.331     52.524        -3,3%
     RJ         61.213       59.498        -2,8%       2.575        4.623        79,5%        38.621     38.693        0,2%
    RS          41.577      42.074          1,2%       1.816        4.812       165,0%        38.180     36.371        -4,7%
    PR         40.696        40.251        -1,1%       2.559        5.243       104,9%       32.293      31.392        -2,8%
    BA          36.086       37.878         5,0%       2.871        5.561        93,7%       25.834      24.902        -3,6%
    PE         26.486        27.239         2,8%       2.554        4.511        76,7%        18.077     17.277        -4,4%
     SC         26.226       26.861         2,4%       1.450        3.305       127,9%        24.818     23.938        -3,5%
    GO          25.648       26.350         2,7%        992         2.305        132,3%       17.795     17.814        0,1%
    DF          23.521       25.059         6,5%       3.402        5.044        48,3%        8.543       8.652        1,3%
     PA         22.671       24.197         6,7%       1.540        3.958        157,0%       12.753     13.834        8,5%
    CE          21.826       22.028         0,9%       1.445        3.262        125,7%       13.742     13.222        -3,8%
    MT          17.930      20.482         14,2%        978         2.856       192,2%        11.826     12.826        8,5%
    AM          15.660       16.460         5,1%       1.196        2.335        95,3%        10.530     10.841        3,0%
    MA          15.363       16.251         5,8%       1.731        2.509        44,9%        8.185       8.144        -0,5%
     ES         16.549       15.641        -5,5%       3.919        3.722        -5,0%        11.928     11.925        0,0%

2 Informative note from the Technical Advisory Office of the National Congress. https://bit.ly/3e2DNz8
3 Policy Brief #23 from the Solidarity Research Network. https://bit.ly/3kOtRcu

                                                                3
Solidary Research Network - Bulletin 27 Mar 05, 2021
NET REVENUE OTHER FEDERAL TRANSFERS ICMS
State 2019 2020 VAR 2019 2020 VAR 2019 2020 VAR
MS 12.555 14.071 12,1% 1.907 2.930 53,6% 9.517 10.161 6,8%
PI 9.899 11.770 18,9% 801 3.308 312,9% 4.683 4.724 0,9%
PB 10.709 11.288 5,4% 486 1.654 240,2% 6.149 6.099 -0,8%
RN 10.638 10.888 2,4% 792 1.726 118,1% 5.999 5.881 -2,0%
AL 8.946 10.059 12,4% 584 1.427 144,4% 4.729 4.695 -0,7%
TO 8.378 8.967 7,0% 593 1.419 139,1% 3.151 3.287 4,3%
SE 8.418 8.725 3,6% 707 1.440 103,6% 3.678 3.498 -4,9%
RO 8.093 8.724 7,8% 606 1.392 129,9% 4.270 4.446 4,1%
AP 5.842 5.947 1,8% 438 1.184 170,3% 988 1.015 2,7%
AC 5.600 5.703 1,8% 553 1.108 100,5% 1.477 1.374 -6,9%
RR 4.390 4.335 -1,3% 340 935 174,9% 1.168 1.240 6,2%
Total 719.579 736.562 2,4% 50.791 100.319 97,5% 529.067 518.116 -2,1%
Source: Prepared by the authors based on data from the Siconfi/ME
While not all states registered this gain, most states had a real higher tax revenue in 2020 than in
2019. Only five states suffered revenue losses, discounted for inflation: SP, RJ, PR, ES, and RR.
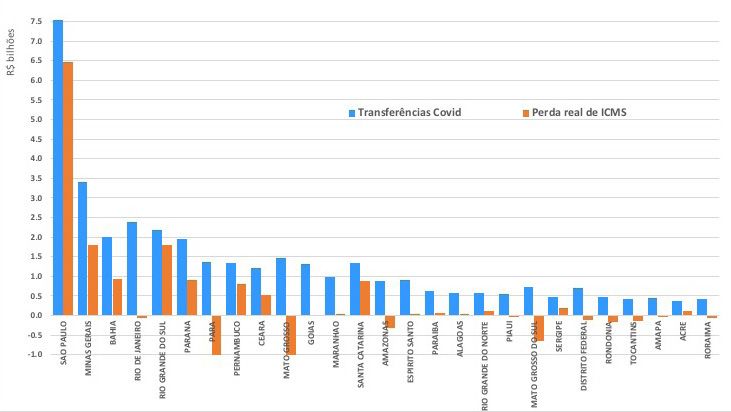
Figure 1 - Transfers received by the states and real ICMS loss in 2020
R$ Billions
Covid Transfers Loss of ICMS
Source: Prepared by the authors based on data from the Siconfi/ME, as a result of LC 173/2020
4Solidary Research Network - Bulletin 27 Mar 05, 2021
The federal fiscal aid played an essential role in the Net Current Revenue balance. Federal transfers
increased 97.5% when compared to 2019. From this amount, BRL 45.4 billion originated both from
Complementary Law 173/2020 and other relief measures to mitigate the revenue downturn prompted
by the COVID-19 pandemic. On average, the states' ICMS revenue suffered a real loss of 2.1%, even
though 12 states recorded real gains, while some recorded circa 9% real revenue growth in 2020,
compared to 2019.
Two situations merit particular attention: i) the current revenue equilibrium in states with tax revenue
losses, especially ICMS losses, as registered in SP, MG, PR, ES, PE, and several other states; ii) states
with real ICMS gains registered substantial growth in tax revenue compared to 2019, contrary to
expected losses during a pandemic year. The ICMS increase was most likely due to an emergency
basic income program4 sanctioned by Law 13.998/2020, which stimulated household consumption
and ICMS revenue.
Expenditures
Despite revenue growth, Brazilian states registered a real reduction of 3.5% in total expenditures in
2020 compared to 2019, with wide variations among states. While most states reported small
increases or decreases in expenditures, the states of SP, PI, PR, and MT reduced their expenditures by
more than 5%. On the other hand, PA, AL, and RO registered an increase of over 5% in their
expenditures. The most extreme variations were recorded in PA, with a drop of more than 6%, and PA,
with almost an 11% increase.
Table 2 details expenditures by budgetary function and reveals wide variations among public
policies, with significant increases in health, transportation, urbanism, social assistance, and culture.
Social security, an area that accounts for almost 25% of the states' expenditures, grew 3.6% in real
terms. Conversely, spending on education, science and technology, and citizenship rights, and special
charges5 dropped significantly, and other functions with less weight in the total expenditure.
4 Sanches, Marina; Cardomingo, Matias; Carvalho, Laura (2021). Quão mais fundo poderia ter sido esse poço? Analisando o efeito
estabilizador do Auxílio Emergencial em 2020 (Economic Policy Note nº 007). MADE/USP. Available at: https://madeusp.com.
br/publicacoes/artigos/quao-mais-fundo-poderia-ter-sido-esse-poco-analisando-o-efeito-estabilizador-do-auxilio-emergencial-
em-2020/
5 Expenditures on special charges (which also includes debt payments) were R$ 31 billion lower in 2020 than in 2019.
The suspension of debt payment turned out to be a disparate measure, as a handful of states concentrated almost all
expenditures of this nature while others renegotiated their debts under the Tax Recovery Regime. The expenditure drop with
special charges was particularly relevant in São Paulo (a reduction of R$ 15 billion), PR (a reduction of R$ 9 billion), and MT
(a reduction of R$ 1.44 billion, 61.7% of the expenditure in 2019). This meant these states had more resources available for
other budgetary purposes when compared to other states.
5Solidary Research Network - Bulletin 27 Mar 05, 2021
Table 2 - Annual state expenditures by state and by function (2019/2020)
Variation Variation
Function 2019 2020 State 2019 2020
% %
Social Security 179.358 185.902 3,6% SP 188.248 175.352 -6,9%
Health 110.233 122.437 11,1% MG 94.996 94.430 -0,6%
Education 124.582 113.199 -9,1% RJ 62.129 59.897 -3,6%
Public security 86.706 84.232 -2,9% RS 49.864 47.846 -4,0%
Special Charges 112.722 81.528 -27,7% PR 52.523 44.044 -16,1%
Judiciary 46.549 43.931 -5,6% BA 40.714 39.696 -2,5%
Management 34.055 33.302 -2,2% PE 28.075 27.889 -0,7%
Transportation 23.678 25.251 6,6% GO 28.650 27.441 -4,2%
Essential Justice Services 22.543 21.972 -2,5% CE 27.348 26.915 -1,6%
Legislative Services 17.801 17.564 -1,3% SC 27.287 26.426 -3,2%
Citizenship Rights 14.243 12.989 -8,8% PA 22.046 24.439 10,9%
Agriculture 7.112 6.884 -3,2% DF 23.975 23.422 -2,3%
Social Assistance 5.615 6.597 17,5% MT 19.167 18.138 -5,4%
Urbanism 4.945 5.891 19,1% MA 16.747 16.774 0,2%
Environmental Management 4.564 4.464 -2,2% AM 16.379 16.769 2,4%
Culture 2.482 3.592 44,7% ES 14.495 15.175 4,7%
Science and Technology 3.818 3.470 -9,1% MS 13.281 13.267 -0,1%
Sanitation 2.256 2.265 0,4% RN 12.366 11.840 -4,3%
Commerce and Services 2.116 1.992 -5,8% PI 12.228 11.123 -9,0%
Housing 1.646 1.669 1,4% PB 10.677 10.386 -2,7%
Communications 769 1.013 31,8% AL 9.151 9.770 6,8%
Work 978 821 -16,0% TO 8.892 9.209 3,6%
Sport and Leisure 978 704 -27,9% SE 9.202 9.074 -1,4%
Industry 924 657 -28,9% RO 7.607 8.049 5,8%
Agrarian Organization 219 196 -10,7% AC 6.343 6.420 1,2%
Energy 122 144 17,5% AP 4.916 5.111 4,0%
Foreign Affairs 0 0 RR 3.713 3.768 1,5%
TOTAL 811.015 782.669 -3,5% TOTAL 811.015 782.669 -3,5%
Source: Prepared by the authors based on data from the Siconfi/ME
1. Health Expenditures
The average expenditure on health was 11.1% higher in 2020 than in 2019, an entirely expected
scenario amid the pandemic – in almost all states, the most significant expenditure surge was on
hospital administration. Nevertheless, the states' expenditure variation is striking compared to the
revenue acquired from COVID-19 related federal transfers. The Figure below compares the amount of
incremental spending in 2020 against 2019 with the amount received from COVID-19-related
transfers by state.
6Solidary Research Network - Bulletin 27 Mar 05, 2021
R$ Billions Figure 2 - Health expenditures and COVID-19-related transfers received by the states
Health Expenses’ Increase Covid Transfers
Source: Prepared by the authors based on data from the Siconfi/ME
The Figure does not allow us to infer any clear and coordinated relationship between received
transfers and incremental spending on health. In other words, Brazilian states allocated federal
transfers to health-related policies but also for maintaining other public policies. Even so, given that
the focus was on controlling the pandemic, one would expect to find a coordinated use of federal
transfers on health. In some states, increased spending on health accounted for circa 50% of the
received transfers. Conversely, this percentage was negligible in other states, while others registered
a reduction in health expenditures in 2020, despite having received significant transfers.
2. Education Expenditures
Table 2 (above) shows an average reduction of 9% in the states' education expenditures in 2020,
compared to 2019. Two factors seem to have caused this reduction: i) the closure of schools, which
reduced expenditures for some services; and ii) the reduction in tax revenues, which, when offset by
federal transfers, rescinded the requirement to apply 25% in Education Maintenance and
Development.
However, as shown above, the revenue decline was lower than expected. Using the ICMS as a tax
variation indicator in the states, we find that declines in education expenditures far exceeded this drop,
as shown in the Figure below, divided by state. Figure 3 also indicates that expenditure reductions
were greater than 20% in GO, AL, RJ, and PI. Furthermore, several states, such as MT, MS, TO, and RR,
registered expressive gains in ICMS yet significantly reduced spending on education.
7Solidary Research Network - Bulletin 27 Mar 05, 2021
Figure 3 - Variation in education expenditures and variation in ICMS revenue (% 2020/2019)
Education Expenses Loss of ICMS
Varation %
Source: Prepared by the authors based on data from the Siconfi/ME
With the closure of schools, one would expect state governments to address education difficulties
amid the pandemic, with investments in remote education and other emergency expenditures to
mitigate educational deficits and prepare for an eventual resumption of in-person classes. However,
Figure 3 shows that several states held back on these expenses. And when it became clear, in the
second half of the year, that tax revenues would not be as low as projected, there was no longer any
time to spend such resources. All these planning flaws now compromise the safe resumption of
teaching activities.
Conclusions
Our analysis of the states' revenues and expenditures revealed that it is not enough to transfer
federal funds in the lack of coordinated efforts and clear guidelines on how much to transfer and how
to use such resources. Our data analysis in this policy brief revealed that some states received more
resources without having suffered ICMS losses. Furthermore, their expenditure on health and
education did not increase.
Tax revenue behavior in 2020 strayed from the expected, primarily due to the emergency basic
income program, which propelled ICMS revenue and prevented further losses for the states.
Along with the reception of federal funds, this situation should have allowed the states to devise a
systematic plan for the pandemic, whether in hospital and epidemiological care or organizing basic
education policies, for safe care in public schools, among other key policies.
8Solidary Research Network - Bulletin 27 Mar 05, 2021
However, that was not what happened. The federal government's delay in transferring resources to
the states (which only began in June 2020), alongside the lack of a national coordination strategy for
these policies and the increasing uncertainty regarding 2021 revenues with the end of the emergency
basic income program, prompted the states to act more prudently and conservatively in their
expenditures. Brazilian states have faced enormous difficulties in their fight against the pandemic.
The situation is likely to worsen as tax revenues could effectively drop given the uncertainty regarding
the emergency basic income program for 2021, which will likely be reduced and last less than 2020.
Moreover, there is no prospect thus far of new fiscal aid from the Federal Government.
The severity of the pandemic and an analysis of the budget data for 2020 provide more than enough
elements for the federal government to improve its synergy with state governments.
Recommendations
• The country needs federal coordination, and the Federal Government must continue to transfer the
necessary resources to states and municipalities, with clear expenditure guidelines for health
policies, dependent on actual revenue losses.
• The federal government must urgently resume the emergency basic income program.
• Public data must be transparent. Furthermore, the general public must be able to access complete
expenditure statements, thus allowing for more detailed analyses on the use of resources.
9Solidary Research Network - Bulletin 27 Mar 05, 2021
ABOUT WHO WE ARE
We are over 100 researchers, actively Coordination Committee
engaged in the task of improving the quality Glauco Arbix (USP), João Paulo Veiga (USP), Fabio Senne
of public policies within federal, state, and (Nic.br), José Eduardo Krieger (InCor-Faculdade de
municipal governments as they seek to act Medicina USP), Rogério Barbosa (CEM-USP, Princeton
amidst the Covid-19 crisis to save lives. We
Brazil Lab), Ian Prates (CEBRAP, Social Accountability
dedicate our energies towards rigorous data
International), Graziela Castello (CEBRAP), Lorena Barberia
collection, devising substantial information,
(USP-Ciência Política), Tatiane Moraes (Fiocruz), and
formulating indicators, and elaborating
models and analyses to monitor and identify Hellen Guicheney (CEM, CEBRAP)
pathways for public policies and review the Scientific Coordination Lorena Barberia (USP)
responses presented by the population.
The Solidary Research Network has Editors Glauco Arbix, João Paulo Veiga, and Lorena Barberia
researchers from all scientific fields Donations and contact redepesquisasolidaria@gmail.com
(Humanities as well as Exact and Biological
Sciences) in Brazil and overseas. For us, the Consultants Alvaro Comin (USP) • Diogo Ferrari
combination of skills and techniques is vital (Universidade de Chicago) • Flavio Cireno Fernandes
as we face the current pandemic. The (Prof. da Escola Nacional de Adm. Pública e Fundação
challenge ahead is enormous, but it is Joaquim Nabuco) • Márcia Lima (USP and AFRO-Núcleo
particularly invigorating. de Pesquisa e Formação em Raça, Gênero e Justiça Racial
And it would never have come to fruition • Marta Arretche (USP and Centro de Estudos da
if it weren’t for the generous contribution of Metrópole - CEM) • Renata Bichir (USP and CEM) • Guy D.
private institutions and donors who swiftly Whitten (Texas A&M University) • Arachu Castro (Tulane
answered our calls. We are profoundly University) • Rogério Barbosa (IESP)
grateful to all those who support us.
Design Claudia Ranzini
Visit our site https://redepesquisasolidaria.org/ Team responsible for Policy Brief No 27
Follow us at Consultants Ursula Dias Peres (USP-EACH, CEM), and
Fábio Pereira dos Santos (São Paulo City Council
Technician)
Partners
Support
10You can also read