CT-Assisted Improvements in the Accuracy of the Intraoperative Frozen Section Examination of Ground-Glass Density Nodules - Hindawi.com
←
→
Page content transcription
If your browser does not render page correctly, please read the page content below
Hindawi
Computational and Mathematical Methods in Medicine
Volume 2022, Article ID 8967643, 8 pages
https://doi.org/10.1155/2022/8967643

Research Article
CT-Assisted Improvements in the Accuracy of the Intraoperative
Frozen Section Examination of Ground-Glass Density Nodules

          Wang Xinli,1 Sun Xiaoshuang,2 Yan Chengxin,3 and Zhang Qiang                                     2

          1
            Department of Pathology, The Second Affiliated Hospital of Shandong First Medical University, Taian City,
            Shandong Province, China
          2
            Shandong First Medical University, Taian City, Shandong Province, China
          3
            Department of Medical Imaging, The Second Affiliated Hospital of Shandong First Medical University, Taian City,
            Shandong Province, China

          Correspondence should be addressed to Zhang Qiang; chinazq007@163.com

          Received 8 December 2021; Revised 20 December 2021; Accepted 21 December 2021; Published 7 January 2022

          Academic Editor: Min Tang

          Copyright © 2022 Wang Xinli et al. This is an open access article distributed under the Creative Commons Attribution License,
          which permits unrestricted use, distribution, and reproduction in any medium, provided the original work is properly cited.

          Objectives. The intraoperative frozen section examination (IFSE) of pulmonary ground-glass density nodules (GGNs) is a great
          challenge. In the present study, through comparing the correlation between the computed tomography (CT) findings and
          pathological diagnosis of GGNs, the CT features as independent risk factors affecting the examination were defined, and their
          value in the rapid intraoperative examination of GGNs was explored. Methods. The relevant clinical data of 90 patients with
          GGNs on CT were collected, and all CT findings of GGNs, including the maximum transverse diameter, average CT value,
          spiculation, solid component, vascular sign, air sign, bronchus sign, lobulation, and pleural indentation, were recorded. All the
          cases received thoracoscopic surgery, and final pathological results were obtained. The cases were divided into three groups on
          the basis of pathological diagnosis: benign/atypical adenomatous hyperplasia (AAH), adenocarcinoma in situ (AIS)/
          microinvasive adenocarcinoma (MIA), and invasive adenocarcinoma (IAC). The CT findings were analyzed statistically, the
          independent risk factors were identified through the intergroup bivariate logistic regression analysis on variables with
          statistically significant differences, and a receiver operating curve (ROC) was plotted to establish a logistic regression model for
          diagnosing GGNs. A retrospective analysis was conducted on the coincidence rate of the rapid intraoperative and routine
          postoperative pathological examinations of the 90 cases with GGNs. The relevant clinical data of 49 cases with GGNs were
          collected. Conventional rapid intraoperative examination and CT-assisted rapid intraoperative examination were performed,
          and their coincidence rates with routine postoperative pathological examinations were compared. Results. No statistical
          differences in the onset age, gender, smoking history, and family history of malignant tumors were found among cases with
          GGNs in the identification of benign/AAH, AIS/MIA, and IAC (P = 0:158, P = 0:947, P = 0:746, P = 0:566). No statistically
          significant difference was found among the three groups in terms of CT findings, such as lobulation, bronchus sign, pleural
          indentation, spiculation, vascular sign, and solid component (P > 0:05). The air sign, the maximum transverse diameter of
          GGNs, and average CT value showed statistically significant differences among the groups (P < 0:001, P < 0:05, P < 0:001).
          Bivariate logistic regression analysis was performed on three risk factors, and the predicted probability value was obtained. A
          ROC curve was plotted by using the maximum transverse diameter as a predictor for analysis between the groups with benign/
          AAH and AIS/MIA, and the results demonstrated that the area under the curve (AUC) was 0.692. A ROC curve was plotted
          by using the predicted probability value, maximum transverse diameter, and average CT value as predictors for distinguishing
          between the groups with AIS/MIA and IAC, and the results showed that the AUC values of the predicted probability value,
          maximum transverse diameter, and CT value were 0.920, 0.816, and 0.772, respectively. A regression model ½Logit ðPÞ = 2:304
           − 2:689X1 + 0:302X2 + 0:011X3 was established to identify GGNs as IAC, obtaining AUC values of up to 0.920 for the groups
          with AIS/MIA and IAC, the sensitivity of 0.821, and the specificity of 0.894. The coincidence rate of rapid intraoperative and
          routine postoperative pathological examinations taken for modeling was 79.3%, that of conventional IFSE and postoperative
          pathological examination in prospective studies was 83.7%, and that of CT-assisted rapid intraoperative and postoperative
          pathological examinations was 98.0%. The former two were statistically different from the last one (P = 0:003 and P = 0:031,
          respectively). Conclusion. The air sign, maximum transverse diameter, and average CT value of the CT findings of GGNs had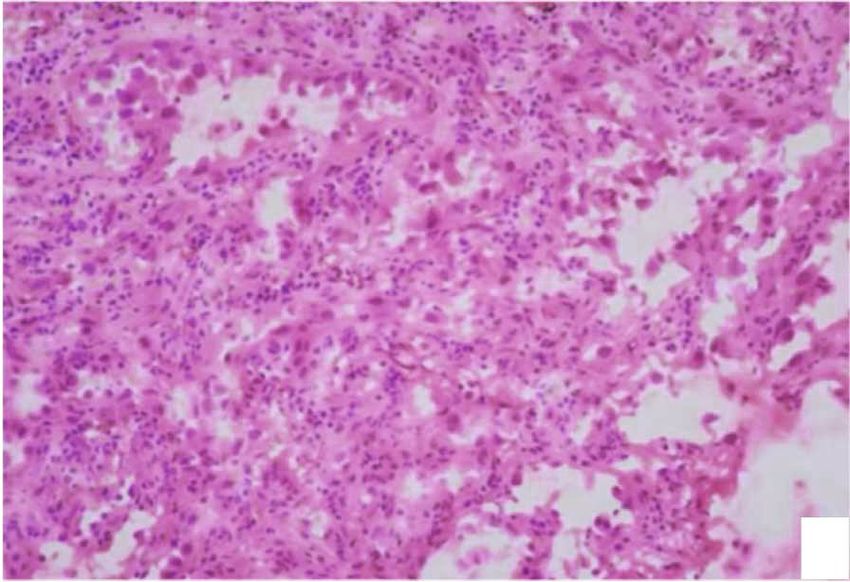
2                                                                        Computational and Mathematical Methods in Medicine

         superior capabilities to enhance the pathologic classification of GGNs. The auxiliary function of the comprehensive multifactor
         analysis of GGNs was better than that of single-factor analysis. CT-assisted diagnosis can improve the accuracy of rapid
         intraoperative examination, thereby increasing the accuracy of the selection of operative approaches in clinical practice.

1. Introduction                                                      from November 2017 to November 2020. The inclusion cri-
                                                                     teria were as follows [5]. All the cases received CT examina-
A ground-glass density nodule (GGN) manifests on com-                tion before surgery with, diagnosis of GGNs, and showed no
puted tomography (CT) as a small region of pulmonary                 distant metastasis [6]. The cases underwent thoracoscopic
nodule with enhanced turbidity [1] and pathologically as             surgery and exhibited routine pathological results after sur-
an active inflammatory process or benign or malignant                 gery [2]. The maximum diameter of GGNs was less than
tumors [2]. With the popularity of low-dose CT, the detec-           or equal to 2 cm [7]. None of the cases received preoperative
tion rate of ground-glass lung nodules (GGNs) has increased          radiotherapy, chemotherapy, or any other treatment [4]. The
annually, and a growing number of cases with early lung              clinical data of the cases were complete which included age,
cancer have been screened out. According to the literature,          gender, smoking history, and family history of malignant
the low-dose CT screening of patients with high risk of lung         tumors.
cancer can reduce the mortality of lung cancer by 20% [3].               Prospective studies: these studies included 49 cases with
    Surgical treatment has been always the most effective for         GGNs that were admitted to and received therapy by the
lung cancer at the early stage. As a result of the two concepts      Department of Thoracic Surgery from December 2020 to
of adenocarcinoma in situ (AIS)/microinvasive adenocarci-            April 2021. The inclusion criteria were the same as those
noma (MIA), as well as the technological advances in thora-          above.
coscopic surgery, the sublobectomy, including wedge                      All the cases provided signed informed consent, and the
resection and pulmonary segmentectomy, has a significant              present study was also approved by the medical ethics com-
benefit in the treatment of early lung cancer [4]. The choice         mittee of the hospital.
of pulmonary wedge resection, segmental resection, or pul-
monary lobectomy is often based on the results of intraoper-         2.2. Histopathological Diagnosis. All tissue specimens were
ative frozen section examination (IFSE). However, the IFSE           obtained through thoracoscopic surgery. Pathological sec-
of pulmonary diseases always has some limitations. Firstly,          tions for IFSE were produced routinely, and the pathological
pathologists can only collect 1–2 specimens from the lesion          diagnosis was given by two senior pathologists. Specimens
area, and the sampling range is very limited. Secondly, given        for routine postoperative pathological examinations were
the limitation of short diagnosis time, the production of fro-       fixed in 10% neutral buffered formalin. The diagnosis was
zen sections is not perfect, and the quality of tissue slices is     performed by two experienced pathologists. If diagnosis
often undesirable, and most importantly, numerous diag-              was difficult, immunohistochemistry was recommended for
nostic traps are encountered in slicing, thus further compli-        assistance. The pathological diagnosis covered benign
cating diagnosis. For GGNs, the differential diagnosis among          lesions, including inflammation, cryptogenic organizing
atypical adenomatous hyperplasia (AAH), AIS, and MIA is              pneumonia, and granulomatous lesions: AAH; AIS; MIA;
dauntingly difficult, to identify whether there is invasion            and invasive adenocarcinoma (IAC) (without distinguishing
and the degree of invasion in the context of inflammation             the histological subtypes of adenocarcinoma). All the cases
and fibrosis, to distinguish collapsed alveoli form adenoid           were divided into three groups on the basis of pathological
structures against the backdrop of alveolar collapse, and to         diagnosis: benign/AAH, AIS/MIA, and IAC.
accurately distinguish true and false papillary structures are
the key points in the diagnosis of GGNs of the lung and also         2.3. CT Examination of GGNs. All the cases were examined
a difficult problem for clinic pathologists.                           by CT in our hospital. Philips Brilliance iCT (Netherlands)
    In this study, the clinical characteristics and CT findings       and GE Lihtspeed VCT (US) were adopted. Each case was
of 90 cases with GGNs were systematically reviewed, the cor-         instructed to lie on their back on the CT couch and to inhale
relation between CT findings and pathological diagnosis was           deeply with both hands above their head. The CT was
statistically analyzed, a regression model for discriminating        allowed to scan from the apex pulmonis to the basis pulmo-
the differential diagnosis of GGNs was established, and pro-          nis. A lung window (width: 1500 HU; level: −600 HU) was
spective studies of 49 cases with GGNs were verified. The             used. All diagnosis reports were completed by two radiolo-
results of the present study showed that CT findings can              gists, and the radiologic characteristics of each case were
assist in improving the accuracy of IFSE and offer good               recorded. The CT findings of GGNs contained the maxi-
guarantees for precise treatment.                                    mum transverse diameter, lobulation, vascular sign, air sign,
                                                                     pleural indentation, spiculation, solid component, and aver-
2. Materials and Methods                                             age CT value.

2.1. Subjects. Retrospective studies: the clinical data of 90        2.4. CT-Assisted IFSE. The CT findings of the cases were
cases with GGNs on CT were collected, and they all admit-            analyzed before surgery, and the characteristics of GGNs
ted to the Department of Thoracic Surgery of the Second              were assessed by using the logistic regression model estab-
Affiliated Hospital of Shandong First Medical University               lished in the present study. When the pathologic
Computational and Mathematical Methods in Medicine 3
manifestations revealed in the IFSE were consistent with the The groups with benign/AAH, AIS/MIA, and IAC were
assessment, the intraoperative pathological diagnosis was compared in terms of the relationships among lobulation,
given. When the pathologic manifestations of rapid intraop- bronchus sign, pleural indentation, spiculation, air sign, vas-
erative examination were inconsistent with the CT-assisted cular sign, and solid component, and only air sign showed
preoperative assessment, the diagnosis was confirmed by differences (P < 0:001) (Table 2). Differences were observed
reviewing specimens, repeated sampling and splicing, and between the groups with benign/AAH and AIS/MIA and
discussion with additional individuals. the group with IAC (P = 0:017 and P < 0:001). However,
no difference was observed between the groups with
2.5. Statistical Methods. By using SPSS19.0 software, the chi- benign/AAH and AIS/MIA (P = 1:00). This result suggested
square test was performed to compare the count data among that air sign was conducive to distinguishing invasive carci-
the three groups, the univariate analysis was conducted on noma from the noninvasive lesions of GGNs.
measurement data, and the t-test was carried out for
between-group comparison. The between-group multivari- 3.3. Analysis of the ROC Curves of the Maximum Transverse
ate logistic regression analysis was performed for factors Diameter and Average CT Value. Bivariate logistic regression
showing differences in the between-group comparison of analysis was performed on the groups with benign/AAH and
the count and measurement data, and the predicted proba- AIS/MIA by using the maximum transverse diameter, air
bility value was retained. By using the obtained factors with sign, and average CT value as independent variables. The
differences as the predictors, a receiver operating curve results are given in Table 3.
(ROC) was plotted to obtain the critical value, sensitivity, Bivariate logistic regression analysis was performed on
and specificity among groups. The chi-square test or Wil- the groups with AIS/MIA and IAC by using the maximum
coxon signed rank test was used for the comparison of the diameter, air sign, and average CT value as independent var-
coincidence rate between intraoperative pathological diag- iables. The results are listed in Table 4.
nosis and final pathological diagnosis. A P value of less than Bivariate logistic regression analysis showed that the
0.05 is considered statistically significant. maximum transverse diameter of GGNs was an independent
risk factor for determining the grouping of benign/AAH and
AIS/MIA, whereas the maximum transverse diameter and
3. Results the average CT value were independent risk factors for dis-
tinguishing between the groups with AIS/MIA and IAC.
3.1. Relationships between Clinical Features and Pathological The ROC curves of the groups with benign/AAH and AIS/
Diagnosis. The average age of 90 cases with GGNs was 59.03 MIA were plotted with the maximum transverse diameter
years old (37-84). Among the cases, 34 were males and 56 as the test variable (Figure 1) with the following results: crit-
were females. A total of 21 cases had histories of smoking, ical value of 10.5 mm, area under the curve (AUC) of 0.692,
and 5 cases had family histories of malignant tumors. The sensitivity of 0.511, specificity pf 0.800, and Youden index of
relationships among the ages, genders, smoking histories, 0.311. These results suggested that the maximum transverse
family histories of malignant tumors, and routine patholog- diameter of 10.5 mm was of predictive significance for dis-
ical diagnoses of the 90 cases were analyzed. However, no tinguishing benign/AAH from AIS/MIA, but had low diag-
significant difference was found (Table 1). nostic value.
The ROC curves of the groups with AIS/MIA and IAC
3.2. Relationships between CT Findings and Pathological were plotted with the maximum transverse diameter of
Diagnosis. The maximum transverse diameter of the 90 cases GGNs and the average CT value as predictors (Figure 2,
with GGNs was 12.40 mm on average, fitted the normal dis- Table 5). The results revealed that when the ROC curve
tribution, and showed statistically significant differences in was plotted with the maximum transverse diameter as the
the comparison of the groups with benign/AAH, AIS/MIA, test variable, the AUC was 0.816, the sensitivity was 0.786,
and IAC (P < 0:001) (Table 2). Differences between the the specificity was 0.613, and the Youden index was 0.531,
groups with benign/AAH and AIS/MIA (P = 0:03) and those indicating that the maximum transverse diameter of
among the groups with benign/AAH, AIS/MIA, and IAC 13.5 mm was of good predictive significance for distinguish-
(P < 0:001) were statistically significant. These results sug- ing between the groups with AIS/MIA and IAC. When the
gested that the maximum transverse diameter of the lesion ROC curve was plotted with the average CT value as the test
contributed to distinguishing the characteristics of GGNs. variable, the AUC was 0.772, the sensitivity was 0.714, the
The average CT value of 90 cases with GGNs was specificity was 0.809, and the Youden index was 0.523, indi-
−489.58HU. Differences among the three groups were statis- cating that the average CT value of −446 HU had good pre-
tically significant (P < 0:001) (Table 2). Differences between dictive significance for distinguishing between the groups
the groups with benign/AAH and AIS/MIA were not statis- with AIS/MIA and IAC. The measurement data and the
tically significant (P = 0:88). Differences between the groups count data were comprehensively analyzed by using the
with benign/AAH and AIS/MIA and the group with IAC bivariate logistic regression model, and a model ½Logit ðPÞ
were statistically significant (P < 0:001). This result sug- = 2:304 − 2:689X1 + 0:302X2 + 0:011X3 for distinguishing
gested that the average CT value was helpful for distinguish- between the groups with AIS/MIA and IAC was obtained
ing invasive carcinoma from the noninvasive lesions of with the AUC of 0.920, the sensitivity of 0.821, the specificity
GGNs. of 0.894, and the Youden index of 0.715.1.4 Computational and Mathematical Methods in Medicine
Table 1: Relationships between the clinical features and pathological diagnosis of 90 cases with GGNs.
Clinical features Benign/AAH AIS/MIA IAC Total P value
Average age (years) 59:80 ± 9:59 57:26 ± 10:21 61:61 ± 8:22 0.158
Gender 0.974
Male 5 18 11 34
Female 10 29 17 56
Smoking history 0.746
Yes 4 9 8 21
No 11 38 20 69
Histories of malignant tumors 0.566
Yes 0 4 1 5
No 15 43 27 85
Table 2: Relationships between the CT findings and pathological diagnosis of the 90 cases with GGNs.
Clinical features Benign/AAH AIS/MIA IAC Total P value
Maximum diameter of GGNs (mm) 8:60 ± 3:92 11:27 ± 4:28 16:16 ± 3:78Computational and Mathematical Methods in Medicine 5
Table 4: Logistic regression analysis on the CT findings of the groups with AIS/MIA and IAC.
Variables B SE Wald OR P value 95% CI
Air sign (X1) −2.689 1.032 6.794 0.068 0.009 0.009–0.513
Maximum transverse diameter (X2) 0.302 0.094 10.368 1.352 0.001 1.125–1.625
Average CT value (X3) 0.011 0.003 10.971 1.011 0.001 1.004–1.017
ROC Curve
1.0
0.8
0.6
Sensitivity
0.4
0.2
0.0
0.0 0.2 0.4 0.6 0.8 1.0
1 - Specificity
Figure 1: ROC curves of the groups with benign/AAH and AIS/MIA.
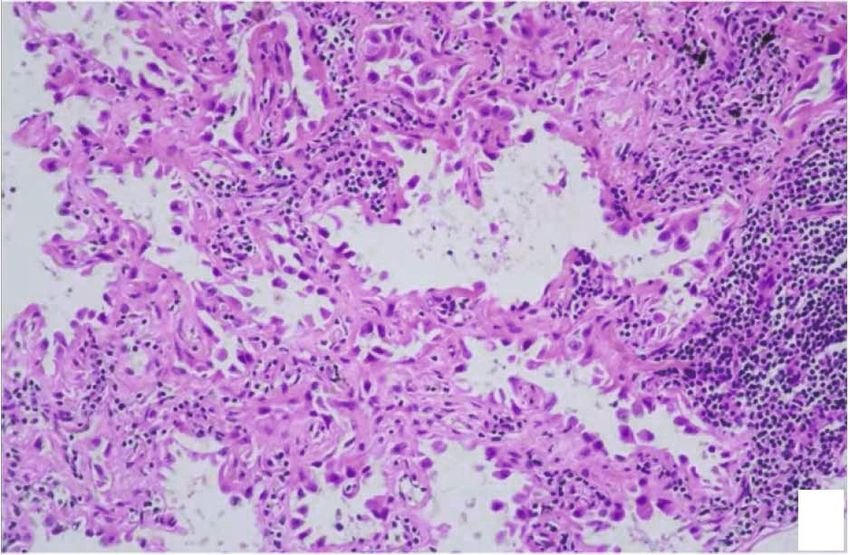
of the group, and 8 out of the 14 cases were diagnosed with pathological examinations. In 2012, Walts and Marchevsky
IAC (Figure 3). The data of a total of 49 cases with GGNs [8] found that the coincidence rate of IFSE with routine
were collected in the prospective studies. The intraoperative postoperative pathological examinations is 68% when the
pathological diagnosis for 8 cases that received conventional diameter of the lung tumor is less than or equal to 1 cm,
IFSEs did not match the findings of routine postoperative and the accuracy rate of IFSE is only 84.3% when the tumor
pathological examinations, and only 1 of the cases that diameter exceeds 1 cm. These low accuracy rates can be
underwent CT-assisted IFSE had the findings inconsistent attributed to the underestimation of AIS and MIA in the
with final diagnosis. As revealed in the retrospective and IFSE. This situation is a common problem and a common
prospective studies, statistically significant differences challenge encountered by pathologists in quickly making
existed between the groups diagnosed with conventional the accurate pathological diagnosis of GGNs during the
IFSE and CT-assisted IFSE in terms of diagnostic coinci- procedure.
dence rate (P = 0:003 and P = 0:031), indicating that CT- With the increasing popularity of low-dose CT, the num-
assisted IFSE could improve the accuracy of intraoperative ber of cases that are being diagnosed in the early stage of lung
diagnosis and facilitate accurate treatment decision-making. cancer is growing [9]. Although CT findings are useful for
assessing the malignant characteristics of GGNs to certain
4. Discussion extent, criteria for specificity are lacking. The importance of
CT findings, such as lobulation, bronchus sign, pleural inden-
Surgical treatment is the clinically preferred treatment for tation, spiculation, air sign, vascular sign, and solid compo-
GGNs with imaging findings that tend to be malignant nent, in the identification of GGNs remains unclear;
lesions. Sublobectomy as a surgical approach for the treat- although, numerous studies have been done by many scholars
ment of early lung cancer has risen significantly with [10]. The present study found that the air sign on CT was
advances in thoracoscopic surgery and the patients’ appeal helpful for the differential diagnosis of benign/AAH, AIS/
for good prognosis. However, considering problems, such MIA, and IAC. Bivariate logistic regression analysis revealed
as metastasis and recurrence, strict standards for sublobect- that the air sign was an independent risk factor for predicting
omy exist, including AIS or IAC as the pathological result GGNs as IAC. The air sign usually occurs at the early stage of
of IFSE. IFSE is pathologically limited by time and the num- lung cancer. It is often manifested with alveolar ectasia and
ber of specimens, and the diagnostic accuracy rate of this bronchiole distortion with peripheral tissues that are not
examination is often lower than that of routine postoperative destroyed by tumors. Consistent with our findings, the results6 Computational and Mathematical Methods in Medicine
ROC Curve
1.0
0.8
0.6
Sensitivity
0.4
0.2
0.0
0.0 0.2 0.4 0.6 0.8 1.0
1 - Specificity
Source of the curve
CT value
Maximum diameter
PRE
Reference line
Figure 2: ROC curves of the groups with AIS/MIA and IAC.
Table 5: ROC curves analysis of the groups with AIS/MIA and IAC.
Critical value Sensitivity Specificity AUC Youden index
Maximum diameter (mm) 13.5 0.786 0.613 0.816 0.531
CT value (HU) −446 0.714 0.809 0.772 0.523
Predicted probability value 0.1523 0.821 0.894 0.920 0.715
(a) (b)
(a) (b)
Figure 3: Case diagnosed with IAC by IFSE (a) and with AIS by routine postoperative pathological examinations (b).Computational and Mathematical Methods in Medicine 7
of Zhan et al. [11] showed that the air sign is suggestive of the be actively taken to reexamine, resample, and reslice speci-
diagnosis of IAC. Although IAC frequently occurs with lobu- mens and discuss with additional individuals to avoid the
lation, pleural indentation, and spiculation, these characteris- misdiagnosis of some GGNs.
tics are not significantly different when GGNs manifest with In summary, the present study found differences among
preinvasive lesions or MIA [7]. the groups with benign/AAH, AIS/MIA, and IAC in terms
The present study found that the maximum transverse of the CT manifestations of GGNs, such as air sign, maxi-
diameter and average CT value are valuable for the identifi- mum transverse diameter, and average CT value. The logis-
cation of GGNs. Nodule size is a useful parameter for evalu- tic regression model established in the present study can
ating the possibility of malignant tumors, and the possibility assist in the analysis of the pathological types of GGNs on
of malignant tumors gradually increases with the diameter CT and has greater value in assisting in the diagnosis than
of nodules. Fan et al. believed that the possibility of malig- the independent use of a single factor. CT-assisted diagnosis
nancy increases by 1.123 times for every 1 mm increase in can significantly improve the diagnostic accuracy of GGNs
nodule diameter [5]. Zhan et al. revealed that IAC is highly in IFSE, thereby improving the accuracy of surgical tech-
likely when the maximum diameter on thin-layer CT is nique selection in clinical practice.
8.12 mm [11]. Zhang suggested that the diameter of GGNs
in IAC is usually greater than or equal to 12.2 mm [12]. In Data Availability
the present study, differences were found among the maxi-
mum transverse diameters of the groups with benign/ The data used to support the findings of this study are avail-
AAH, AIS/MIA, and IAC, and through the bivariate logistic able from the corresponding author upon request.
regression analysis, the maximum transverse diameter was
identified as an independent risk factor for distinguishing Conflicts of Interest
among the three groups. The optimal critical value of the
maximum diameter of the groups with benign/AAH and The authors report no declarations of interest.
AIS/MIA was 10.5 mm, and the AUC was 0.692 and insuffi-
cient to distinguish between the two groups. However, that Acknowledgments
of the groups with benign/AAH and IAC was 13.5 mm with
the sensitivity of 0.786 and the specificity of 0.613, indicating This work was supported by a grant from Shandong Prov-
a superior diagnostic value. These findings were consistent ince Medical and Health Science and Technology Develop-
with the results of previous literature and reports, suggesting ment Plan (No. 202001040967).
that the maximum diameter gradually increases with the
malignancy of GGNs and can be used as a leading reference References
for the grouping of AIS/MIA and IAC. In the present study, [1] V. Mironova and J. D. Blasberg, “Evaluation of ground glass
differences among the average CT value of the three groups nodules,” Current Opinion in Pulmonary Medicine, vol. 24,
were statistically significant. As revealed through the bivari- no. 4, pp. 350–354, 2018.
ate logistic regression analysis, the average CT value was an [2] M. Lederlin, M. P. Revel, A. Khalil, G. Ferretti, B. Milleron, and
independent risk factor for distinguishing between the F. Laurent, “Management strategy of pulmonary nodule in
groups with AIS/MIA and IAC. The optimal critical value 2013,” Diagnostic and Interventional Imaging, vol. 94, no. 11,
of the groups with AIS/MIA and IAC was −446HU with pp. 1081–1094, 2013.
the sensitivity of 0.714 and the specificity of 0.809. There- [3] National Lung Screening Trial Research Team, D. R. Aberle,
fore, the average CT value could be used as a reference index A. M. Adams et al., “Reduced lung-cancer mortality with
for distinguishing non-IAC from IAC. Likewise, Zhou et al. low-dose computed tomographic screening,” The New
found that the average CT value of −583.60 HU (with the England Journal of Medicine, vol. 365, no. 5, pp. 395–409,
sensitivity of 68.8% and the specificity of 66.9%) is a differ- 2011.
ential index for distinguishing non-IAC from IAC [13]. [4] Q. Liu, H. Wang, D. Zhou, X. Deng, J. Min, and J. Dai, “Com-
Kitazawa reflected that −489 HU is an important predictor parison of clinical outcomes after thoracoscopic sublobectomy
for IAC [6]. The increment in the CT value is usually versus lobectomy for stage I nonsmall cell lung cancer: a meta-
believed to be the result of tumor cytosis [14]. analysis,” Journal of Cancer Research and Therapeutics, vol. 12,
no. 2, pp. 926–931, 2016.
Among the 87 cases with GGNs in the retrospective
studies, 18 had IFSE results that were inconsistent with post- [5] L. Fan, S. Y. Liu, Q. C. Li, H. Yu, and X. S. Xiao, “Multidetector
CT features of pulmonary focal ground-glass opacity: differ-
operative pathological diagnosis. Among these cases, 8 with
ences between benign and malignant,” The British Journal of
AIS and MIA were diagnosed as having IAC during the Radiology, vol. 85, no. 1015, pp. 897–904, 2012.
operation, which caused overdiagnosis. Evidently, during
[6] S. Kitazawa, Y. Saeki, N. Kobayashi, S. Kikuchi, Y. Goto, and
the diagnosis of GGNs, distinguishing AIS from MIA was Y. Sato, “Three-dimensional mean CT attenuation value of
the difficulty encountered in the rapid intraoperative exam- pure and part-solid ground- glass lung nodules may predict
ination of GGNs. In prospective studies, CT was used to invasiveness in early adenocarcinoma,” Clinical Radiology,
assist in the analysis of GGNs before surgery. When the vol. 74, no. 12, pp. 944–949, 2019.
results of rapid intraoperative examination are inconsistent [7] J. Liu, W. Li, Y. Huang, D. Mu, H. Yu, and S. Li, “Differential
with the preoperative anticipation and the pathological diagnosis of the MDCT features between lung adenocarcinoma
results are difficult to diagnose, an appropriate method must preinvasive lesions and minimally invasive adenocarcinoma8 Computational and Mathematical Methods in Medicine
appearing as ground-glass nodules,” Zhonghua zhong liu za zhi
[Chinese journal of oncology]., vol. 37, no. 8, pp. 611–616, 2015.
[8] A. E. Walts and A. M. Marchevsky, “Root cause analysis of
problems in the frozen section diagnosis of in situ, minimally
invasive, and invasive adenocarcinoma of the lung,” Archives
of Pathology & Laboratory Medicine, vol. 136, no. 12,
pp. 1515–1521, 2012.
[9] J. Sands, M. C. Tammemägi, S. Couraud et al., “Lung Screening
benefits and challenges: a review of the data and outline for
implementation,” Journal of Thoracic Oncology, vol. 16,
no. 1, pp. 37–53, 2021.
[10] A. Snoeckx, C. Franck, M. Silva, M. Prokop, C. Schaefer-Pro-
kop, and M. P. Revel, “The radiologist's role in lung cancer
screening,” Translational Lung Cancer Research, vol. 10,
no. 5, pp. 2356–2367, 2021.
[11] Y. Zhan, X. Peng, F. Shan et al., “Attenuation and morphologic
characteristics distinguishing a ground-glass nodule measur-
ing 5-10 mm in diameter as invasive Lung adenocarcinoma
on thin-slice CT,” American Journal of Roentgenology,
vol. 213, no. 4, pp. W162–W170, 2019.
[12] Y. Zhang, Y. Shen, J. W. Qiang, J. D. Ye, J. Zhang, and R. Y.
Zhao, “HRCT features distinguishing pre-invasive from inva-
sive pulmonary adenocarcinomas appearing as ground-glass
nodules,” European Radiology, vol. 26, no. 9, pp. 2921–2928,
2016.
[13] Q. J. Zhou, Z. C. Zheng, Y. Q. Zhu et al., “Tumor invasiveness
defined by IASLC/ATS/ERS classification of ground-glass
nodules can be predicted by quantitative CT parameters,”
Journal of Thoracic Disease, vol. 9, no. 5, pp. 1190–1200, 2017.
[14] Y. P. Zhang, M. A. Heuvelmans, H. Zhang, M. Oudkerk, G. X.
Zhang, and X. Q. Xie, “Changes in quantitative CT image fea-
tures of ground-glass nodules in differentiating invasive pul-
monary adenocarcinoma from benign and in situ lesions:
histopathological comparisons,” Clinical Radiology, vol. 73,
no. 5, pp. 504.e9–504.e16, 2018.You can also read