PUBLIC Real Assets Portfolio Review and Real Estate Pacing Study - Sally Haskins - Chicago Teachers ...
←
→
Page content transcription
If your browser does not render page correctly, please read the page content below
May 2021

Real Assets Portfolio Review
and Real Estate Pacing Study

PUBLIC

Sally Haskins
Senior Vice President

Jan Mende
Senior Vice President

Lauren Sertich, CAIA
Senior Vice President
Agenda

● Market Overview
● Real Estate
  – Performance Review
  – Portfolio Summary
  – Pacing Study and Recommendation

● Infrastructure
  – Performance Review
  – Portfolio Summary

● Glossary of Terms
● Disclosures

            Knowledge. Experience. Integrity.   Chicago Teachers’ Pension Fund   2
Market Overview
U.S. Private Real Estate Market Trends

Q1 2021
Results
                                                                                          Last                          Last 3         Last 5       Last 10
  – Hotel and Retail are the most challenged                                             Quarter       Last Year        Years          Years         Years
    sectors while Office faces uncertainty;                  NCREIF ODCE                  1.9%           1.5%            4.0%           5.3%         8.7%
    Industrial remains the best performer.
                                                               Income                     0.8%           3.0%            3.2%           3.3%         3.7%
  – Income remains positive except in Hotel
    sector.                                                    Appreciation               1.1%           -1.5%           0.8%           1.9%         4.8%

  – Appraisers have more certainty on                        NCREIF Property Index        1.7%           2.6%            4.9%           5.9%         9.0%
    pandemic’s impact on valuations.                           Income                     1.0%           4.1%            4.4%           4.5%         5.0%
  – Return dispersion by manager within the
                                                               Appreciation               0.7%           -1.5%           0.5%           1.3%         3.7%
    ODCE Index due to composition of
    underlying portfolios

NCREIF Property Index Returns by Region and Property Type

          Appreciation        Income                                                          3.6%

           1.0%           1.1%           1.1%   1.1% 1.0%                                             1.1%              1.1%            1.1%            1.0%
                                  0.6%                         0.8% 0.9%                                                                         0.7%
    0.3%
                   0.0%

                                                                                                                -0.1%
                                                                              -0.5%
                                                                                      -1.1%
                                                                                                                                 -1.5%
        East        Midwest         South             West      Apartment       Hotel            Industrial        Office           Retail          Total
Source: NCREIF

                  Knowledge. Experience. Integrity.                                                                         Real Assets Portfolio Review       4
U.S. Private Real Estate Market Trends
NCREIF Vacancy ODCE Returns
14% Income Appreciation
20%
12%
10%
10%
0%
8%
197bps -10%
6%
4% -20%
2% -30%
0% -40%
2006 2008 2010 2012 2014 2016 2018 2020 2006 2008 2010 2012 2014 2016 2018 2020
NFI Open End Rent Collections Retail
Apartment Office Industrial
100% 87% 88%
Other* Total
100% 79% 79%
75% 75%
80% 71%
65%
95% 61%
60% 50%
90%
36% 36%
40%
85%
80% 20%
75% 0%
Apr May Jun Jul Aug Sep Oct Nov Dec Jan Feb Mar Apr May Jun Jul Aug Sep Oct Nov Dec Jan Feb Mar
Source: NCREIF, JPMAM, Moody’s Analytics
*Other refers to specialty property types e.g. medical office, life sciences, self-storage, student housing etc.
Knowledge. Experience. Integrity. Real Assets Portfolio Review 5U.S. Private Real Estate Market Trends
U.S. real estate fundamentals Vacancy by Property Type
– Vacancy rates for all property types are or
Apartment Industrial Office Retail
will be impacted. 16%
– Net operating income has declined as retail 14%
continues to suffer. 12%
– 1Q21 rent collections showed relatively 10%
stable income throughout the quarter in the 8%
Industrial, Apartment, and Office sectors. 6%
The Retail sector remains challenged, with
4%
regional malls impacted most heavily.
2%
– Class A/B urban apartments were relatively
0%
strong, followed by Industrial and Office. 2010 2011 2012 2013 2014 2015 2016 2017 2018 2019 2020 2021
– Supply was in check before the pandemic.
– New construction of preleased industrial
Rolling 4-Quarter NOI Growth by Property Type
and multifamily is occurring.
Apartment Industrial Office Retail
20%
10%
0%
-10%
-20%
-30%
-40%
2010 2011 2012 2013 2014 2015 2016 2017 2018 2019 2020 2021
Source: NCREIF
Knowledge. Experience. Integrity. Real Assets Portfolio Review 6U.S. Private Real Estate Market Trends
Pricing and transaction volumes are slowly increasing in 1Q21
NCREIF Rolling 4-Quarter Transaction Totals
Rolling 4-Quarter Transaction Volume (#) Rolling 4-Quarter Transaction Volume ($mm)
$50,000 1,000
$45,000 900
$40,000 800
Transaction Volume ($mm)
$35,000 700
Transaction Volume (#)
$30,000 600
$25,000 500
$20,000 400
$15,000 300
$10,000 200
$5,000 100
$0 0
2010 2011 2012 2013 2014 2015 2016 2017 2018 2019 2020 1Q21
– Transaction volume has dropped off during the quarter with the exception of multifamily and industrial assets with strong-credit
tenants, which are trading at pre-COVID-19 levels.
– Cap rates remained steady during the quarter. The spread between cap rates and 10-year Treasuries is relatively high, leading
some market participants to speculate that cap rates will not adjust much. Price discovery is happening and there are limited
transactions.
– Callan believes the pandemic may cause a permanent re-pricing of risk across property types. Property types with more reliable
cash flows will experience less of a change in cap rates; however, those with less reliable cash flows will see greater adjustments.
Source: NCREIF
Knowledge. Experience. Integrity. Real Assets Portfolio Review 7COVID-19 Impact Heat Map
Real estate and infrastructure assets 1Q2021
Re-development/re-leasing malls
Take-privates of public companies
Workforce housing Recapitalizations/rescue capital
Difficult
Industrial development
Senior housing Certain types of development
Apartment development
Mezzanine, preferred equity, Airports
participating loans Seaports
Roads
Midstream-related energy
Implementation
Real estate owned by distressed/non-
strategic owners
Issues
Moderate
Real estate re-leasing strategies Non-mall retail
Urban class A/B apartments
Low LTV real estate loans Hotels
Waste businesses
Midstream-related energy Mezzanine lending
Roads Broad opportunistic real estate
strategies
Co-working office
E-commerce linked industrial Self-storage
Medical/life science office Class B/C suburban apartments
Low
Mispriced publicly traded infrastructure
Renewables Multi-tenant office
and real estate, both equity and debt
Communications
Utilities
Low Moderate Compelling
Investment
Opportunity
–As the pandemic continues, real estate distress will spread with more severe impact resulting in more opportunities.
–Infrastructure assets with GDP-linked revenue are more impacted currently and will also shift to the right.
Knowledge. Experience. Integrity. Real Assets Portfolio Review 8Real Estate Performance Review
Real Estate Portfolio Summary
December 31, 2020

• CTPF’s market value is slightly under the
                                                                                               $ Millions               (%)
  target allocation, but within the range of 6% to
  12%. Dividends are being reinvested into core CTPF Total Plan Assets                         $12,231.16        100.00%
  funds.                                           Real Estate Target                           $1,100.80              9.00%
• Unfunded commitments include: Basis           Plan's Real Estate Market Value                   $994.04              8.13%
  Investment Group Real Estate Fund I,          Unfunded Commitments                              $235.71              1.93%
  GreenOak US Fund III, Heitman Value
                                                Market Value & Unfunded Commitments             $1,229.75          10.05%
  Partners IV, Longpoint Fund I, Long Wharf VI,
  Oak Street Seeding Fund II, PRISA II, TA
  Realty XII, Longpoint II, Newport Capital
  Partners III, and Heitman Value Partners V.
                                                 Real Estate Market Value
• Portfolio is well positioned with 82% of the
  market value in funds that pursue “Core”                         Non-core
  strategies with income producing properties.                     18%

                                                                                                 Core
                                                                                                 82%

                                                                                      Chicago Teachers’ Pension Fund      10
Real Estate Portfolio Diversification
December 31, 2020
Geographic Diversification
• The real estate portfolio is primarily 43%
located in the U.S. with less than 2% 40.0% 37.6%
in Non-U.S. markets including Asia, 28.5% 29.6%
the United Kingdom, Continental 30.0%
22.7%
Europe and Mexico. 19.4%
20.0%
• Four core property types comprise 9.3% 8.0%
10.0%
88% of the portfolio. Hotels, storage,
1.9% 0.0%
healthcare and other comprise 12%.
0.0%
Property Types in Other include US Eastern US Midwestern US Southern US Western Other
mixed use, for sale residential, Region Region Region Region
student housing, land , manufactured CTPF ODCE
homes, and parking. ODCE does not
break storage and healthcare out
Property Type Diversification
from Other.
40.0%
• Diversification will shift as new 32.1% 29.7%
30.0% 25.2% 24.0%
commitments are called and old 21.4% 21.8%
funds sell properties. 20.0% 15.4% 13.7%
10.0% 4.7% 5.0%
1.0%0.0% 3.3% 0.0% 2.5%0.0%
0.0%
CTPF ODCE
Note: Subtotals reflect actual weights, not the sum of rounded weights shown.
Chicago Teachers’ Pension Fund 11Core/Core Plus and Non Core Real Estate Returns
Periods Ending December 31, 2020
CTPF Core/Core Plus Portfolio CTPF Non-Core Portfolio 9.41%
CTPF Total Real Estate Portfolio Performance Benchmark 8.54% 8.38% 8.87%
5.50% 5.92% 5.69% 5.95%
5.03% 5.17% 5.27%
4.32%
3.99%
2.10% 2.14% 2.14%
1.61%
1.10% 0.95%
0.34%
Last Quarter 1 Year 3 Years 5 Years 10 Years
● All funds, except for UBS Trumbull Property Fund, in the Core/Core Plus Portfolio outperformed the benchmark in the quarter.
Industrial properties continue perform well, as it has done in spite of the pandemic. Given that, Lion Industrial Fund was the best
overall performer. While UBS underperformed due to appreciation due to hotel, retail and office assets, it outperformed the ODCE
income return.
● JP Morgan Strategic Property Fund is the only core/core plus fund to underperform the benchmark income return primarily due to
challenges at various retail centers.
● The Non-Core Portfolio performance improved continued to improve as valuations normalized as transaction activity picked up
pace. GreenOak Fund III underperformed for the quarter due to low vacancy at one of its NYC multifamily assets and suspended
operations at a hotel property. Funds with high industrial allocations, like TA Realty and Longpoint, outperformed as industrial
assets experienced appreciation alongside positive income.
Performance numbers in this presentation are based on quarterly data collected from CTPF investment managers and calculated by Callan beginning in the fourth quarter of 2015. Quarterly
performance history prior to the fourth quarter of 2015 was calculated and provided to Callan by the previous consultant, The Townsend Group. Benchmark is the NFI-ODCE Value-Weight Index, a
time-weighted return Index with an inception date of 12/31/1977. The Index is comprised of 33 open-end commingled funds, in which 23 are still actively investing. Full definition is contained in the
Appendix.
Chicago Teachers’ Pension Fund 12Real Estate Pacing Study and Recommendation
Recap of Activity in 2016, 2017, 2018, 2019, and 2020
$400 million committed to nine managers and 13 funds. Core/core plus portfolio restructured
Multiple searches for Non-core funds to achieve vintage year diversification and to identify MWDBE
managers
Added debt to the portfolio through investment in a top tier large manager and a smaller MWDBE manager.
    • Blackstone Real Estate Debt Strategies High Grade - $40 million commitment in 2016
    • Basis Investment Group (DWDO manager), BIG Real Estate Fund I - $30 million commitment in 2017
    • Basis Investment Group (DWDO manager), BIG Real Estate Fund II - $40 million commitment in 2021

Added two new value-add managers (three funds) to the portfolio.
    • TA Realty Fund XII - $35 million commitment in 2018
    • Heitman Value Partners IV - $35 million commitment in 2018
    • Heitman Value Partners V - $35 million commitment in 2020

Allocated capital to five MWDBE managers (seven funds), with strong track records in diversified strategies.
    • Oak Street Real Estate Capital Fund IV - $25 million commitment (net lease strategy) in 2016
    • Green Oak US Fund III - $25 million commitment (multi-sector value add strategy) in 2017
    • Longpoint Realty Fund I - $20 million commitment (multi-sector value add strategy) in 2017
    • LongWharf Real Estate VI – $35 million commitment (multi-sector value add strategy) in 2018
    • Oak Street SASC II - $20 million commitment (investments in private real estate emerging manager funds) in 2018
    • Longpoint Realty Fund II - $30 million commitment (multi-sector value add strategy) in 2020
    • Newport Capital Fund III - $30 million commitment (small retail strategy) in 2020

Restructured Core/core plus portfolio in 2018
• Capital redeemed from UBS Trumbull redeployed into LaSalle Property Fund, Clarion Lion Industrial Trust and PRISA II.

.
                  Knowledge. Experience. Integrity.                                                  Chicago Teachers’ Pension Fund   14
CTPF Pacing Model – Updated Annually
CTPF Real Estate Market Value $m
Projected Annual Commitments ($m)
(Current/Projected)
Year Non-Core Core Total $1,400
2021 $40* $55** $95 $1,200
21% 21% 19%
25% 23%
2022 $70 $0 $70 $1,000
15%
$800
2023 $70 $0 $70
$600
2024 $70 $0 $70 79% 79% 81%
75% 77%
$400 85%
2025 $70 $0 $70
$200
*$40 million commitment to Basis has already been approved for
2021, no further commitments are projected. $0
**Represents additional allocation to PRISA II approved in 2018. Current YE2021 YE2022 YE2023 YE2024 YE2025
The plan is developed with the following assumptions (and updated annually): Core Non-Core 9% Target
• Target Core/Non-core mix of 75/25;
• Portfolio will be diversified by property type and region via the Core portfolio;
• Dividends are reinvested in the Core portfolio, which is a lever that can be reassessed as needed;
• Non-core is expected to be a return enhancer relative to Core;
• Portfolio will be diversified by manager;
• Investments will be made in primary funds;
• MWDBE managers will continue to factor prominently into the portfolio;
• Investment is expected to be predominately U.S. focused; and
• Non-core portfolio will be anchored by managers/Fund series that CTPF can strategically reinvest with
Knowledge. Experience. Integrity. Chicago Teachers’ Pension Fund 15Conclusion
Recommendation and Action Items
• Consider allocating up to $70 million for the 2022/2023 fiscal year. Primary focus will be re-ups with
strong, existing managers and continuing to seek out new MWDBE managers.
• Elect to receive dividends in cash from 3 core funds: JP Morgan Strategic Property Fund, LaSalle
Property Fund, and PRISA (already receiving cash dividends from UBS Trumbull Property Fund).
Knowledge. Experience. Integrity. Chicago Teachers’ Pension Fund 16Infrastructure Performance Review
Infrastructure Portfolio Summary
December 31, 2020

• Infrastructure comprised 1.8% of the total
                                                                                               $ Millions                (%)
  portfolio on a market value basis compared to
  a target of 2%, and range of 0-4%.            CTPF Total Plan Assets                          $12,231.16        100.00%
                                                 Infrastructure Target                             $244.62              2.00%
• CTPF made its first infrastructure investments
  in 2008 and 2009: one core fund and two non- Plan's Infrastructure Market Value                  $217.40              1.78%
  core funds.                                    Unfunded Commitments                                $50.12             0.41%

• In the past four years, CTPF has made          Market Value & Unfunded Commitments               $267.52              2.19%
  commitments to five additional funds: two core
  funds and three non-core funds.                Market Value
• Unfunded commitments include Brookfield
  Infrastructure III and IV, JLC Fund I, and
  Macquarie Infrastructure Partners V

                                                                                              Core
                                                                                              59%
                                                        Non-core
                                                        41%

                                                                                       Chicago Teachers’ Pension Fund      18
Portfolio Diversification Based on Market Value
December 31, 2020
Geographic Diversification
• Majority of portfolio in developed markets.
• Non-OECD* includes investments in Brazil (data
55%
centers, transport, renewables and utilities), as
well as renewables in India and China.
• Other OECD includes investments in countries
such as Japan and Mexico. 21%
7% 8% 6%
• Transportation comprised the largest share of the 2%
portfolio.
US& OECD Non-OECD United Other OECD Australia
• Utilities, renewables and ‘other’ together Canada Europe Kingdom
comprised over half of the portfolio.
• Sector ‘other’ includes social infrastructure, waste Sector Diversification
and oil storage investments.
24%
22% 21%
16%
12%
5%
Transport Other Utilities Renewables Energy Communication
*Organisation for Economic Co-operation and Development (“OECD”): 36 member countries that represent circa 80% of world trade.
Chicago Teachers’ Pension Fund 19Infrastructure Portfolio Performance
Periods Ended December 31, 2020
CTPF Infrastructure Portfolio Benchmark
10.11%
7.94% 7.58% 8.04% 7.71% 7.01%
6.03%
4.71%
2.82%
-3.74%
Last Quarter 1 Year 3 Years 5 Years 10 Years
● Infrastructure is a developing asset class and as of today, there is no industry standard benchmark
for private infrastructure investors. The benchmark is public-markets based and reflects public
markets performance volatility in the past year.
● Six of the seven infrastructure funds had positive performance in Q4 2020, only JLC Infrastructure
Fund I, which is early in its Fund life, had slightly negative performance. There was slight
depreciation for the Fund during the quarter.
● CTPF has outperformed the benchmark over the longer term (1 Year, 3 Year, 5 Year and 10 Year).
In the fourth quarter of 2017, the annualized 8% infrastructure benchmark was replaced with the FTSE Developed Core Infrastructure 50/50 Index.
Chicago Teachers’ Pension Fund 20Glossary of Terms and Disclaimer
Definitions
Style Groups
Total Real Estate DB: The Total Real Estate Funds Database consists of both open and closed-end commingled funds managed by real estate firms that report to
the Callan Database.

Open-End Real Estate: The Open-End Real Estate Database consists of all open end real estate funds that report to the Callan Database.

Real Estate Value Added: The Real Estate Value Added Database consists of all real estate funds that manage to a value add strategy and report to the Callan
Database.

Real Estate Opportunistic: The Real Estate Opportunistic Database consists of all real estate funds that manage to a value add strategy and report to the Callan
Database.

REIT Global DB: The REIT Global Database consists of products investing in global equity real estate through portfolios consisting primarily of equity Real Estate
Investment Trusts (REIT). The Database is comprised of returns for both separate account composites and commingled vehicles.

*The above groups are based on time-weighted returns.

Vintage Year Database Groups: The Vintage Year Groups are comprised of all funds that report to the database with the initial drawdown taking place in the
labeled year. These groups are based on IRRs derived from the cash flows submitted to the Callan Database.

Indices
Stylized Index: Weights the various style group participants to be comparable to the investor portfolio holdings for each period.

NAREIT Equity Index: This is an index of Equity Real Estate Investment Trust returns reflecting the stock value changes of REIT issues as determined through
public market transactions.

The NFI-ODCE Value-Weight Index is a time-weighted return Index with an inception date of 12/31/1977. The Index is comprised of 33 open-end commingled
funds, in which 23 are still actively investing. Inclusion within the Index requires (a) minimum of 80% of net fund assets invested in the multifamily, retail, industrial,
office, or hotel property type, (b) maximum of 20% of net fund assets invested in real estate debt or private/public company equity, (c) at least 80% of net assets
invested in properties with a minimum occupancy of 60%, (d) no more than 70% of real estate net assets invested in a single property type or region, (e) maximum
of 40% leverage, and (f) at least 95% of net real estate assets invested within the U.S. market.

                   Knowledge. Experience. Integrity.                                                                             Chicago Teachers’ Pension Fund          22
Definitions
Terms
Beginning Market Value: Value of real estate, cash and other holdings from prior period end.
Contributions: Cash funded to the investment for acquisition and capital items (i.e., initial investment cost or significant capital improvements).
Distributions: Actual cash returned from the investment, representing distributions of income from operations. Withdrawals: Cash returned from the investment,
representing returns of capital or net sales proceeds.
Ending Market Value: The value of an investment as determined by actual sales dollars invested and withdrawn plus the effects of appreciation and reinvestment;
market value is equal to the ending cumulative balance of the cash flow statement (NAV).
Unfunded Commitments: Capital allocated to managers which remains to be called for investment. Amounts are as reported by managers.
Remaining Allocation: The difference between the ending market value + the unfunded commitments and the target allocation. This figure represents dollars
available for allocation.
Core: Direct investments in operating, fully leased, office, retail, industrial, or multifamily properties using little or no leverage (normally less than 30%).
Value-Added: Core returning investments that take on moderate additional risk from one or more of the following sources: leasing, re-development, exposure to
non-traditional property types, the use of leverage.
Opportunistic: Investments that take on additional risk in order to achieve a higher return. Typical sources of risks are: development, land investing, operating
company investing, international exposure, high leverage, distressed properties.
Non Core: Includes both value added and opportunistic strategies
Vintage Year: Year of first drawdown
Knowledge. Experience. Integrity. Chicago Teachers’ Pension Fund 23Definitions - Performance
Capitalization rate: Commonly known as cap rate, is a rate that helps in evaluating a real estate investment. Cap rate = Net operating income / Current market
value (Sales price) of the asset.
Net operating income: Commonly known as NOI, is the annual income generated by an income-producing property after taking into account all income collected
from operations, and deducting all expenses incurred from operations.
Real Estate Appraisal: The act of estimating the value of property. A real estate appraisal may take into account the quality of the property, values of surrounding
properties, and market conditions in the area.
Income Return (“INC”): Net operating income net of debt service before deduction of capital items (e.g., roof replacement, renovations, etc.)
Appreciation Return (“APP”): Increase or decrease in investment's value based on internal or third party appraisal, recognition of capital expenditures which did
not add value or uncollectible accrued income, or realized gain or loss from sales.
Total Gross Return: The sum of the income return and appreciation return before adjusting for fees paid to and/or accrued by the manager.
Total Net Return: Total gross return less Advisor fees reported. All fees requested (asset management, accrued incentives, paid incentives). No fee data is verified.
Inception Returns: The total net return for an investment or portfolio over the period of time the client has funds invested. Total portfolio Inception Returns include
returns from investments no longer held in the current portfolio.
Net IRR: IRR after advisory fees, incentive and promote. This includes actual cash flows and a reversion representing the LP Net Assets at market value as of the
period end reporting date.
Equity Multiple: The ratio of Total Value to Paid-in-Capital (TVPIC). It represents the Total Return of the investment to the original investment not taking into
consideration the time invested. Total Value is computed by adding the Residual Value and Distributions. It is calculated net of all investment advisory and incentive
fees and promote.
DPI Multiple: The ratio of distributions paid to the investor divided by the amount of contributions paid by the investor. It is calculated net of all investment advisory
and incentive fees and promote.
Sharpe Ratio: Sharpe Ratio is a measure of the risk-adjusted return of a portfolio. The ratio represents the return gained per unit of risk taken. The risk of the
portfolio is the Standard Deviation of the portfolio returns.
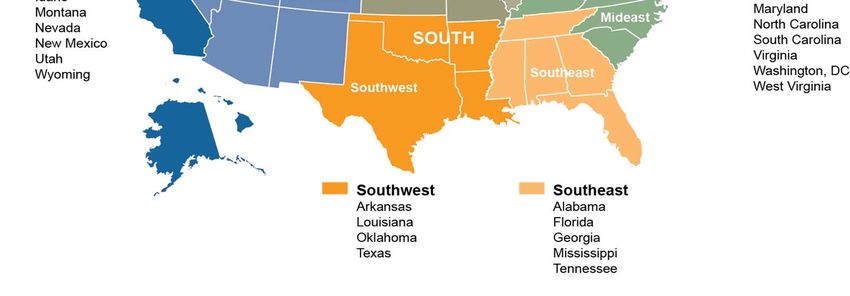
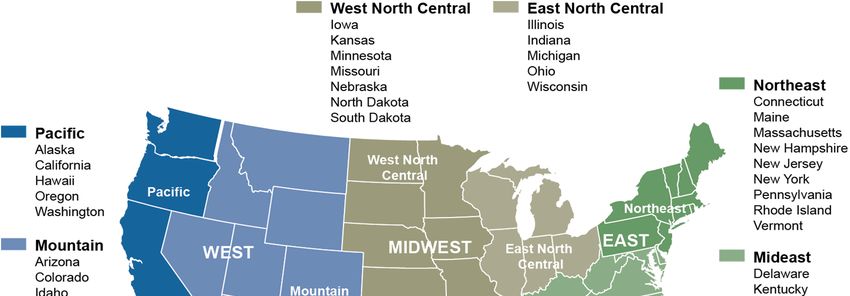
Knowledge. Experience. Integrity. Chicago Teachers’ Pension Fund 24NCREIF Region Map
Geographic Regions and Divisions
Source: NCREIF
Knowledge. Experience. Integrity. Chicago Teachers’ Pension Fund 25Disclaimers
This report is for informational purposes only and should not be construed as legal or tax advice on any matter. Any decision you make on the basis of this content is
your sole responsibility. You should consult with legal and tax advisers before applying any of this information to your particular situation.
This report may consist of statements of opinion, which are made as of the date they are expressed and are not statements of fact.
Reference to or inclusion in this report of any product, service or entity should not be construed as a recommendation, approval, affiliation or endorsement of such
product, service or entity by Callan.
Past performance is no guarantee of future results.
The statements made herein may include forward-looking statements regarding future results. The forward-looking statements herein: (i) are best estimations
consistent with the information available as of the date hereof and (ii) involve known and unknown risks and uncertainties such that actual results may differ
materially from these statements. There is no obligation to update or alter any forward-looking statement, whether as a result of new information, future events or
otherwise. Undue reliance should not be placed on forward-looking statements.
Performance numbers in this presentation are based on quarterly data collected from CTPF investment managers and calculated by Callan Associates beginning in
the fourth quarter of 2015. Quarterly performance history prior to the fourth quarter of 2015 was calculated and provided to Callan by the previous consultant, The
Townsend Group.
Knowledge. Experience. Integrity. Chicago Teachers’ Pension Fund 26You can also read