CTP Scheme Insights Q3 (Jul-Sep) 2020 - Motor Accident Insurance Commission
←
→
Page content transcription
If your browser does not render page correctly, please read the page content below
CTP Scheme Insights Q3 (Jul-Sep) 2020
Overview
Queensland’s CTP insurance scheme remains very
healthy, preserving its core strengths of affordability,
fairness, efficiency and responsiveness.
From July to September 2020:

   •   CTP insurance premiums remained stable and affordable when
       measured as a percentage of Queenslanders’ Average Weekly Earnings
   •   new claims were below previous years’ levels, potentially as a result of 2019 scheme reforms and
       recent changes in road usage
   •   overall, the number of registered vehicles restored to pre-COVID levels
   •   MAIC continued to monitor insurers’ claims management practices including claims durations and
       stages of settlement to understand variations between insurers, where those exist
   •   our investigations into suspected car crash scamming continued with the aim to preserve scheme
       integrity and protect Queenslanders from harassing scam calls (learn more)
   •   we enabled and supported collaboration across scheme stakeholders to ensure injured people were
       able to access treatment and to resolve their claims.

As we move into the last quarter of 2020, we will:

   •   explore how digitisation could improve the rehabilitation process for claimants and industry
       stakeholders
   •   commence publication of claims management standards for licensed insurers
   •   further develop our claim farming investigation and prosecution framework
   •   promote measures to ensure the scheme is safe and respectful in supporting First Peoples injured in
       car crashes through no fault of their own.

Please explore our interactive graphs below to learn more about our scheme’s performance.

Stay in the loop

   •   Sign up to our newsletter
   •   Provide your feedback

Affordability
When measured as a percentage of Average Weekly Earnings, Queensland has the most affordable CTP
insurance premiums in Australia. From 1 July to 30 September 2020, the Class 1 premium ($351.60) was
21.4 per cent of Average Weekly Earnings.
Affordability index

                                    45%

0%
                             21.4%                                            100%
Notes:
Class 1 premium as at 30 September 2020 ($351.60) is 21.4% of Average Weekly Earnings ($1,645.40).
The affordability index compares the Class 1 premium to the Queensland full-time adult persons ordinary time weekly earnings
in the original series (produced by the Australian Bureau of Statistics), at the end of the underwriting period.

CTP premium breakdown

Despite the uncertainties presented by COVID-19, CTP insurance premiums remained affordable and steady
over time, and close to the level in the same quarter last year.

         Insurer's premium          Insurer expenses and profit        CTP levies and fee          NIISQ levy
400

350

300

250

200

150

100

 50

  0
      2017 Q4   2018 Q1   2018 Q2   2018 Q3   2018 Q4   2019 Q1   2019 Q2   2019 Q3   2019 Q4   2020 Q1   2020 Q2   2020 Q3

Notes:
Class 1 premium as at 30 September 2020.
Insurer's premium is the amount the insurer will receive for taking on the risk and includes the risk premium and GST but
excludes expenses.
Insurer expenses and profit includes claims handling expenses, policy expenses, reinsurance expenses, and insurer profits.
CTP levies and fee includes Hospital and Emergency Services levy, Nominal Defendant levy, Statutory Insurance Scheme
levy, and Queensland Department of Transport and Main Roads administration fee.
NIISQ levy is for the National Injury Insurance Scheme, Queensland (NIISQ). Learn more about the NIISQ levy.
Insurer market share

There was no material change in market share in the past quarter.

          Suncorp        Allianz       QBE          RACQI
100 %

 80 %

 60 %

 40 %

 20 %

  0%

Note: data refers to three-month rolling averages as at 30 September 2020.

Number of motorists switching insurers

We continued to see modest but increasing signs of vehicle owners switching their CTP insurer. The top
three reasons motorists reported for switching were: seeing a reminder in the CTP notice sent with their
vehicle registration renewal, being prompted by an insurer when contacting them about their other insurance
policies or receiving a letter from their insurer.

35 ,000

30 ,000

25 ,000

20 ,000

15 ,000

10 ,000

 5 ,000

     0

Note: as at 30 September 2020.
Efficiency
The efficiency of a CTP insurance scheme can be judged by how well insurer delivery costs are controlled
while maximising the amount paid to the benefit of the injured person. A best-practice benchmark for a
privately-underwritten scheme is for at least 60 per cent of CTP insurance premiums to be delivered as
claimant benefits. Each year, we measure the prior five-year average of these figures, and our last
measurement not only improved on the 2019 result but also exceeded the best-practice benchmark by six
per cent.
Current claimant benefits
60%
66%
5-year average to December 2019 (5% higher than the past 5-year average)
Current delivery costs
40%
34%
5-year average to December 2019 (5% lower than the past 5-year average)
Ensuring timely resolution of claims
Our legislation requires insurers to deal with claims as quickly as possible. Insurers must decide liability
within six months from receiving a compliant claim. Despite the challenges presented by COVID-19, MAIC,
insurers and lawyers worked collaboratively to continue resolving claims quickly.
of claims met this
More than 99% requirement in the last 12
months.*
Legally-represented claimants – Average claim duration (months)
Note: claims added 1 October 2019 to 30 September 2020 with a liability decision.Legally-represented claimants – Average claim duration (months)
Notification to compliance Compliance to liability Liability to settlement Settlement to finalisation
Allianz
QBE
RACQI
Suncorp
0 5 10 15 20 25 30
Note: legally represented, finalised claims from 1 October 2019 to 30 September 2020.
Direct claimants – Average claim duration (months)
Notification to compliance Compliance to liability Liability to settlement Settlement to finalisation
Allianz
QBE
RACQI
Suncorp
0 5 10 15 20 25 30
Note: direct claimants, finalised claims from 1 October 2019 to 30 September 2020.
Claims settled before, during or after compulsory conference (CC) by insurer
Settled prior to CC Settled at or w ithin 14 days of C… Settled more than 14 days from… Settled, w ith proceedings issued
Allianz
QBE
RACQI
Suncorp
Industry
0% 20% 40% 60% 80% 100%
Note: claims finalised from 1 October 2019 to 30 September 2020.
MAIC is continuing to monitor insurers’ claims management practices including claim durations and stages of
settlement. Where variations exist between insurers, MAIC is analysing the data and consulting with insurers
to understand the reasons behind it.
Fairness
Our scheme enables people who are injured wholly or partly due to the actions of another driver to claim fair
and timely compensation and access rehabilitation. The compensation paid to the injured party depends on
the extent of their injuries that result from the motor vehicle crash and how these injuries affect their work andsocial functioning. Compensation can include the cost of medical treatment, rehabilitation, loss of income
and care services.
Total payments by heads of damage for finalised claims
Economic loss
past and future
Care & medical
General
damages
Claimant legal
Insurer legal &
inv estigation
Other
Recov eries
-100M 0 100M 200M 300M 400M
Notes:
Claim finalised between 1 October 2019 to 30 September 2020.
Other includes home and vehicle modifications, aids and appliances.
Recoveries include money recovered from insured, other parties, uninsured driver/owners or interstate insurers.
Number of new claims per quarter
New claim numbers are trending down compared to previous years. For the same period in 2019, new claims
per quarter were down by 17 per cent last quarter, and 12 per cent this quarter. Most claims involve
Queensland residents seeking assistance from Queensland law firms.
QLD legal firm Direct claimant Non-QLD legal firm
2 ,000
1 ,500
1 ,000
500
0
2017 Q4 2018 Q1 2018 Q2 2018 Q3 2018 Q4 2019 Q1 2019 Q2 2019 Q3 2019 Q4 2020 Q1 2020 Q2 2020 Q3
Proportion of claims added per quarter
QLD legal firm Direct claimant Non-QLD legal firm
100 %
75 %
50 %
25 %
0%
2017 Q4 2018 Q1 2018 Q2 2018 Q3 2018 Q4 2019 Q1 2019 Q2 2019 Q3 2019 Q4 2020 Q1 2020 Q2 2020 Q3Number of claims added per quarter by severity
Severity - Minor Severities - Moderate or above
2 ,500
2 ,000
1 ,500
1 ,000
500
0
2017 Q4 2018 Q1 2018 Q2 2018 Q3 2018 Q4 2019 Q1 2019 Q2 2019 Q3 2019 Q4 2020 Q1 2020 Q2 2020 Q3
Notes:
The severity of claims is coded based on the Abbreviated Injury Score (AIS) which is a six-point scale where one represents a
minor injury and six is maximal.
An AIS code of 9 is used to describe injuries for which not enough information is available for more detailed coding.
A ‘moderate injury’ is classified as one with an AIS of 2.
Where a claimant has sustained multiple injuries, we summarise their injuries based on the most severe injury they sustained.
Recent data is subject to development. Claims being coded as AIS 9 are grouped into ‘Severity – Minor’ as a majority of these
claims had been converted to AIS 1 (minor injury) after sufficient information was received.
Responsiveness
Our scheme responds to meet the needs of a wide range of people of different ages, genders, types of
crashes and roles in crashes. Our improved analytics capabilities also enable us to better understand and
respond to changes in the scheme experience.
Over recent months, the scheme has responded quickly and effectively to changes arising from COVID-19.
This enabled injured people to continue submitting new claims, to access treatment, and for claim
settlements to occur. It also ensured that medical and allied health service providers were able to continue
assisting injured people and to be paid in a timely manner for their services.
Number of registered vehicles by vehicle class
The number of vehicle registrations rebounded in quarter 3 2020 resulting in a steady increase in the size of
the overall vehicle fleet in Queensland. However, vehicles registrations in class 3 (taxis), class 4 (hire
vehicles) and class 26 (booked hire vehicles and limos) remain lower than the level they were at before
COVID-19.4 ,500 ,000
4 ,000 ,000
3 ,500 ,000
3 ,000 ,000
2 ,500 ,000
2 ,000 ,000
1 ,500 ,000
1 ,000 ,000
500 ,000
0
Age groups of claimants by gender
Female Male
3 ,000
2 ,500
2 ,000
1 ,500
1 ,000
500
0
0 to 5 6 to 15 16 to 25 26 to 35 36 to 45 46 to 55 56 to 65 66 or older
Note: all claims for crashes from 1 October 2017 to 30 September 2020, where relevant details are available.Claim severity Claimant role Crash details Notes: Crashes from 1 October 2017 to 30 September 2020. The severity of claims is coded based on the Abbreviated Injury Score (AIS), which is a six-point scale where one represents a minor injury and six is maximal. An AIS code of 9 (also labelled as ‘admin’) is used to describe injuries for which not enough information is available for more detailed coding.
Queensland crash claims by region
Metropolitan areas experience more crashes than regional areas and have a higher proportion of minor and
moderate injuries compared to regional areas. Regional areas experience fewer crashes than metropolitan
areas but have a higher proportion of severe injuries.
≥ 106
≥ 486
≥ 866
≥ 1,246
≥ 1,626
≥ 2,006
≥ 2,386
≥ 2,766
Notes:
Data refers to claims for crashes from 1 July 2017 to 30 June 2020.
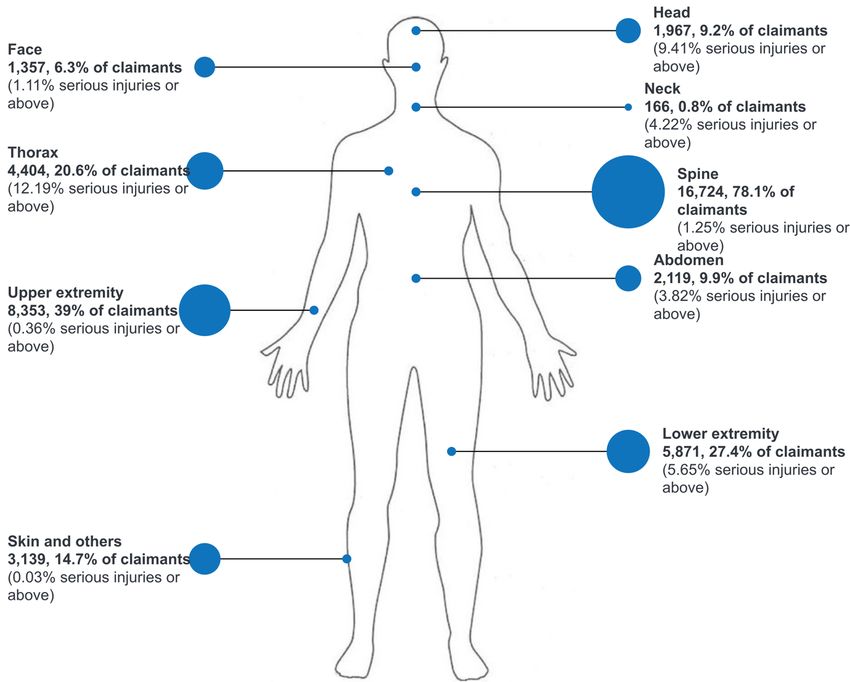
A ‘serious injury’ is classified as one with an AIS of 3.Injuries by body regions Over the past three years, more than 78 per cent of claimants experienced spinal injuries (including whiplash). Out of these claimants, 1.3 per cent experienced severe spine injuries. Amongst the nine injured body regions, thorax is most likely to be seriously injured (12.2 per cent), followed by head (9.4 per cent). In addition to the trauma injuries illustrated in the following graph, more than 24 per cent of the claimants experienced psychological conditions. Notes: All claims for crashes from 1 July 2017 to 30 June 2020. Trauma injuries only. Psychological condition and delayed consequence of crash are excluded. Counts are number of claimants who have experienced injuries on the respective body region. A claimant may experience injuries on multiple body regions. A ‘serious injury’ is classified as one with an AIS of 3. Whiplash based on AIS2005 are reported under Spine. Sadly, we have also received 184 claims for people who passed away. They are excluded from this diagram because injury coding was not required in their CTP insurance claim process.
Number of crashes per time and day of week

Crashes were most likely to occur between 3pm and 6pm on weekdays. There were significantly less
crashes at night time than during the day.

             12:00am-2:59am   3:00am-5:59am     6:00am-8:59am   9:00am-11:59am    12:00pm-2:59pm   3:00pm-5:59pm   6:00pm-8:59pm   9:00pm-11:59pm

  Monday

  Tuesday

Wednesday

 Thursday

    Friday

  Saturday

   Sunday

             ≥48     ≥148      ≥249      ≥349       ≥449        ≥549     ≥650       ≥750

Note: crashes that occurred between 1 July 2017 and 30 June 2020 and caused one or more CTP insurance claims.

Percentage of serious crashes per time and day of week

Although fewer accidents occurred at night time, the proportion of serious crashes is significantly higher,
especially on weekends.

             12:00am-2:59am   3:00am-5:59am     6:00am-8:59am   9:00am-11:59am    12:00pm-2:59pm   3:00pm-5:59pm   6:00pm-8:59pm   9:00pm-11:59pm

  Monday

  Tuesday

Wednesday

 Thursday

    Friday

  Saturday

   Sunday

             ≥3.2%   ≥6.7%     ≥10.3%    ≥13.8%     ≥17.3%      ≥20.8%   ≥24.3%     ≥27.9%

Notes:
Serious crash is a car crash that results in one or more seriously injured claimants.
Seriously injured claimant has an AIS of 3 or above.

Want to learn more? Contact our Analytics team.

Share your feedback on this report through our quick survey
You can also read