CULP, INC. Investor Information - December 8, 2021 - Culp Inc
←
→
Page content transcription
If your browser does not render page correctly, please read the page content below
CULP, INC.
Investor Information
December 8, 2021

                   1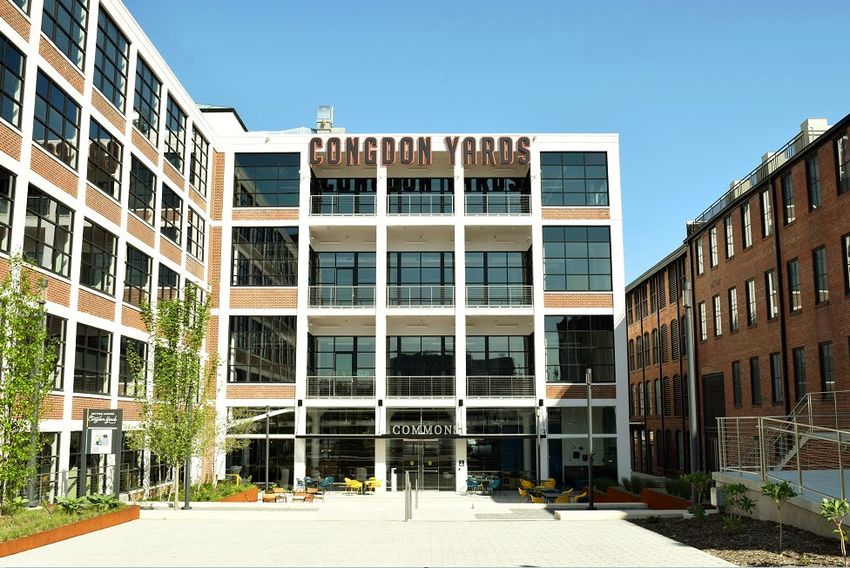
FORWARD LOOKING STATEMENTS
 This presentation contains “forward-looking statements” within the meaning of the federal securities laws, including the Private Securities Litigation Reform Act of 1995
 (Section 27A of the Securities Act of 1933 and Section 21E of the Securities and Exchange Act of 1934). Such statements are inherently subject to risks and uncertainties that
 may cause actual events and results to differ materially from such statements. Further, forward looking statements are intended to speak only as of the date on which they
 are made, and we disclaim any duty to update such statements to reflect any changes in management’s expectations or any change in the assumptions or circumstances on
 which such statements are based, whether due to new information, future events, or otherwise. Forward-looking statements are statements that include projections,
 expectations, or beliefs about future events or results or otherwise are not statements of historical fact. Such statements are often but not always characterized by
 qualifying words such as “expect,” “believe,” “anticipate,” “estimate,” “intend,” “plan,” “project,” and their derivatives, and include but are not limited to statements
 about expectations for our future operations, production levels, new product launches, sales, profit margins, profitability, operating income, capital expenditures, working
 capital levels, income taxes, SG&A or other expenses, pre-tax income, earnings, cash flow, and other performance or liquidity measures, as well as any statements regarding
 potential acquisitions, future economic or industry trends, public health epidemics, or future developments. There can be no assurance that we will realize these
 expectations, meet our guidance, or that these beliefs will prove correct.

 Factors that could influence the matters discussed in such statements include the level of housing starts and sales of existing homes, consumer confidence, trends in
 disposable income, and general economic conditions. Decreases in these economic indicators could have a negative effect on our business and prospects. Likewise, increases
 in interest rates, particularly home mortgage rates, and increases in consumer debt or the general rate of inflation, could affect us adversely. The future performance of our
 business depends in part on our success in conducting and finalizing acquisition negotiations and integrating acquired businesses into our existing operations. Changes in
 consumer tastes or preferences toward products not produced by us could erode demand for our products. Changes in tariffs or trade policy, or changes in the value of the
 U.S. dollar versus other currencies, could affect our financial results because a significant portion of our operations are located outside the United States. Strengthening of
 the U.S. dollar against other currencies could make our products less competitive on the basis of price in markets outside the United States, and strengthening of currencies
 in Canada and China can have a negative impact on our sales of products produced in those places. Also, economic or political instability in international areas could affect
 our operations or sources of goods in those areas, as well as demand for our products in international markets. The impact of public health epidemics on employees,
 customers, suppliers, and the global economy, such as the global coronavirus pandemic currently affecting countries around the world, could also adversely affect our
 operations and financial performance. In addition, the impact of potential goodwill or intangible asset impairments could affect our financial results. Increases in freight
 costs, labor costs, and raw material prices, including increases in market prices for petrochemical products, can also significantly affect the prices we pay for shipping, labor,
 and raw materials, respectively, and in turn, increase our operating costs and decrease our profitability. Finally, disruption in our customers’ supply chains for non-fabric
 components may cause declines in new orders and/or delayed shipping of existing orders while our customers wait for other components, which could adversely affect our
 financial results. Further information about these factors, as well as other factors that could affect our future operations or financial results and the matters discussed in
 forward-looking statements, is included in Item 1A “Risk Factors” in our recent Form 10-K and Form 10-Q reports filed with the Securities and Exchange Commission. A
 forward-looking statement is neither a prediction nor a guarantee of future events or circumstances, and those future events or circumstances may not occur.

                                                                                   2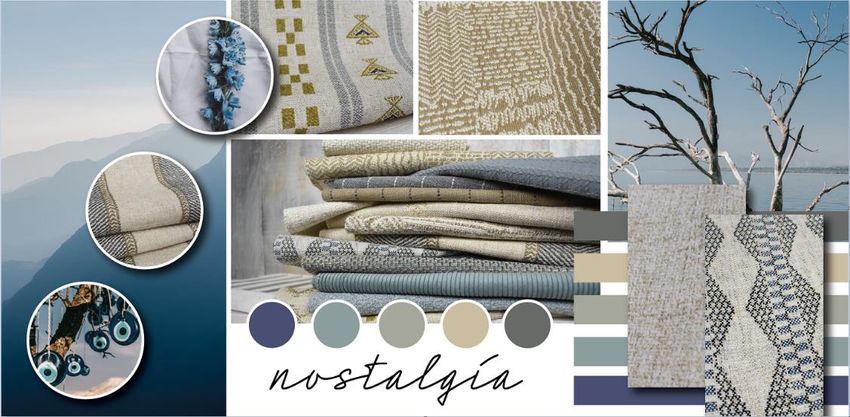
CULP AT A GLANCE
Manufactures, sources, and markets Culp Business Segments
mattress fabrics and upholstery fabrics for • Mattress Fabrics - Woven jacquard, knitted, including
the furniture and bedding industries in mattress covers, and converted fabrics for use in the
North America and internationally. production of bedding products
• 53% of sales in FY 2021
Global manufacturing and sourcing
operations in the U.S., Canada, China,
Haiti, Vietnam, and Turkey.
Major clients include: Ashley Furniture,
Casper, Corsicana, Flexsteel, Fusion
Furniture, Kuka Home, La-Z-Boy, Resident
Home, Serta Simmons Bedding, • Upholstery Fabrics - For use in the production of
Tempur+Sealy, and others. residential and commercial upholstered furniture
• 47% of sales in FY 2021
Transformed business model.
Founded in 1972.
Experienced, long-term management
team.
3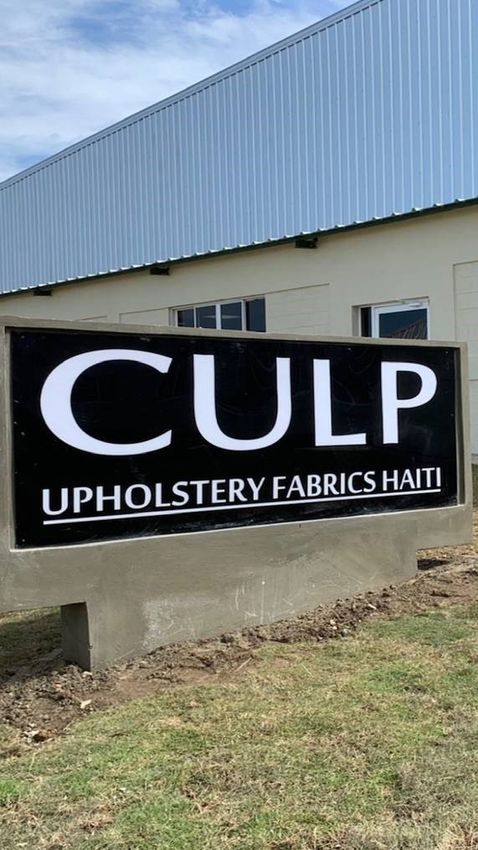
CULP KEY FACTS
Key Facts Other
NYSE : CULP Full-time Employees Worldwide : 1,540 (3)
Annual Indicated Dividend: $0.46 Fiscal Year Ends: Sunday closest to April 30
Dividend Yield: 4.34%(1) Public Accounting Firm: Grant Thornton
52-Week Range: $10.11 - $17.88 (2) Website: www.culp.com
Shares Outstanding: 12,709,810(3) Corporate Headquarters: High Point, NC
FY2021 Revenues: $300 million
Experienced, Long-Term Management Team
NYSE: CULP - Share Pricing
19
17
15
Capital Structure 13
Strong Balance Sheet 11
9
Total Cash & Investments: $36.6 million (3) 7
No Outstanding Debt (3) 5
Shareholders’ Equity: $128.5 million (3)
NYSE: CULP – Share Pricing
(1) Based on annual indicated dividend of $0.46 per share and closing stock price of $10.61 on November 30, 2021.
(2) As of November 30, 2021
(3) As of October 31, 2021
4
INNOVATION LEADER, FOCUSED ON HIGH
PERFORMANCE

           The      Capital        The
         Company   Allocation   Platforms

                    5
KEY INVESTMENT POINTS
Profitable mattress fabrics and upholstery fabrics businesses, each with a leading market share
Growth in U.S. housing and greater consumer focus on home environment, leading to increase in
discretionary spending on home furnishing products
Scalable multi-country platform (on-shore, near-shore, and off-shore for fabrics and covers)
Stable, long-term supply chains in both businesses, which has been critical during pandemic-driven
unprecedented disruption
Experienced and dedicated innovation and design capabilities in both businesses
Strong balance sheet position and disciplined use of capital
Significant free cash flow generation over multiple years
Since June 2011, the company has returned approximately $72 million to shareholders in regular
quarterly and special dividends and share repurchases
6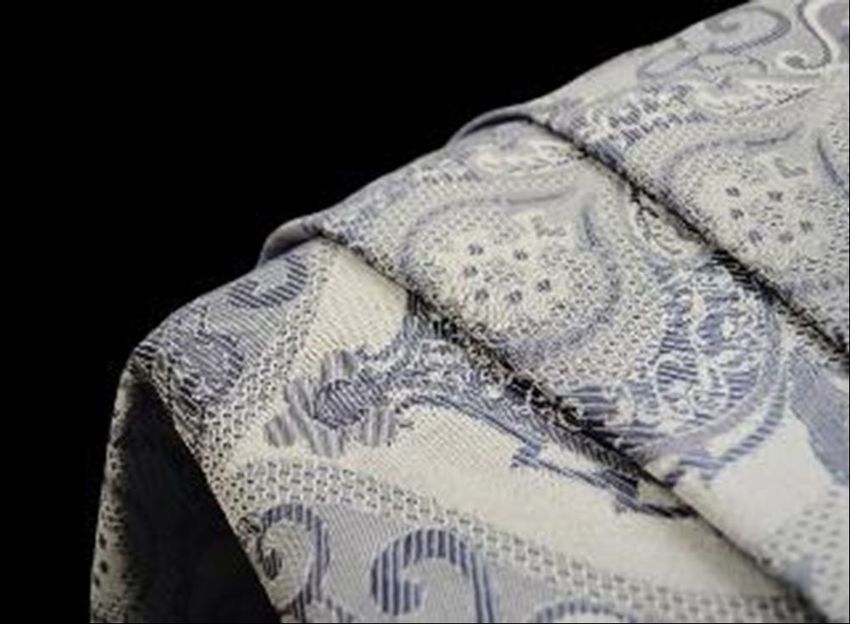
SECOND QUARTER FISCAL 2022 FINANCIAL SUMMARY
AND OUTLOOK FOR THIRD AND FOURTH QUARTERS
Net sales for the second quarter were $74.6 million, down 3.0% over the prior-year period, with mattress fabrics
sales up 2.1% and upholstery fabrics sales down 8.5% compared with the second quarter of last year.
Operating income was $1.6 million, compared with operating income of $4.5 million for the prior-year period.
Sales for both divisions were affected by our customers’ supply chain disruption for non-fabric components and
their existing fabric inventory levels; operating performance was affected by cost headwinds across both divisions.
The company’s cash position remained strong at $36.6 million, with no outstanding debt. Uses of cash for the first
six months of fiscal 2022 included:
• Increased inventory to support customers, get ahead of rising raw material costs, and prepare for the Chinese New Year holiday;
• $3.9 million for capital expenditures for machinery and equipment, IT security and infrastructure and new innovation campus;
• $1.4 million in start-up expenses for new Haiti cut and sew facility; and
• $2.7 million in regular dividends and $1.8 million in share repurchases
Increased regular quarterly dividend by 5% to 11.5 cents per share, or an annual rate of 46 cents per share.
FY2022 Outlook for Q3 and Q4: Net sales and consolidated operating income for the third quarter of fiscal 2022 are
expected to be sequentially comparable to the second quarter of fiscal 2022; expect strong improvement in net
sales and consolidated operating income for the fourth quarter of fiscal 2022, as compared sequentially to the third
quarter of fiscal 2022 and as compared to the prior-year fourth quarter.
7
CAPITAL ALLOCATION DISCIPLINE
Culture emphasizing
stewardship in capital utilization Balanced Capital
Focus on solid free cash flow Deployment
generation
Incentive compensation based
on Economic Value Added (EVA)
principles since 2011*
*For fiscal 2021, to support Organic Growth Acquisitions Shareholder Value Build Excess Cash
management’s focus on liquidity
and profitability in the current
environment, incentive
• Fund working capital • Will continue to evaluate • Annual dividend of $0.46 • If business or
compensation will be based on • Fund Cap Ex for strategic opportunities • Consider share economic outlook is
free cash flow and such that we decide
operating income.
mattress fabrics • Must meet strict criteria repurchases or special
dividends when adequate against repurchasing
• Pay down debt – Not capital intensive
cash available, no need shares and/or paying
– Low risk
for additional Cap Ex, no a special dividend,
– Don’t overpay
potential acquisition then we will build
– Cultural fit cash
opportunities, & no major
economic concerns
8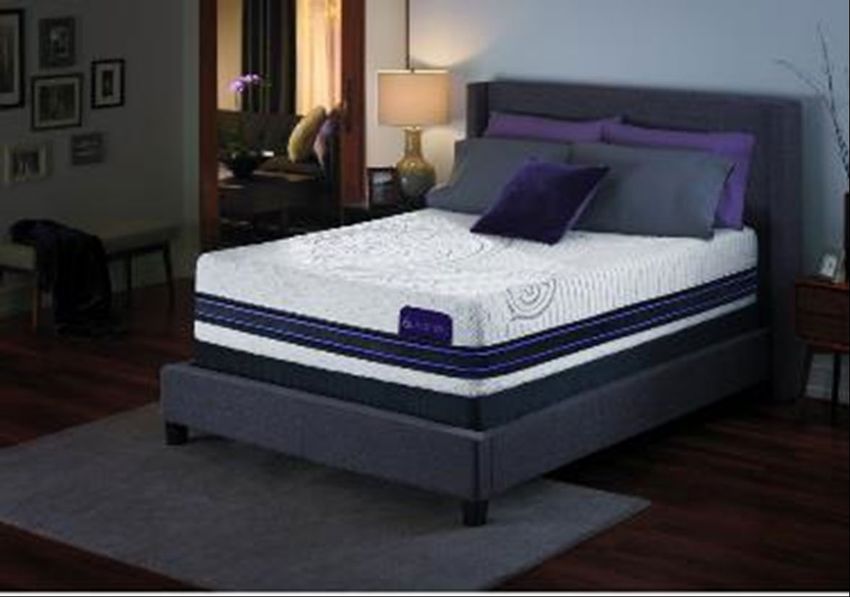
CAPITAL ALLOCATION
             FY21                   FY20                        FY19                                    FY18                      FY17
         39.7%               39.7%                                         0.4%                           19%                        5.5%
                                                            19%
                                                                                            3%                          31.0%
                     44.0%                  44.0%    19%                      49%

            14.7%                                                                                29%            50%                         63.5%
                    1.7%           14.7%   1.7%                 13%

                                           FY21     FY20          FY19              FY18     FY17
                                                     _                                            _
     Acquisitions                           $0.9                      $12.1         $4.5

     Investment in Joint Venture            $0.1    $0.2              $0.1          $0.7         $1.1                 Acquisitions
                                                                                                                      Cap Ex
     Cap Ex, including payments that
                                            $6.7    $4.6              $4.7          $11.8    $12.9                    Dividends
     are vendor financed
                                                                                                                      Share Repurchases
     Dividends                              $5.3    $5.1              $4.7          $6.8         $6.3
                                                                                                                      Debt Repayments
     Share Repurchases                       _      $1.7              $3.3           _            _                   Investment in Joint
                                                                                                                      Venture
     Debt Repayments                       $38.4     _                 _             _            _

     Total Capital Spent                   $51.4    $11.6         $24.9             $23.8    $20.3
                                                            9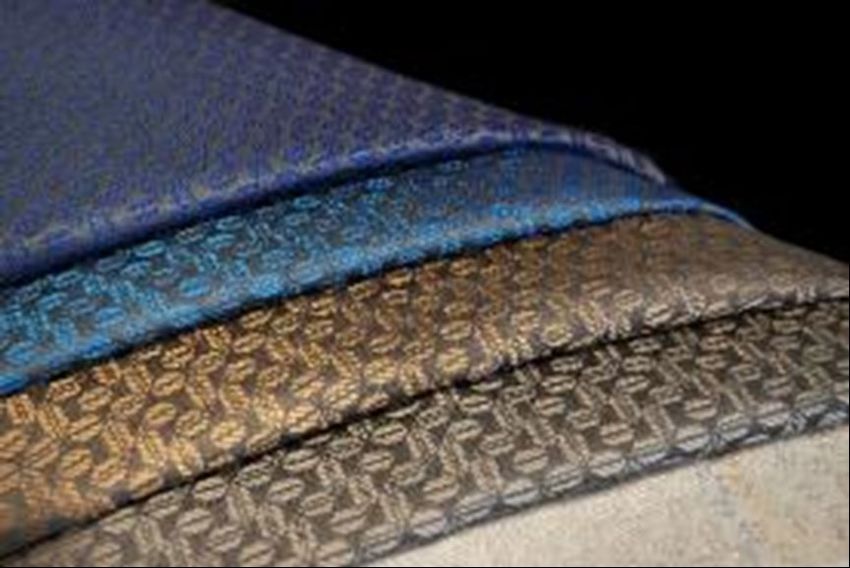
TRANSFORMATION – NET(DEBT)CASH*
     ($ in millions)
                                                                                                                     $54 $54
                                                                                                                                  $44          $47
                                                                                                  $31   $38 $42                          $39         $37
                                                                                                                                                           Through the
                                                                              $19 $21 $22                                                                  first six months
                                                                                                                                                           of fiscal 2022.
                                                                       $10

                                                                ($5)
                                            ($17)
                            ($36) ($38)($31)
                                ($45)
                        ($52)

                 ($77)

          ($110)

     ($136)

     *Net (debt) cash = Cash and investments minus total debt , which includes current maturities of long-term debt, long-term debt, and amounts
     outstanding under lines of credit.
                                                                         10
RECENT STRATEGIC INITIATIVES
Expanded capacity for cut and sewn upholstery kits with a recently completed new production facility in Haiti
(completed during third quarter of FY 2022) to support committed demand from existing customer
Expanded cut and sewn mattress covers in both Haiti and Asia, including increased capacity in Haiti through
recent acquisition of remaining 50% ownership interest in existing joint venture
Implemented multi-year plant consolidation and cost-management projects in mattress fabric operations in
United States and Canada
Invested in additional equipment to increase capacity for mattress fabric operations in North America
Price increases implemented in both businesses, effective first quarter of FY 2022, to help offset higher freight
and raw material costs and ongoing China foreign exchange rate fluctuations; additional surcharge
implemented in both businesses during second quarter of FY 2022, and additional pricing actions being taken
during third quarter of FY 2022, to help cover continued inflationary pressures
Leveraged global platform during pandemic to meet surge in demand and address global supply chain
challenges
Currently evaluating expansion of Vietnam platform to add fabric production capabilities to existing cut and
sew sourcing
Focusing on progress on ESG initiatives for FY 2022
11RECENT STRATEGIC INITIATIVES (cont’d)
New innovation campus opened in downtown High Point, North Carolina, during the second quarter of FY22.
This design-driven space brings together the company’s most innovative and talented minds to foster
collaboration across divisions and provide an everyday space to gather, meet with customers, develop new
products, and showcase the company’s technologies and innovations from fabric to sewn cover.
12PRINCIPLES UNDERLYING OUR SUCCESS
Pursue Growth
Optimize Profitability
Sound Business Model
Superior
Innovation customer service
Strong Long term
balance sheet relationships
Operating
efficiencies
13CULP, INC.
Mattress Fabrics Division
www.culphomefashions.com
14CULP, INC.
Mattress Fabrics Industry Overview
15TOTAL U.S. MATTRESS MARKET
(INCLUDING STATIONARY AND MOTION FOUNDATIONS)
Total U.S. Mattress Market for 2019 - 2020
Total Total Dollar Value (Millions) Units (Thousands)
$10,506.7 $11,231.3 Total Total
52,906 56,589
$1,202.3
$889.4 Motion Foundations**
$546.7 3,130
$446.5 Motion Foundations**
$917.9 2,589
$988.7 7,351
$1,010.5 Stationary Foundation 6,345
$801.3 Stationary Foundation
Imports (Adjusted*)
12,851 Imports (Adjusted*)
13,546
Stationary Foundations -
U.S. Produced Stationary Foundations -
9,178 U.S. Produced
6,954
Mattress Imports
$7,380.7 $7,553.9 Mattress Imports
(Adjusted*)
(Adjusted*)
Mattresses - U.S. 23,471 24,079
Mattresses - U.S.
Produced Produced
2019 2020 2019 2020
Source – International Sleep Products Association (ISPA) 2020 Mattress Industry Trends Report
*Adjusted Imports are adjusted +20% for equalization factor.
**Includes all channels for Motion Foundations
16TOP 15 U.S. BEDDING PRODUCERS
Estimated U.S. wholesale bedding
shipments in $ millions
Rank Company 2020 2019 % Change
1 Sealy $1,646 $1,436 14.6%
2 Tempur-Pedic $1,378 $1,115 23.5%
3 Simmons $1,094 $1,229 (11.0)%
4 Serta $974 $1205 (19.0)%
5 Sleep Number $669 $660 1.5%
Ashley Furniture
6 $425 $367 15.8%
Industries
7 Corsicana $320 $297 7.7%
8 Therapedic $184 $170 8.0%
9 Restonic $149 $129 15.5%
10 Sherwood $140 $155 (9.7)%
11 Symbol $125 $138 (9.4)%
12 KIngsdown $98 $103 (4.9)%
13 Englander $95 $111 (14.4)%
14 E.S. Kluft $94 $115 (17.8)%
15 King Koil $91 $91 even
Total $7,482 $7,321 2.2%
Source: Furniture Today Market Research, June 21, 2021
17MATTRESS INDUSTRY – RECENT DEMAND TRENDS
COVID-19 pandemic has generated increased consumer demand for overall comfort and
wellness at home, with more discretionary spending on home furniture products,
including mattresses
Expanding growth opportunities for bed-in-a-box mattress covers, both in
e-commerce and traditional retail
Domestic mattress industry appears to be benefitting from preliminary anti-dumping
duties imposed by U.S. Department of Commerce on mattress imports from seven
countries
Some continuing disruption in domestic mattress industry relating to low- priced
mattress imports
Industry promoting benefits of sleep for overall health
• Mattress innovation is more than comfort. Today’s consumers are
focused on health, wellness, energy from sleep, and sustainability efforts
Mattress industry has become a more decorative and innovative business
18CULP, INC.
Operational Review
19CULP HOME FASHIONS IS MARKET LEADER
Business Today Mattress Fabric Sales ($ millions)
We believe that we are the largest producer of mattress
fabrics in North America
• Facilities in the U.S., Canada, and Haiti $186.4 $190.8 $192.6
Global manufacturing and sourcing operations in the U.S., Canada,
Asia, Haiti, and Turkey $157.7
$145.1
$131.4
53% of
Strong Competitive Advantages Culp’s
Design creativity, product innovation, & marketing point-of-purchase business
Globally competitive cost manufacturer with flexible & scalable platform
FY16 FY17 FY18 FY19 FY20* FY21
Leading provider in all major categories
World class customer service & distribution
Mattress Fabric Operating Income ($ millions)
Global cut & sewn covers operation with on-shore, near-shore, and off – $29.4
$26.5 $25.9
shore capabilities
Over $100 million invested (Cap Ex and acquisitions) since 2005; expansion
since 2016 included consolidation & addition of North American distribution $11.6 $11.8
platform $4.9
Complete vertical integration within Canadian platform supporting full
complement of finished products
FY16 FY17 FY18 FY19 FY20 * FY21
Commitment to environmental responsibility with landfill-free goal met at
Stokesdale, NC facility & High Point, NC facility in 2020; ongoing * Results significantly affected by COVID-19 pandemic in fourth quarter
development of products using recycled yarn
20CULP HOME FASHIONS AT HOME
21CULP HOME FASHIONS INNOVATIVE STYLING
22MATTRESS FABRICS KEY CUSTOMERS
23CULP, INC.
Operational Review
24MARKET LEADER IN UPHOLSTERY FABRICS
Business Today Upholstery Fabric Sales* ($ in millions)
One of the largest suppliers of residential furniture upholstery 126.4 131.1 135.6 142.0
118.7 124.8
fabrics to the industry
Recovering hospitality segment
• Providing fabrics for furniture 47% of Culp’s
• Window treatments and soft goods business
Global operations
• 3 plants in China, sourcing in Vietnam and Turkey; new plant in
*
Haiti for cut & sewn upholstery kits
Operating Income* ($ in millions)
Strong Competitive Advantages
$11.9
Trusted business partner $11.3 $11.1 $11.0 $10.8
$9.9
Product innovation and design trend leader
Diverse product range, with emphasis on performance products
Globally competitive cost structure
Scalable Asian platform, with U.S. quality and service standards
Experienced management team throughout global organization
Stable and reliable global supply chain
FY16 FY17 FY18 FY19 FY20 * FY21
Exceptional quality, service, and delivery performance *Results significantly affected by COVID-19 pandemic in fourth quarter
25CUF STRATEGIC BUSINESS MODEL
Leader in product innovation and design trends,
including LiveSmart®, LiveSmart Evolve®, LiveSmart
Outdoor®, LiveSmart Ultra™, and LiveSmart Barrier
Plus™
U.S. based company with a flexible and agile global
platform capable of supplying our customers
worldwide
Mix of owned manufacturing and distribution
facilities combined with a global network of strategic
supply partners
Multiple distribution options in the U.S.,
Canada, Asia, and Haiti
Flexibility to provide both roll goods and
sewn kits
Focused on environmental and social
responsibility
26NEW HAITI CUT AND SEW FACILITY
New plant recently completed in Haiti will provide expanded capacity for production of cut and sewn
upholstery kits to support committed demand from existing customer.
27CULP UPHOLSTERY FABRICS COLOR STORIES
28READ WINDOW PRODUCTS
Acquired Read Window Products in Q4 FY18, a
source for custom window treatments and other
soft good products for hospitality industry
Expanded the product range for the hospitality
market to become a more complete room source
for fabric
A turn-key provider of window treatments offering
• Measuring
• Sourcing
• Fabrication and Installation Services
Combines Culp’s outstanding design and global
production capabilities with Read Window
Products’ expertise and strong customer
relationships
Business beginning to recover from significant
disruption to travel and leisure industries that
resulted from COVID-19 pandemic
29MULTIPLE UPHOLSTERY FABRICS INITIATIVES
Extend core by leveraging
innovation and global platform
Expand strong brand of performance
products under LiveSmart® umbrella
Focus on environmental responsibility with
LiveSmart Evolve®, our performance plus
sustainability line
Culp Express – domestic lead times with
China value
Expand Cut & Sew business Strong growth
Cross market upholstery with Mattress
momentum
Fabrics division
Expand market share in targeted
markets
Residential motion and stationary furniture
Hospitality and commercial
E-commerce market
Geographic expansion
China - domestic market
Asia Pacific region
Haiti cut and sew facility
30UPHOLSTERY FABRICS KEY CUSTOMERS
31WHY INVEST IN CULP
The Capital The
Company Allocation Platforms
Proven Performance Balanced Capital Unique Operating
Record Deployment Strengths
• Successfully navigated • Fund organic growth • Market leaders
industry changes – and capital • Unmatched capabilities
emerged a winner expenditures
• Focus on product-driven
• Strong performance with Proven performance
• Strategic acquisitions strategy
consistent sales growth record debt
• No outstanding • Exceptional design and
• Experienced management • Dividends and share innovation
team repurchases
Returned over $72 million
to shareholders since 2011
32CULP, INC.
Supplemental Information
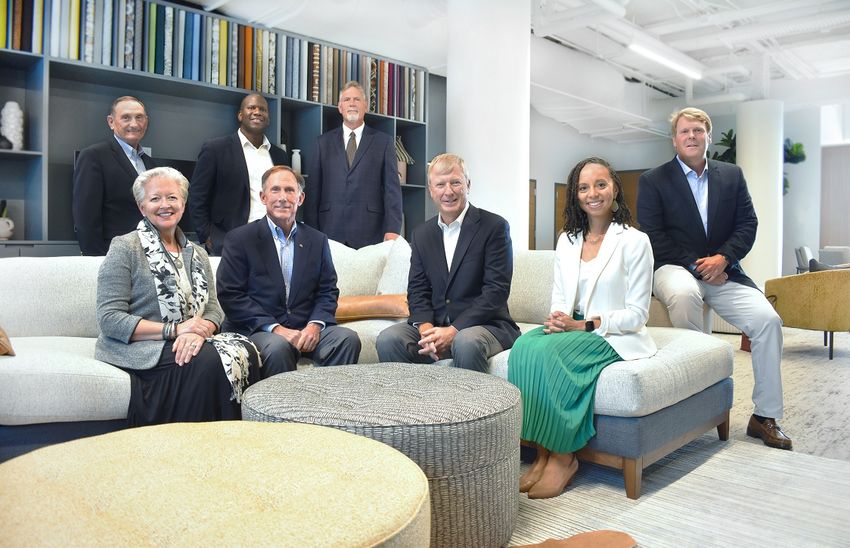
33EXECUTIVE MANAGEMENT
Standing (from L to R): Ashley Durbin and Frank Saxon
Sitting (from L to R): Ken Bowling, Boyd Chumbley, Cassandra Brown, Teresa Huffman, and Iv Culp
34EXECUTIVE MANAGEMENT
Franklin N. Saxon – Executive Chairman of the Board (38 years with Culp)
Joined Culp in 1983
Served in various senior management roles including Chief Financial Officer, President of Culp Velvets/Prints division and Chief Operating Officer
Named President and Chief Executive Officer in 2007
Named Executive Chairman in 2020
Robert G. Culp, IV – President and Chief Executive Officer (23 years with Culp)
Employed with Culp since 1998
Named President of Culp Home Fashions in 2004
Named Chief Operating Officer in 2019
Named President and Chief Executive Officer in 2020
Boyd Chumbley – President, Culp Upholstery Fabrics (37 years with Culp)
Joined Culp in 1984 as controller for an upholstery plant
Held various senior management positions in finance, operations and manufacturing
Leads upholstery fabrics division including China operation
Cassandra Brown – President, Culp Home Fashions (38 years with Culp)
• Employed with Culp since 1983, serving in various capacities
• Named Chief Financial Officer of Culp Home Fashions in 2007, Executive Vice President in 2019, and President in 2020
35EXECUTIVE MANAGEMENT (CONT’D)
Kenneth R. Bowling – Executive Vice President and Chief Financial Officer (24 years with Culp)
Joined Culp in 1997 as controller for Culp Velvets/Prints division
Served as corporate controller and Vice President, Finance
Became Chief Financial Officer in 2007
Ashley Durbin – Vice President, General Counsel, and Corporate Secretary (2 years with Culp)
Joined Culp in 2019
Previously worked with Culp as outside counsel in her role as a partner at the law firm of
Robinson, Bradshaw & Hinson, P.A., in Charlotte, North Carolina
Teresa Huffman – Senior Vice President, Human Resources (35 years with Culp)
Employed with Culp since 1986, serving in various human resources roles
Named Vice President, Human Resources in 2008
Named Senior Vice President, Human Resources in 2019
36BOARD OF DIRECTORS
Top (from L to R): Fred Jackson, Jonathan Kelly, Perry Davis
Bottom (from L to R): Sharon Decker, Frank Saxon, John Baugh, Kimberly Gatling, and Iv Culp
37BOARD OF DIRECTORS (CONT’D)
Independent Director Bios
John A. Baugh, CFA
Mr. Baugh is the vice president of investor relations for PROG Holdings, Inc., a publicly traded fintech holding company that provides transparent and competitive
payment options to consumers. Prior to joining PROG Holdings in September 2020, he was a sell-side analyst with Stifel Financial, serving as Managing Director,
Senior Equity Research from 2005 – 2020, where he covered industries including home furnishings, retail, building products, and lease-town, including coverage
of Culp, Inc. and many of its largest customers.
Director since 2021
Member of Compensation Committee; CG&N Committee; and Audit Committee (Chair)
Perry E. Davis
Mr. Davis is the retired executive vice president of the Residential and Industrial Product segments for Leggett & Platt, Incorporated, a diversified manufacturer
that designs and produces engineered products found in most home and automobiles.
Director since 2019
Member of Compensation Committee (Chair); CG&N Committee; and Audit Committee
Sharon A. Decker
Ms. Decker is president of Tryon Equestrian Partners, Carolina Operations, an investment group responsible for the development and operation of a premiere
sports complex and resort in Western North Carolina. She currently serves on the board of directors of Coca-Cola Consolidated, Inc., a nonalcoholic beverage
maker and distributor, and serves on the Board of Trustees of the University of North Carolina at Charlotte.
Director since 2019
Member of Compensation Committee; CG&N Committee (Chair); and Audit Committee
38BOARD OF DIRECTORS (CONT’D)
Independent Director Bios (cont’d)
Kimberly B. Gatling
• Ms. Gatling is a partner and the Chief Diversity and Inclusion Officer at the law firm of Fox Rothschild LLP (formerly Smith Moore Leatherwood LLP).
• Director since 2021
• Member of Compensation Committee; CG&N Committee; and Audit Committee
Fred A. Jackson
Mr. Jackson is the retired chief executive officer of American & Efird LLC, a global manufacturer of sewing, thread, embroidery thread, and technical textiles.
Director since 2016
Lead Director; Member of Compensation Committee; CG&N Committee; and Audit Committee
Jonathan L. Kelly
Mr. Kelly is the founder and chief executive officer of Asymmetric Holdings Worldwide, a Greensboro, North Carolina-based investment holding company focused
on investment strategy and capital allocation.
Director since 2021
Member of Compensation Committee; CG&N Committee; and Audit Committee
39SECOND QUARTER 2022 HIGHLIGHTS
($ in millions)
Change
GAAP Q2 FY22 Q2 FY21 $ %
Sales $74.6 $76.9 $(2.3) (3.0)%
Operating income $1.6 $4.5 $(2.9) (63.7)%
Operating income margin 2.2% 5.9% (370) bp
Pre-tax income $1.3 $3.9 $(2.6) (66.8)%
Pre-tax margin 1.7% 5.1% (340) bp
Net income $0.9 $2.4 $(1.5) (64.3)%
EPS per diluted share $0.07 $0.19 $(0.12) (64.3)%
40SECOND QUARTER YTD 2022 HIGHLIGHTS
($ in millions)
Change
GAAP FY22 YTD FY21 YTD $ %
Sales $157.6 $141.3 $16.3 11.5%
Operating income $5.0 $6.4 ($1.4) (22.5)%
Operating income margin 3.1% 4.5% (140) bp
Pre-tax income $4.5 $5.4 $(0.9) (17.9)%
Pre-tax margin 2.8% 3.8% (100) bp
Net income (loss) $3.1 ($0.3)* $3.4 NM
EPS per diluted share $0.25 ($0.03)* $0.28 NM
* Refer also to the Reconciliation of Selected Income Statement Information to Adjusted Results for the six-month period ending November 1, 2020,
at the back of this presentation.
41Q2 MATTRESS FABRICS HIGHLIGHTS
($ in millions)
Change
Q2 FY22 Q2 FY21 $ %
Sales $40.9 $40.0 $0.9 2.1%
Operating Income 3.1 4.4 $(1.3) (28.4)%
Operating Income Margin 7.7% 10.9% (320) bp
Depreciation $1.6 $1.5 $0.1 3.3%
42Q2 YTD MATTRESS FABRICS HIGHLIGHTS
($ in millions)
Change
FY22 FY21 $ %
Sales $83.9 $76.1 $7.8 10.3%
Operating Income 6.8 6.2 $0.6 8.4%
Operating Income Margin 8.0% 8.2% (20) bp
Depreciation $3.1 $3.1 ($0.1) (1.9)%
43Q2 UPHOLSTERY FABRICS HIGHLIGHTS
($ in millions)
Change
Q2 FY22 Q2 FY21 $ %
Sales $33.7 $36.8 $(3.1) (8.5)%
Operating Income $1.0 $3.3 $(2.3) (68.7)%
Operating Income Margin 3.1% 8.9% (580) bp
Depreciation $0.2 $0.2 $0.0 (9.3)%
44Q2 YTD UPHOLSTERY FABRICS HIGHLIGHTS
($ in millions)
Change
FY22 FY21 $ %
Sales $73.7 $65.2 $8.5 13.0%
Operating Income 3.3 5.4 $(2.1) (39.0)%
Operating Income Margin 4.5% 8.3% (380) bp
Depreciation $0.4 $0.4 $0.0 (1.5)%
45FREE CASH FLOW*
($ in millions)
Q2 FY22 Q2 FY21
YTD YTD
Net income 3.1 (0.3)
Depreciation, amortization, & stock-based compensation 4.4 4.2
Deferred taxes, other (0.1) 5.0
Gross cash flow 7.4 8.9
Cash flow from working capital and
(8.7) 13.8
changes in other assets/liabilities
Cash flow from operations (1.3) 22.7
Capital expenditures, including payments that are vendor
(3.9) (2.1)
financed
Investment in unconsolidated joint venture (0.0) (0.1)
Other (0.6) (0.0)
Free cash flow $(5.8) $20.5
* See reconciliation at the back of this presentation.
46NET CASH, INVESTMENTS, AND EQUITY
($ and share amounts in millions)
Q2 FY22 Q4 FY21 Q2 FY21
Cash and cash equivalents $17.0 $37.0 $45.3
Short-term investments (Available for Sale) 9.7 5.6 5.4
Short-term investments (Held-to-Maturity) 1.6 3.2 5.0
Long-term investments (Held-to-Maturity) 8.4 1.1 0.8
Total cash and investments $36.6 $46.9 $56.5
Total debt $ 0.0 $ 0.0 $0.0
Net cash and investments $36.6 $46.9 $56.5
Shareholders’ equity attributable to Culp, Inc. $128.5 $129.0 $127.3
Shares outstanding 12,210 12,313 12,303
Book value per share $10.52 $10.48 $10.34
Tangible Book value per share $10.29 $10.23 $10.08
47ADJUSTED EBITDA
Reconciliation of Net Income to Adjusted EBITDA
48OPERATING WORKING CAPITAL
($ in millions)
October 31, May 2, November
May 1,2021
2016 May 3, 2015
2021 1, 2020
Accounts receivable, net $32.3 $37.7 $33.0
Inventories, net 63.8 55.9 47.7
Accounts payable (40.5) (42.5) (38.2)
Accounts payable – capital expenditures (0.2) (0.3) (0.1)
Operating working capital $55.4 $50.8 $42.4
Percent of sales* 17.6% 16.9% 15.0%
Days sales outstanding 38.6 42.8 38.6
Inventory turns 4.2 4.8 5.6
Days accounts payable outstanding** 57.8 58.0 55.7
* Sales used in the calculation is an annualized amount derived from the year-to-date net sales.
** Accounts payable also includes accounts payable – capital expenditures.
49ABOUT NON-GAAP FINANCIAL INFORMATION
This presentation contains adjusted income statement information, which discloses adjusted net income (loss) and adjusted earnings per share, non-GAAP
performance measures that eliminate a non-cash income tax charge in connection with the recordation of a full valuation allowance against the company’s U.S. net
deferred income tax assets, as well as a non-cash income tax benefit resulting from the re-establishment of certain U.S. Federal net operating loss carryforwards
in connection with the recently enacted final regulations regarding the Global Intangible Low Taxed Income (“GILTI”) tax provisions of the Tax Cuts and Jobs Act
of 2017. The company has included this adjusted information in order to show operational performance excluding the effects of this non-cash income tax charge
and non-cash income tax benefit, which are not expected to occur on a regular basis. Details of these calculations and a reconciliation to information from our
GAAP financial statements are set forth in the back of this presentation. Management believes this presentation aids in the comparison of financial results among
comparable financial periods. We note, however, that this adjusted income statement information should not be viewed in isolation or as a substitute for net
income or earnings per share calculated in accordance with GAAP. In addition, the calculation of the company’s income taxes involves numerous estimates and
assumptions, which we have made in good faith.
This presentation contains disclosures about free cash flow, a non-GAAP liquidity measure that we define as net cash provided by (used in) operating activities,
less cash capital expenditures, plus any proceeds from sale of property, plant, and equipment, less investment in unconsolidated joint venture, plus proceeds from
life insurance policies, less premium payments on life insurance policies, less payments on vendor-financed capital expenditures, plus proceeds from the sale of
long-term investments associated with our rabbi trust, less the purchase of long-term investments associated with our rabbi trust, and plus or minus the effects of
foreign currency exchange rate changes on cash and cash equivalents, in each case to the extent any such amount is incurred during the period presented. Details
of these calculations and a reconciliation to information from our GAAP financial statements are set forth in the back of this presentation. Management believes
the disclosure of free cash flow provides useful information to investors because it measures our available cash flow for potential debt repayment, stock
repurchases, dividends, additions to cash and investments, or other corporate purposes. We note, however, that not all of the company’s free cash flow is
available for discretionary spending, as we may have mandatory debt payments and other cash requirements that must be deducted from our cash available for
future use. In operating our business, management uses free cash flow to make decisions about what commitments of cash to make for operations, such as capital
expenditures (and financing arrangements for these expenditures), purchases of inventory or supplies, SG&A expenditure levels, compensation, and other
commitments of cash, while still allowing for adequate cash to meet known future commitments for cash, such as debt repayment, and also for making decisions
about dividend payments and share repurchases.
50ABOUT NON-GAAP FINANCIAL INFORMATION (2)
This presentation contains disclosures about our Adjusted EBITDA, which is a non-GAAP performance measure that reflects net income (loss) excluding loss before
income taxes from discontinued operations, income tax expense (benefit) from continuing operations, and net interest income, as well as depreciation and
amortization expense from continuing operations, and stock-based compensation expense. This measure also excludes asset impairment charges from continuing
operations, gain on bargain purchase, restructuring and related charges and credits, as well as other non-recurring charges and credits associated with our
business. Details of these calculations and a reconciliation to information from our GAAP financial statements are set forth in this presentation. We believe
presentation of Adjusted EBITDA is useful to investors because earnings before interest income and expense, income taxes, depreciation and amortization, and
similar performance measures that exclude certain charges from earnings, are often used by investors and financial analysts in evaluating and comparing
companies in our industry. We note, however, that such measures are not defined uniformly by various companies, with differing expenses being excluded from
net income to calculate these performance measures. For this reason, Adjusted EBITDA should not be viewed in isolation by investors and should not be used as a
substitute for net income calculated in accordance with GAAP, nor should it be used for direct comparisons with similarly titled performance measures reported
by other companies. Use of Adjusted EBITDA as an analytical tool has limitations in that this measure does not reflect all expenses that are necessary to fund
and operate our business, including funds required to pay taxes, service our debt, and fund capital expenditures, among others. Management uses Adjusted
EBITDA to help it analyze the company’s earnings and operating performance, by excluding the effects of expenses that depend upon capital structure and debt
level, tax provisions, and non-cash items such as depreciation, amortization and stock-based compensation expense that do not require immediate uses of cash.
The presentation contains disclosures about return on capital for both the entire company and for individual business segments. We define return on capital as
adjusted operating income (loss) (measured on a trailing twelve-month basis and excluding certain non-recurring charges and credits) divided by average capital
employed (excluding goodwill and intangibles and obligations related to acquisitions at the divisional level only). Operating income (loss) excludes certain non-
recurring charges, and average capital employed is calculated over rolling five fiscal periods, depending on which quarter is being presented. Details of these
calculations and a reconciliation to information from our GAAP financial statements are set forth at the back of this presentation. We believe return on capital is
an accepted measure of earnings efficiency in relation to capital employed, but it is a non-GAAP performance measure that is not defined or calculated in the
same manner by all companies. This measure should not be considered in isolation or as an alternative to net income or other performance measures, but we
believe it provides useful information to investors by comparing the operating income we produce to the asset base used to generate that income. Also,
operating income on a trailing twelve-month basis does not necessarily indicate results that would be expected for the full fiscal year or for the following twelve
months. We note that, particularly for return on capital measured at the segment level, not all assets and expenses are allocated to our operating segments, and
there are assets and expenses at the corporate (unallocated) level that may provide support to a segment’s operations and yet are not included in the assets and
expenses used to calculate that segment’s return on capital. Thus, the average return on capital for the company’s segments will generally be different from the
company’s overall return on capital. Management uses return on capital to evaluate the company’s earnings efficiency and the relative performance of its
segments.
51Q2 RECONCILIATION OF SELECTED INCOME STATEMENT INFORMATION TO
ADJUSTED RESULTS
52RECONCILIATION OF FREE CASH FLOW
RECONCILIATION OF FREE CASH FLOW
FOR THE SIX MONTHS ENDED OCTOBER 31, 2021,
AND NOVEMBER 1, 2020
(UNAUDITED)
(AMOUNTS IN THOUSANDS)
53Q2 FY 22 RETURN ON CAPITAL EMPLOYED BY SEGMENT
54Q2 FY 21 RETURN ON CAPITAL EMPLOYED BY SEGMENT
55CONSOLIDATED STATEMENTS OF ADJUSTED INCOME
56You can also read


