Delivering the open opportunity society for all - THE WESTERN CAPE'S DRAFT STRATEGIC PLAN - Western Cape ...
←
→
Page content transcription
If your browser does not render page correctly, please read the page content below
delivering the open
opportunity society for all
THE WESTERN CAPE’S DRAFT STRATEGIC PLAN
Published by:
Provincial Government of the Western Cape
Department of the Premier
4 Dorp Street
Cape Town

© Copyright 2010 Provincial Government of the Western Cape
Copyrights subsist in this work. No part of this work may be reproduced in any form or by any means, without the written consent of the Provincial Government of the
Western Cape. Any unauthorised reproduction of this work will constitute a copyright infringement.

ISBN: 978-0-620-48906-5
Production:
Production management: Page Arts cc
Print: Mega Digital, Cape Town
Photographs ©: Cape Argus (page 19); Cape Argus/Jeffrey Abrahams (page 33); Craig Urquhart/Project 2010/African Media Online (pages 8,10); emiller@iafrica.com
(pages 14, 16, 17, 27, 28, 31, 46, 52, 53, 58, 68, 70, 71, 73); Lulekwa Mbadamane/Isolezwe Project (page 26); Mandla Mnyakama/Isolezwe Project (page 43);
Mbuyisi Sithole/Isolezwe Project (page 40); Nomandla Yoyo (page 57); Thobile Nompunga/Isolezwe Project (page 62); Warren Nelson/Isolezwe Project (pages 9, 41, 42,
55, 59, 65); www.redimages.co.za (page 58)

Printed on Sappi Triple Green paper, whose primary source of pulp is waste suger-cane fibre.
The paper’s wood fibre comes from sustainable forests and its bleaching process is free from elemental chlorine.
foreword

                We are charting a brand new course in the Western Cape.
                  This is the roadmap we will use as we navigate our way
                                  towards our destination, what we call the
                                         ‘open opportunity society for all’.

What do we mean by this?                                    These strategic objectives, taken together, will take us
By “open” we mean a society based on the principles         closer to that goal.
of transparency and the rule of law, where individuals      When we came into office in May 2009 we
are guaranteed rights and where independent                 discovered a tendency for departments to work
institutions protect these rights, and limit and disperse   in “silos” – with little coordination between them.
political power. This may sound theoretical but it has      This was compounded by a lack of policy coherence
profound implications for every person. It provides         across government. Very often, departments were
the essential framework for our fight against poverty       not on the “same page”.
because corruption and power abuse make poor
                                                            These objectives herald a new approach to
people poorer.
                                                            government. You will notice that they cut across the
By “opportunity” we mean a society where every              traditional line functions of government departments,
person is given the chance and the wherewithal              although some are – to adopt the jargon – more
to improve their own circumstances, whatever                “transversal” than others. Each objective is the
their circumstances may be. We recognise that the           responsibility of a designated lead minister – even if
state’s duty is to do for people what they cannot be        some elements of the plan to achieve them do not fit
expected to do for themselves.                              squarely into that minister’s assigned portfolio.
By “for all” we mean a society in which all South           Most importantly, each objective is backed by a
Africans enjoy the same rights and have access to           coherent action plan and measurable targets. They are
the opportunities they need to improve their lives,         the basis upon which our performance in government
irrespective of the circumstances of their birth.           will be assessed. If we achieve them, everybody in the
The open opportunity society for all is the society         Western Cape will feel the difference.
that the drafters of our Constitution envisaged. It
does not regard people as “permanent victims” but as
active parties in development. Our job, in partnership
with each and every citizen, with civil society, with       Helen Zille
business and with other institutions and spheres of         Premier of the Western Cape
government, is to make that vision a living reality.
foreword

Any large organisation knows that it is mandatory           • a whole-of-society approach, recognising the
to plan for success – fail to plan and you plan to fail.      increasing need to work across traditional
Its leaders need to know where they currently are,            boundaries to deliver results and the importance
where they intend to be and then plan accordingly.            of embedding a unified ethos across the public
In order to achieve this, we have set out on a process        service
since May 2009, of developing overarching strategic
                                                            • transparency and accountability, including making
objectives for the PGWC, with clear outcomes that
                                                              more government data and information available
we want to achieve in the medium term. These
                                                              to the public and a commitment to greater
objectives seek to achieve positive change in the lives
                                                              openness
of the people who reside in the Western Cape and
on how we conduct our day-to-day business.                  • fiscal responsibility, acknowledging that in tight
                                                              fiscal environments governments must ensure they
We have set ourselves stretch targets in order to
                                                              achieve value for money as well as results.
deliver against all 12 of these objectives. All of them
are important and will require effort to realize, but the   In my role as Director-General, I am committed to
one objective that I will be concentrating on is SO12       ensuring that these strategic priorities and targets
which states the PGWC will be “the best run regional        are achieved. These objectives reflect the needs and
government in the world”. This strategic objective          priorities of this government and will be used to
deals mainly with how we conduct our daily business         drive integrated and improved performance across
(governance) and interaction with our clients.              the public sector in the Western Cape. We have
                                                            put in place project management and performance
There is widespread recognition that governments
                                                            management systems for this very purpose.
are operating in more challenging strategic
environments in which policy challenges require             We now seek your input and comments on this plan
more flexible, innovative, integrated and networked         so that we can work in partnership with you to build
approaches. Characteristics of a best-run regional          the best region in the world.
government include:
• innovation, particularly the need for innovative
  policy solutions to address complex policy
  challenges
                                                            Brent Gerber
• citizen centric philosophy, enabling citizens access to   Director General
  government, improving consultation and providing a        Department of the Premier
  citizen-centred approach to service delivery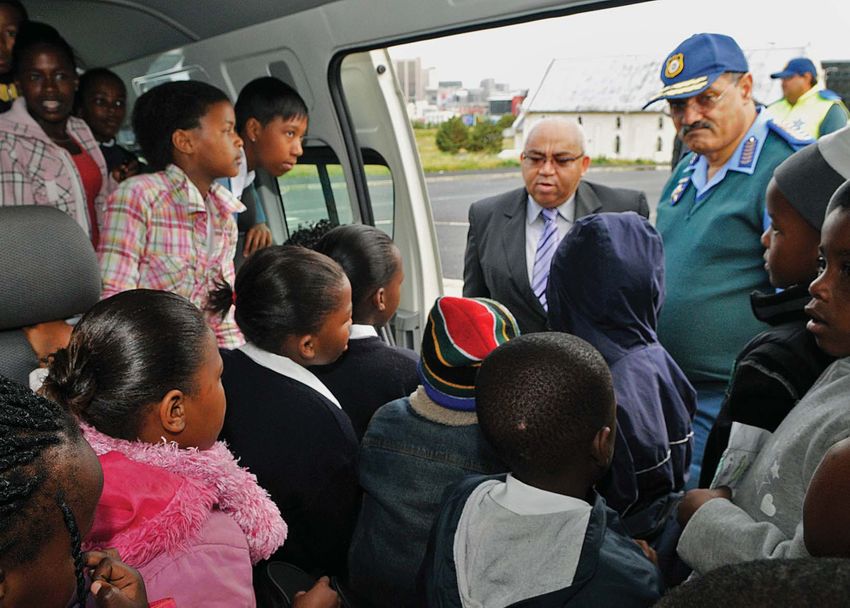
contents
vi   introduction

1    provincial overview

7    creating opportunities for growth and jobs

13   improving education outcomes

19   increasing access to safe and efficient transport

25   increasing wellness

33   increasing safety

39   developing integrated and sustainable human
     settlements

45   mainstreaming sustainability and optimising
     resource-use efficiency

51   increasing social cohesion

57   reducing poverty

61   integrating service delivery for maximum impact

67   creating opportunities for growth and development
     in rural areas

73   building the best-run regional government in
     the world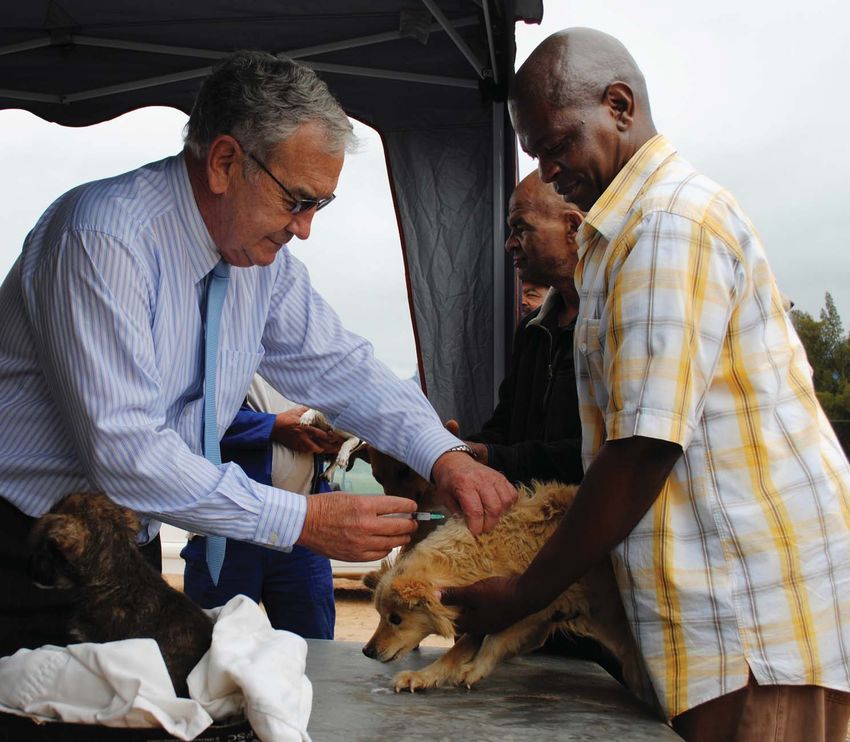
introduction

     Our purpose in government is to realise our vision of     A theme that runs through them, and which requires
     an open, opportunity society for all in the Western       further development in the years ahead, is the idea of
     Cape, so that the people of our province are able to      a whole-of-society approach to governing, because no
     live lives they value.                                    government in South Africa is able to succeed without
                                                               mobilising the ideas, energy and recourses of citizens,
     Our task is therefore to translate the political
                                                               organised civil society and the private sector. Strategic
     philosophy that underpins our vision into an
                                                               partnerships with other spheres of government and
     actionable policy agenda designed to achieve
                                                               with non-state actors are therefore central to our
     quantifiable outcomes, and then execute that agenda
                                                               approach.
     effectively, measuring progress towards our objectives
     as we go.                                                 It needs to be emphasised that the development
                                                               and execution of this strategic agenda is a work
     We have set about this task by implementing a three-
                                                               in progress. Some of our objectives require more
     step process:
                                                               detailed quantification, some of our strategic case
     1. Determining a series of quantifiable objectives        documents require further development and we have
        that, taken together, give expression to our vision    yet to begin using the newly approved transversal
        of an open opportunity society for all                 management system to drive the process forward.
     2. Determining the policy direction and key               Our purpose in publishing this document is therefore
        interventions required to achieve our objectives       to generate debate and elicit feedback in an effort
     3. Designing a management model that allows us to         to ensure that our approach is informed by the best
        execute our policy agenda effectively and measure      ideas available. It is my hope that we will be in a
        progress                                               position to publish a second edition a year from now.
                                                               We should then also be able to report on progress to
     The contents of Building an Open Opportunity              date, and critically review our targets as a result.
     Society for All in the Western Cape are a summary
     of the 11 “strategic case” documents that determine
     the policy direction and key interventions required to
     achieve our objectives. The 12th objective, “Building
                                                               Ryan Coetzee
     the best-run regional government in the world”, seeks
                                                               Strategic Adviser to the Premier
     to ensure that the organisation and its people are able
     effectively to deliver on the other objectives.
     Each of our policies reflects our core values and
     is informed by an evidence-based analysis of the
     circumstances of the Western Cape. They take into
     account our powers and functions as a provincial
     government as well as the resources at our disposal.

vi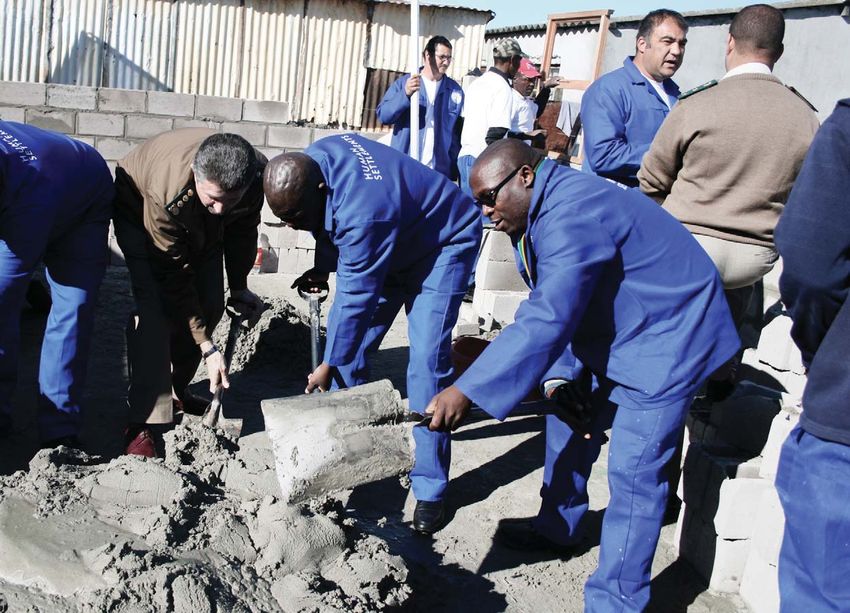
provincial overview

                      1
provincial overview

                                                                                                                provincial overview

                                                  This chapter focuses on the most pressing socio–           Figure 1: Education enrolment for 2009
                                                  economic problems facing the Western Cape,
                                                                                                             % OF POPULATION ENROLLED
                                                  which are also some of the issues that the Provincial
                                                  Strategic Plan is attempting to resolve and/or             100%
                                                  improve upon. These issues include: economic               90%
                                                  growth and job creation; education; public transport;      80%
                                                  health; crime and personal security; social cohesion;      70%
                                                  and poverty.                                               60%
                                                                                                             50%

                                                  Economic growth and job creation                           40%
                                                                                                             30%
                                                  In order to create jobs for the people of the Western      20%                        % of population
                                                  Cape, it is important that sustainable economic            10%
                                                  growth is secured. Between 2001 and 2006, the total        0%
                                                  GDPR for the Western Cape grew from R144 billion                     6 7 8 9 10 11 12 13 14 15 16 17 18 19 20 21 22 23 24 25
                                                  to R253 billion with the dominating industries being                                                                      AGE

                                                  manufacturing and finance and business.
                                                                                                             It is the ideal of the PGWC that all children should
                                                  However, the Western Cape is struggling with a high        start school at the right age and move on to the
                                                  unemployment rate. According to Statistics South           next grades at the ages that are appropriate for
                                                  Africa (Stats SA), during the second quarter of 2010,      those grades. Figure 1 above shows the percentage
                                                  the unemployment rate for the Western Cape was             of children who are at the right age in the right
                                                  estimated at 23.62%; that is, around 579 683 people        grade. The figure also shows that only 73% of
                                                  were unemployed. Of the total unemployed, the              children aged seven years are registered at primary
                                                  majority are Coloured (272 852) and African                schools. This means that 27% of children in this
                                                  (219 777) people.                                          province were either starting school late or not
                                                                                                             attending school at all. Starting school late often
                                                                                                             contributes to high dropout rates and this is
                                                  Education                                                  especially true in the rural areas.

                                                  According to the Community Survey 2007 by Stats            Throughput rates
                                                  SA, 24% of people in the Western Cape aged 20
DELIVERING THE OPEN OPPORTUNITY SOCIETY FOR ALL

                                                  years and older have less than nine years of schooling.    Research has shown that learners who started
                                                  Also, 40% of the labour force in the province earns        Grade 1 in 1998 had a 44.01% chance of reaching
                                                  no income at all. There is thus a clear correlation        Grade 12 without failing any grade, a 31.70% chance
                                                  between the number of years that people attend             of passing their matric exam and a 14% chance
                                                  school and the level of income they earn. It is for        of passing their matric exam with matriculation
                                                                                                             exemption, thus allowing them to attend university.
                                                  this reason that illiterate people, especially, struggle
                                                  to earn a decent income, and this makes it difficult for
                                                  them to escape poverty. Those caught in this cycle         Dropout
                                                  will most likely remain poor throughout their lives,       In 2008, 62 524 learners from Western Cape public
                                                  and, in many cases, this will continue through future      ordinary schools between Grades 8 and 12 dropped
                                                  generations. And in almost all these cases, it is the      out. School dropout rates show a dramatic increase
                                                  children who are the biggest victims of this cross-        once learners reach the age of 15, when schooling is
                                                  generational poverty.                                      no longer compulsory.

2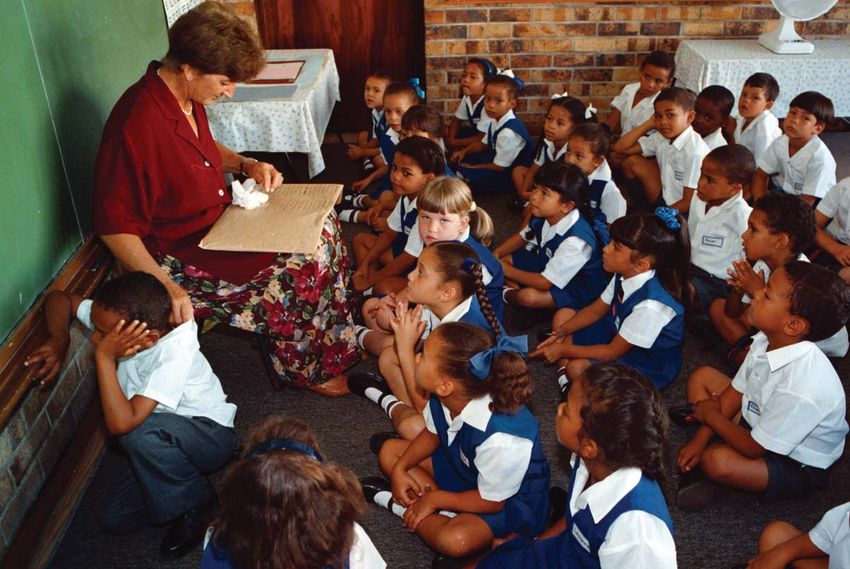
Grades 3 and 6 numeracy and literacy rates                       Access to public transport
Although more people have access to education,
evidence suggests that the quality of education is               According to the 2003 National Transport Survey,
still not up to standard. In this regard, the numeracy           of those who used public transport, 87.4% said that
and literacy rates for Grades 3 and 6 have been                  the maximum walking time to the nearest transport
identified as key indicators in measuring the quality            facility was between one and 15 minutes. Just more
of education.                                                    than 56.3% of respondents said that they walk to their
                                                                 education institution.
Figure 2 shows that less than 20% of Grade 6
learners passed the numeracy competency test
and there is also a downward trend in the passing                Health
rate for Grade 6 learners taking the numeracy
assessment test. The figure below also highlights the            The Western Cape population suffers from a
slow progress made in correcting the competencies                rapidly growing burden of disease. More and more
of learners in Grades 3 and 6.                                   people in the province are getting HIV/AIDS and
                                                                 tuberculosis (TB).
Figure 2: Grades 3 and 6
numeracy and literacy rates                                      Table 1: The burden of disease in the Western
                                                                 Cape (2007–2008)
PASS %

                                                                        BOD               2007              2008
60%
                                                                 VCT, HIV test +         53 439            61 724
50%
                                                                 U5 testing +               551               638
40%                                                              New TB cases            25 232            24 564

30%

20%                                                              The composition of the Western Cape population
                                                                 is changing because of the higher number of people
10%
                                                                 with TB and HIV/AIDS. The result is that more and
0%                                                               more adults are dying at an earlier age. This leads to
          2002          2004         2006         2008
                                                          YEAR
                                                                 a smaller number of people that children in especially
                                                                 the rural and informal communities can depend
                                                                 on to care and provide for them. The burden of
  Numeracy Gr3   Numeracy Gr6   Literacy Gr3   Literacy Gr6
                                                                 disease affects the poor more because they are the
                                                                 hardest hit by the suffering, illness and death caused
                                                                 by disease. Also, the burden of disease often forces
Matriculants                                                     poor families into even more poverty because they
                                                                 normally do not have the money to care for the sick.
The matric pass rate has dropped significantly over              They also lose the income of the family member who
the last five years. Between 2005 and 2009, the                  is sick or dies.
matric pass rate for the province dropped from
84.45% to 75.8%. As for Maths Literacy, the pass rate
has decreased from 91% in 2008 to 89% in 2009.                   Crime and personal security
The pass rate for Physical Science also decreased
significantly from 71.2% in 2008 to 52.9% in 2009.               Crime is of increasing concern to the residents of
                                                                 the Western Cape and its government. The high rate
Learner pregnancies                                              of crime is recognised as one of the reasons why
                                                                 investors do not want to invest in a province, and this
About 1 163 learners fell pregnant in 2009. The                  has a negative impact on the poor. Unfortunately, crime
majority, that is 89.08% or 1036 of these pregnant               also offers poor people an opportunity to get material
learners were between Grades 9 and 12. The data for              goods through illegal ways. For poorer people the
2009 also shows that learners get involved in sexual             opportunities or money that that they can get through
activity from as early as Grade 4.                               crime far outweigh the risk of criminal prosecution.

                                                                                                                           3
provincial overview

                                                  Table 2: Western cape crime statistics (2008–2010)                The Western Cape is experiencing a steady increase
                                                                                                                    in the number of teenagers falling pregnant. The
                                                             Crime               2008/2009        2009/2010         effects of teen pregnancies are of concern given
                                                   Murder                          2 346             2 274          the fact that having a child as a teenager has
                                                   Sexual offences                 8 772             9 678          serious educational, social, economic and even
                                                                                                                    psychological consequences for teenage mothers.
                                                   Attempted murder                1 766             1 707
                                                                                                                    Teenage pregnancy is directly linked to the social and
                                                   Driving (alcohol/drugs)        12 741           15 644           economic backgrounds of teenage mothers. This
                                                   Drug crimes                    52 781           60 409           means that teenagers coming from a disadvantaged
                                                   Residential burglary           42 920           43 300           background have a greater chance of falling pregnant
                                                                                                                    at a young age as opposed to teenagers coming from
                                                                                                                    a wealthier background.
                                                  Table 2 illustrates that between 2008 and 2010, there
                                                  were slightly fewer murders and attempted murders.                Terminations
                                                  However, the number of cases of people driving
                                                                                                                    According to the Department of Health, in 2008
                                                  while under the influence, sexual offences and drug-
                                                                                                                    around 14 782 mothers decided to end their
                                                  related crimes continued to increase between 2008
                                                                                                                    pregnancies at public health care institutions in the
                                                  and 2010.
                                                                                                                    Western Cape. Of these mothers, 16% or 2349 were
                                                                                                                    aged between 10 and 18 years.
                                                  Social cohesion                                                   Figure 4 demonstrates the ever-increasing number of
                                                                                                                    pregnancy terminations
                                                  Social cohesion refers to “the extent to which a
                                                  society is coherent, united and functional, providing an
                                                                                                                    Figure 4: Pregnancy terminations
                                                  environment within which its citizens can flourish”.
                                                                                                                    20000
                                                  Causes of social cohesion breakdown
                                                  Poorer communities in the Western Cape are                        15000                 2004            2005             2006            2007            2008
                                                  continuously being put under strain because of the
                                                  negative impacts of crime, gender inequality, teenage             10000
                                                  pregnancy and substance abuse. These threats make
                                                  it difficult for the individual and/or household to                 5000

                                                  succeed and they also have a negative effect on
                                                                                                                           0
                                                  how communities work together to reach common                                    10-14         15-18          19-24         25-29         30-34           >34           Total
                                                  goals. By disrupting the social fabric through which
                                                  communities are linked with their neighbours, these
                                                  factors inevitably reduce social interaction and restrict
                                                  community activities.                                             Poverty
                                                                                                                    Figure 5: Poverty rates and shares by age cohorts
                                                  Figure 3: Teenage pregnancy                                       (15 to 65 years)
                                                                                                                    % OF MONTHLY INCOME
DELIVERING THE OPEN OPPORTUNITY SOCIETY FOR ALL

                                                  10000
                                                   9000                                                             120%                    MI>R1600                     R401
The labour force population (defined as those Environment
between the ages of 15 and 65 years) of the Western
Cape is composed of about 3.6 million people. This
breaks down into 583 820 youths (those from 15 Table 3: Carbon footprint for Western Cape energy
to 20 years of age), 2 854 088 adults (those aged use by fuel (2004)
between 21 and 59 years) and 178 023 elderly
persons (60 to 65 years). Of the three groups, it Sector Thousand tons % of total
is the youths who are most likely to be ultra poor. of CO2/year
Adults experience much lower poverty and ultra poor Industry 15 956 47.3%
rates, even though more than half of all adults in the Mining and quarrying 751 2.2%
Western Cape are poor. A smaller percentage of
Transport 7 529 22.3%
elderly people experience ultra poor rates compared
to the other age groups because they normally Agriculture 2 045 6.1%
receive a social grant like a monthly state pension. Residential 5 224 15.5%
Commerce and public 2 259 6.7%
service
Figure 6: Poverty rates by levels
of education for adults Total 33 764 100%
Source: 2004 Western Cape Energy profile
60%
Ultra poor
50% Most of the carbon dioxide released from energy
Poor use within the province comes from electricity
40% Least poor production, followed by petrol and diesel use.
Industry is the largest user of electricity in the
30% province, followed by transport, the residential sector
and then commerce and government.
20%
10% Table 4: Emissions within the Western Cape (2004)
0% District municipality CO NO2 SO2
No
schooling
Some
primary
Grade 7
Some
secondary
Grade 12
Cert/Dip
Grade 11
Cert/Dip
Grade 12
Degrees
Cape Winelands 834 892 4 860
Central Karoo 0 0 2
LEVEL OF EDUCATION
Eden 2 815 225 775
Source: Statistics South Africa 2007 Community Survey (own calculations)
Overberg 20 25 132
West Coast 114 184 955
Total 3 784 1 327 8 052
It is clear from the above figure that a relationship Source: Monitoring Campaigns and Emission Inventories – The Western Cape Cooperative Governance Experience
exists between poverty and the levels of education of
individuals aged between 21 and 60 years. More than
40% of adults with some secondary education are The above table shows the types of chemical emissions
classified as being ultra poor, while 28% are classified emitted into the ozone. According to the table, Eden
as being poor. These numbers differ significantly as district municipality emits 74% of total emissions of
levels of education rise. This means that the more carbon-dioxide (CO2) in the Western Cape.
education people have, the less poor they are. The
figure also demonstrates that fewer people are Water quality
classified as ultra poor if they finish matric.
Marine ecosystems are affected by turbidity,
suspended solids, temperature, pH, salinity,
concentrations of dissolved ions, nutrients, oxygen,
biocides and trace metals. Changes due to pollution
and hydrological factors can have damaging effects on
water organisms.
5provincial overview
In the 2007 Western Cape State of Biodiversity From the 11 sites surveyed on rivers in the Goukou/
report, water quality results from 114 surveyed sites Duiwenhoks catchments, 18% were natural, 45%
were assessed. Of these sites, 41 sites were surveyed were good, 9% were fair and 28% were in a poor
in rivers in the Greater Cape Town area, of which condition. Of the 24 sites surveyed in rivers of
17% of sites were natural, 24% were good, 37% were the Berg River catchment, 29% were natural, 17%
fair and 22% were in a poor condition. Approximately were good, 37% were fair and 17% were in a poor
38 sites were surveyed in the Olifants/Doorn condition. According to the water quality results, a
catchment, of which 13% were natural, 52% were high proportion of sites with poor water quality were
good, 33% were fair and 2% were in a poor condition. in the Greater Cape Town area.
DELIVERING THE OPEN OPPORTUNITY SOCIETY FOR ALL
6creating opportunities for
growth and jobs
7creating opportunities for growth and jobs
creating opportunities
for growth and jobs
1. Strategic objective
The Provincial Government of the Western Cape (PGWC) believes that:
• Economic growth is the foundation of all successful development.
• Growth is driven primarily by private sector business operating in a
market environment.
• The role of the state is (a) to create and maintain an enabling
environment for business and (b) to provide demand-led, private-
sector-driven support for growth sectors, industries and businesses.
2. Economic environment
The twin pillars of our approach to economic development are therefore
(a) the creation and maintenance of an enabling environment for
business, and (b) demand-led, private-sector-driven government support
for growth sectors, industries and businesses.
With 10% of the national population and a GDP share of 14%, the
Western Cape is one of South Africa’s most developed provinces. The
provincial economy has a number of distinctive characteristics that point
to its comparative advantages:
• A significantly higher degree of knowledge intensity (reflected
in adult literacy rates, for example) and access to computers,
telecommunications hardware and internet capabilities far above the
national norm
• A significantly better-educated population than any other province
in South Africa: 21% of the population are matriculants compared to
14% in Gauteng and KwaZulu-Natal
• A well-developed infrastructure and a very strong concentration of
knowledge institutions, which offset the relative absence of mineral
resources in the province
8• A significantly larger and faster-growing services 3. Plan to achieve outcomes
sector than the country as a whole, concentrated
especially in business and financial sservices, To ensure we create an investor- and growth-friendly
with other strong growth sectors including environment, we will focus on the following:
information and communication technologies
(ICT) and oil and gas
• A thriving international tourism industry with 3.1 The development of a provincial vision
strong links to the creative and cultural sectors and brand
• A well-developed export-oriented agricultural Successful regional economies have a defined identity
sector, especially strong in viticulture, deciduous that attracts specific types of investment and skills. To
fruit, table grapes, citrus, grains and ostriches this end, the Premier will lead a Future Cape Initiative
to develop an economic brand for the Cape. We will
• Few large companies and a much higher
ensure that all role-players are invited to participate
proportion of established small and medium so that what is produced is owned by all the people
enterprises of the Western Cape.
• An excellent international location as a region with
two ports located between major international
trade routes 3.2 The development of a corruption-free,
efficient public sector
The PGWC’s growth strategy will be based on the
province’s comparative advantages. This involves a Growth is only possible if the private and public
combination of knowledge intensity, cultural activity, sector trust that the government is clean and
multi-dimensional tourism, lifestyle attractiveness efficient. We will promote transparency and cost-
and location. effectiveness in procurement processes; increase our
The province’s comparative advantages are not forensic investigation capacity; introduce legislation
unadulterated blessings: growth, being based on the that outlaws our employees from doing business
with the state; and act against any official or politician
province’s superior intellectual capital, will be (and has
who breaks the law.
been) less labour-intensive than the national average,
which means that the regional economy has to grow We will ensure that citizens of this province have
proportionally faster than the rest of the country to access to basic services, safe public transport, an
create the same number of new jobs. effective health service, access to e-governance, and
9creating opportunities for growth and jobs
safe locations in which to live and work. We will do 3.4 Infrastructure and asset development
this in a manner that takes our environment into strategy
account. Collectively, the other provincial strategic
objectives will create an environment that makes In order to make investment possible, we will:
investment possible.
• Develop an integrated infrastructure plan for the
Western Cape
3.3 A regulatory environment that is efficient • Drive to completion several existing infrastructure
projects, such as the Cape Town Regeneration
Red tape threatens investment and growth. Project and the Development of the Port Precinct
Through careful research into the existing regulatory (see below)
environment and consequent reforms, we will
reduce red tape that deters businesses from • Sweat underperforming state-owned assets in
investing in our province. order to create investment and employment
opportunities, the Cape Town Regeneration
Project being a prime example
The Cape Town Regeneration Project
In order to unlock and create wealth, the PGWC has identified that the regeneration of the Cape Town CBD is of
the utmost importance – given the location of valuable property assets in the city centre.
Through the Cape Town Regeneration Project, existing underutilised properties of the PGWC, integrated and
managed as a single asset, and combined with those of the City of Cape Town, Transnet, the national Department
of Public Works and Intersite, will be made available for development. The mechanism to make such land available
will be characterised by transparent, arms-length adjudication processes undertaken by engaging independent third
parties in the decision-making process.
The principles and practices of the regeneration project will also be modified where necessary and implemented in
other parts of the city and province.
DELIVERING THE OPEN OPPORTUNITY SOCIETY FOR ALL
10To achieve the second pillar – demand-led, private-
The development of the sector-driven government support for growth
port precinct sectors, industries and businesses – we will:
1) Establish a Western Cape Economic
Development Agency
The development of the port precinct in Cape
International precedent shows that economic
Town, and the realisation of economic multipliers
development strategy is best implemented by
that this will bring, is currently being held back an agency and people who have real business
by a lack of influence and input on the part of expertise. It is also essential to ensure value
the key local players. This is hampering especially for money in our spending on economic
the future development of the oil and gas sector, development and proper integration between
the boat-building sector, improvements to the the various role-players in executing economic
port’s logistical capacities and performance, development strategy.
including back-of-port transport matters, and For this reason we will establish a Western Cape
other local initiatives. Economic Development Agency. It is envisaged
that the Agency will have a mandate to manage
The PGWC and the City of Cape Town will, the following:
in conjunction with a coalition of interested
• Coordination of destination marketing for
local players, formulate a master plan for the tourism and major events
development of the port precinct to provide a
• Investment and trade promotion
basis for engagement with the national players
• Enterprise development
who are the critical to development in this area.
• Local economic development
• Skills development, as a participant in the
Provincial Skills Development Forum
• Growth sector support informed by Micro-
Economic Development Strategy (MEDS)
research and including support for the tourism
and agriculture sectors
• Asset development
11creating opportunities for growth and jobs
The PGWC will therefore collapse the We will ensure that the establishment of the
existing public entities and relevant sector Agency is done as quickly as possible and that all
development agencies into the Western Cape the role-players are fully consulted and involved.
Economic Development Agency. A task team Success will require teamwork and a shared
will be appointed by the Minister of Economic commitment to the future of the Western Cape
Development and Tourism to do the following: economy. We are confident of success.
• Investigate best practice examples of such
agencies
• Recommend the mandate of the Agency
• Recommend the most appropriate legal vehicle
for the Agency
• Recommend an institutional design for the
Agency
DELIVERING THE OPEN OPPORTUNITY SOCIETY FOR ALL
12improving education
outcomes
13improving education outcomes
improving education
outcomes
1. Strategic objective
The PGWC will improve the life chances of all its children through the
provision of quality education. To this end all children will remain in
school for as long as possible and achieve optimal results.
In particular, the focus from 2010 to 2019 will be on improving the reading,
writing and calculating abilities of learners. The period 2010–2014 will lay
the foundations for these improvements. In the period 2014–2019 the
province’s children will reap the fruits of a system that has been designed
and managed to deliver on the targets set.
The main indicators for measuring the progress made by the Western
Cape Education Department (WCED) in providing quality education are:
1. Improving literacy and numeracy in Grades 1–6
2. Increasing the numbers passing in Grade 12 including an increase in
numbers passing with matric exemption and mathematics and science
142. Problem statement • Too many of our learners move through the
system, despite being unable to master literacy
The majority of children in the Western Cape are and numeracy at the appropriate grade. Unable to
not achieving their academic potential. This is largely cope at higher levels, many of these learners drop
due to: out of school or fail to pass Grade 12.
1. Inadequate time and attention paid to reading, • Of the 94 784 learners who enrolled in public
writing and counting in the first three grades schools in the Western Cape in 1997, only
of school 43 470 reached Grade 12. Of those learners
who remained in school, only 33% qualified for a
2. Poor levels of accountability for performance matric exemption.
from education officials and educators
• The number of underperforming schools (schools
3. Weak school management and leadership with less than a 60% matric pass rate) in the
4. The slow rate of response and support from the Western Cape has consistently increased, from 36
education department in 2006 to 74 at the end of 2008.
5. The low morale of teachers
6. Inadequate quality textbooks and other learning
materials
7. Social ills such as poverty and crime
8. The declining quality in school infrastructure
9. A legacy of underinvestment in a number of areas
in the Western Cape
10. The pressure posed by inward migration to the
Western Cape
The combination of these factors has led to poor
learner performance:
• The matric pass rate is dropping. In 2004 we
achieved an 85% pass rate, but this continuously
dropped over the next five years to 78.6% in 2008.
• Our literacy and numeracy results as measured by
Grades 3 and 6 are also particularly disturbing.
15improving education outcomes
3. Plan to achieve outcomes the organisational culture and improving the
Department’s business processes and systems. The
3.1 Literacy and numeracy head office and district offices of the WCED will be
structured, designed and equipped to provide a rapid
We will improve literacy and numeracy outcomes response service and support to schools and teachers.
by directing maximum resources (both human and
financial) to the first three years of schooling. This will
be coupled with universal and compulsory testing of 3.4 Teacher morale
learners from Grades 1 to 6 from 2010. Benchmarks
We will reduce the administrative workload
and targets will be set at each school.
of teachers to provide more time for teaching.
Teachers will be provided with texts on time.
3.2 Accountability Teachers will also be provided with opportunities
for ongoing professional development and training.
All officials and principals will sign performance Officials will provide administrative and academic
contracts with targets for improving learner support to teachers and schools on demand.
performance. These contracts will be monitored on a
quarterly basis. There will also be far greater attention
given to the management of schools at the district 3.5 Quality texts and materials
level, with officials and teachers held to account for
The WCED will, over the next three years, ensure
their role in improving individual school performance.
that every classroom is text-rich with reading books
for each Grade 1–6 classroom and for each subject
3.3 Faster response times and support in Grades 4–12. Incentives for textbook recovery
and use will be provided. We will also make greater
We will improve the responsiveness and efficiency use of technology to deliver a quality curriculum into
of the WCED through a focus on changing the classroom.
DELIVERING THE OPEN OPPORTUNITY SOCIETY FOR ALL
163.6 Poverty and crime 3.9 Migration and new schools
Poverty and crime impact severely on learning. The Western Cape government will use the best
The WCED, in collaboration with other government available research to plan for in-migration to the
departments and civil society organisations, will provide Western Cape and use research trends to ensure
food and other poverty-alleviation measures to address that schools and teachers are available to provide
the needs of poor learners. We will strive to make quality education to the children who enter the
schools safer through physical safety measures, greater province. Innovative means will be sought to address
cooperation with the SAPS and Metro Police (using current backlogs in infrastructure provision.
schemes such as rent-a-cop) and actively promoting
community involvement in protecting schools.
In addition, the WCED, with other government 3.10 School management and leadership
departments and the SAPS, will conduct random
inspections and tests at schools for drugs and weapons. The WCED will provide targeted management
training and in-school support to all members of
school management and school governing bodies.
3.7 School maintenance
Every decision taken in relation to education in
The WCED will develop a list of priorities for the Western Cape will be informed by the need
infrastructure maintenance and will adopt the most to attain the learner achievement outcomes stated
cost-effective and efficient means of maintaining below. A diversified curriculum will be offered after
schools, including public-private partnerships. primary school to ensure that learners are provided
with appropriate opportunities to develop their
skills and knowledge.
3.8 Redress
There is no quick fix when it comes to improving the
The WCED will direct its human and financial quality of education provided by the Western Cape.
resources to those districts and schools that have It is only through a sustained, focused and systematic
historically experienced underinvestment. approach that we will achieve the stated targets.
17improving education outcomes
4. Targets
POLICY PRIORITY PERFORMANCE AREA CURRENT TARGETS
PERFOR-
MANCE 2010 2012 2014 2019
LEVELS
Improved academic performance Literacy Grade 3 53.5% 55% 65% 75% 90%
in literacy and numeracy
Numeracy Grade 3 35% 40% 50% 60% 80%
in Grades 3, 6 & 9 by testing the
full cohort Literacy Grade 6 44% 45% 55% 65% 90%
Numeracy Grade 6 14% 15% 25% 50% 80%
Literacy Grade 9 40% 45% 55% 65% 90%
Numeracy Grade 9 35% 40% 45% 55% 80%
Improved National Senior Matric pass rate 75.7% 80% 82% 84% 87%
Certificate Matric pass numbers 34 577 36 000 39 000 43 000 50 000
University admission rates 33.04% 34% 35% 37% 45%
Exemption numbers 14 522 15 000 16 500 18 500 25 000
Maths numbers 13 003 13 500 15 000 17 000 22 000
Physical Science passes 9 690 10 000 11 500 13 500 16 000
Reduction in number of No of schools withincreasing access to
safe and efficient
transport
19increasing access to safe and efficient transport
increasing access
to safe and efficient transport
1. Strategic objective
Transportation, both public and private, shapes and connects the built
environment. Transportation must be functionally integrated with the
built environment and it must be able to move people and goods safely.
The PGWC has identified increasing access to safe and efficient
integrated transport as a strategic priority in order to achieve the goal of
creating an opportunity society for all. Infrastructure for transportation
remains the largest single investment in the Western Cape.
For the purposes of this strategic objective, all modes are considered, i.e.
road, rail, aviation and maritime in respect of the movement of goods
and people, as well as non-motorised transport.
Not all elements of the transport system are within the direct control
of the provincial government. In fact, few are directly controlled by the
Province, and thus the local and national spheres have a very large role to
play in assisting the PGWC to achieve its vision.
The focus in the period from 2010 to 2014 will be on improving public
transport services in both the urban and rural areas of the Western
Cape; promoting the use of appropriate modes for the movement of
freight; increasing investment in transport infrastructure and reducing
maintenance backlogs; improving transport safety; and developing the
required institutional capacity in the necessary sphere of government
to deliver on the various transport mandates, while creating and
strengthening partnerships with all crucial stakeholders and role-players.
202. Problem statement Current transport inefficiencies have significant
negative impacts on the economy, society and the
Important economic and social trends have shaped environment:
the face of transportation, namely: • Congestion, particularly through increasing private
• A significant shift from rail freight to road freight, car usage in Cape Town, causes a loss of millions
due to a decline in rail service efficiency and of rands to the provincial economy.
challenges with intermodal changes associated • Congestion contributes over 50% of the
with rail atmospheric emissions in cities – the highest
• A growth in exports over the last decade, due to source of pollution.
globalisation and political transformation in South • High accident rates involving pedestrians and
Africa, which have opened new markets high numbers of fatalities increase the burden on
• An increase from 5% to 20% in manufacturing hospitals and on medical and social services and
exports decrease economic productivity.
• Government’s policy aimed at ensuring economic • The high cost of transport disempowers
opportunity for all citizens, coupled with its policy marginalised communities (both urban and rural)
to provide basic personal mobility for all, which due to travelling distances and the lack of an
has increased the demand for public transport. adequate and integrated transport system.
• Safety and security problems deter people from
using public and private transport.
Motorised transport model split for the • Limited access for persons with special needs
City of Cape Town, 2005 to transport and the associated infrastructure
7%
further isolates already vulnerable individuals in
25% communities.
• Increasing backlogs in maintenance of transport
infrastructure hamper economic activity.
45% 4%
• The lack of formalised institutional arrangements to
assist in coordination and delivery on an integrated
19% transport mandate includes a fragmentation of
functions relating to transport safety.
Public rail Public bus Public minibus taxi
Private Other
21increasing access to safe and efficient transport
3. Plan to achieve outcomes 3.2 Focusing on provincial priority areas
• Rural transport. The PGWC will work with district
3.1 Alignment to national interventions and local municipalities to implement contracted
• Roads Infrastructure Strategic Framework of public transport which, where appropriate, will link
South Africa (RISFSA) – reclassification of the road with freight transport in order to increase efficiencies.
network. The PGWC will ensure that roads in • Rural passenger rail. The PGWC will explore
the Western Cape are appropriately classified in investment in rural rail services in cooperation
order to ensure that the network is designed and with the Passenger Rail Agency of South Africa in
maintained in an integrated manner. order to increase communities’ options for access
• National and regional rail plan. The PGWC will and mobility.
support the implementation of the national and • Promoting investment in public transport over
regional rail plans in order to raise the profile of private roads. The PGWC will provide the
rail and improve passenger rail services in the necessary business cases to national and local
Western Cape. government to redirect funds from the construction
• National Land Transport Act, 2009. The PGWC of new roads which support private vehicle travel in
will support the assignment of transport functions the main, into the public transport system.
to the lowest competent sphere of government. • Shift in freight from road to rail. In order to
• Integrated Rapid Transport (IRT) system. Through safeguard the province’s road network, the
supporting the City of Cape Town’s IRT rollout, PGWC will advocate interventions which promote
the PGWC will phase the current subsidised public a shift in freight haulage from road to rail modes.
transport system into an integrated system where This will be explored in partnership with Transnet,
modes complement one another rather than with a focus on linkages to Saldanha Bay, as well as
compete with each other. Belcon in Bellville.
DELIVERING THE OPEN OPPORTUNITY SOCIETY FOR ALL
22• Reducing fatalities on roads through, among other 4. Targets
things, the Safely Home Programme. The PGWC
will introduce new law enforcement technology
on key stretches of the provincial road network to
reduce the speed of motor vehicles. Continuous
enforcement programmes will be implemented The main targets for increasing access to safe
with all traffic law enforcement authorities.
and efficient transport in the Western Cape are:
• Improved and coordinated law enforcement
• Achieving a 13% modal shift from private to
programmes. Overloading control will be
increased, vehicle emission testing will be public transport by 2014 (meaning a 60:40
undertaken to support sustainable resource private:public transport split into the City
management, impoundment facilities will be of Cape Town CBD), through the promotion
constructed throughout the Western Cape. of improved rail transport; support to
integrated transport networks including the
3.3 Ensuring alignment between municipal provision of rapid trunk routes for existing
integrated transport plans and integrated public transport services; and formalising the
development plans minibus taxi industry
• Shifting contestable freight haulage from
• The ministers responsible for transport and
road to rail by 10% by 2014
development planning will together ensure that
transport is duly considered in the relevant planning • Reducing the number of fatalities on the
documentation insofar as it impacts on spatial Western Cape Roads by 50% by 2014
integration, modal integration, sustainable resource
management and use, safety, social cohesion, rural • Reducing transport infrastructure
development, and economic and employment maintenance backlogs by 16% by 2014
growth, prior to approval of the integrated
transport plans and integrated development plans.
23increasing
wellness
25increasing wellness
increasing
wellness
1. Strategic objective
The PGWC is committed to increasing the wellness of the people of the
province. This will be achieved by addressing the factors that contribute
to the burden of disease and by providing comprehensive quality health
care services, from primary health care to highly specialised services.
The key indicators of wellness are:
• Life expectancy
• Maternal mortality
• Child mortality
• HIV incidence
• TB incidence
• Patient experience of the health service
The challenge for the public health service is to deliver excellent, value-
for-money care that results in the prevention of disease, a successful
return to health and wellness, or the successful management of illness.
The Western Cape Department of Health cannot be solely responsible
for increasing wellness. Indeed, even collaborative action across all
of government is not enough. What is needed is a whole-of-society
approach that mobilises the resources, knowledge, creativity and concern
of all role-players – including all three spheres of government, civil
society, business and individual citizens.
262. Problem statement well as the community-based services, are working
towards achieving that goal. Reducing the defaulter
Ill health has two components. The first concerns rate not only reduces the size of the infectious pool
the “upstream causes” of ill health. These drive in the community but prevents the generation of
what is known as “the burden of disease”. The drug-resistant TB, which requires longer stays in
second concerns the quality of care provided by hospital, is much more costly to treat, and has a very
the public health service and how efficiently it is poor prognosis.
provided; in other words, the quality, efficiency and
effectiveness of the state’s response to managing Injuries
the burden of disease. The injury burden, which includes intentional injuries
such as homicide and suicides, and unintentional
injuries, such as road traffic injuries and fire-related
2.1 The burden of disease injury, accounts for approximately 23.9% of the
Understanding the nature and causes of mortality and burden of disease in the province. In comparison to
morbidity (the “burden of disease”) underpins our the rest of the world, violence is a particular problem
strategy to increase wellness in the Western Cape. in the Western Cape, where the injury-related
mortality rate for men is ten times the global average,
The burden of disease in the Western Cape primarily while for women it is seven times that average.
consists of: Substance abuse, particularly alcohol abuse, is one of
the most important drivers of the burden of disease
HIV/Aids in the Western Cape as it fuels both violence and
In 2008, HIV prevalence amongst 15–49-year-old road traffic injuries.
antenatal women in the Western Cape was 16.1%
(the national average was 29%.) There was a steady Non-communicable diseases
increase in prevalence between 1990 and 2008. There Non-communicable diseases consist mainly of
are significant variations in prevalence within the cardiovascular diseases, cancers, respiratory
province. diseases and diabetes. Diabetes mortality rates are
Apart from mother-to-child transmission, the risk of very high in the Western Cape in comparison to
acquiring HIV primarily involves unsafe sex. The more developed countries.
sexual partners a person has at any one time, the higher
that person’s chances are of being infected with HIV.
Other contributing causes to HIV infection include poor
levels of education, coercive sex and transactional sex.
HIV spreads faster in communities with high levels of
poverty, unemployment and overcrowding.
Tuberculosis
The biggest risk factor for tuberculosis is concurrent
HIV infection. TB is described as a social disease as
it is closely linked to poverty, unemployment and
overcrowding.
The Western Cape’s incidence of TB is 909 cases
per 100 000. This gives the Western Cape the
second highest incidence of TB in South Africa after
KwaZulu-Natal. We are, however, making significant
progress in addressing the epidemic through the
implementation of the Enhanced TB Response
Strategy. The programme achieved a new smear-
positive TB cure rate of 79.4% last year – the highest
TB cure rate in South Africa. The TB defaulter rate
has decreased slowly over the past few years with
the implementation of various interventions and
now stands at 8.2%. More effort will be required
to reach the national and global 2011 target of a
defaulter rate of below 5%, and various partners, as
27increasing wellness
Cardiovascular disease includes high blood Childhood illnesses
pressure, heart attacks and strokes. The causes Childhood illnesses include malnutrition, diarrhoeal
of cardiovascular disease, while partly genetic, diseases, respiratory illnesses and perinatal/neonatal
are primarily environmental factors, specifically an conditions. Acutely ill children often present with
unhealthy lifestyle. The most important risk factors co-morbidity that involves multiple conditions. This
are a lack of regular physical exercise, long-term makes their illness more severe and they often have
use of tobacco products and the consumption of to be admitted to hospitals.
an unhealthy diet characterised by a high intake of
fat, salt and sugar, and a low intake of fibre, fruit Diarrhoeal disease is a seasonal phenomenon which
and vegetables. An unhealthy lifestyle may lead to peaks between February and May each year. It creates
obesity, hypertension and diabetes. enormous pressure on the health services. The critical
causative “upstream” factor is a lack of clean water
Compared with the rest of the country, non- and sanitation in informal settlements.
communicable or chronic diseases account for a much
larger proportion of deaths in the Western Cape
(58%) than nationally (38%) and are the third leading 2.2 Quality of health care
cause of premature years of life lost in the province.
The Western Cape has the highest prevalence of While the Western Cape Department of Health
smoking of all provinces – 44.7% of men and 27% of prides itself on being one of the better performing
women are smokers. departments in the country, the health services operate
under immense pressure on a daily basis. Symptoms of
Mental illness this include the high bed occupancies in our hospitals, the
The abuse of substances, especially drugs such as tik, frequent need to divert ambulances between hospitals,
has reached epidemic proportions and makes the an inability to secure intensive care beds for critically ill
burden of mental ill health on the public health service patients on time, the long waiting times at our clinics and
much worse. the long waiting lists for surgical procedures.
DELIVERING THE OPEN OPPORTUNITY SOCIETY FOR ALL
28While the Department continues to strive for Development Goals. A strong culture and system
efficiencies on a daily basis, commits to operating of monitoring and evaluation will be embedded at
within its budget allocation and delivers a service all levels of the organisation to ensure we deliver
in line with the legal auditable requirements, the on these targets.
need to expand and strengthen the health service
• The retention of a primary health care philosophy:
platform with the increasing burden described
The PHC philosophy means providing a
above must be recognised.
comprehensive service that includes preventive,
Given this, the key challenges faced by the promotive, curative and rehabilitative care. The
Department of Health are: primary care services are points of first contact
for the patient. These services are supported and
• Quality of care
strengthened by all levels of care including acute
• Measuring health outcomes and structuring the and specialised referral hospitals and an efficient
service effectively to address them patient transport service.
• Limited funding • Strengthening the district health services model:
• Cost control The DHS model gives a district manager and his
or her team responsibility for achieving the health
• The need for additional infrastructure outcomes targeted for a specific geographical area.
• The recruitment, development and retention of All health services (public and private) provided
health care workers within the area are coordinated by the district
health management team. The district manager is
• The need for improved information management accountable and also plays a stewardship role in
systems to support strategy and operations securing and accessing the support of other levels
• The need to acquire modern technology (medical of the service.
equipment and ICT systems) to achieve strategic The Department has begun to take early steps
objectives in this direction over the recent years. Health
is delivered within well defined subdistrict and
district boundaries in the province. PHC services
3. Plan to achieve outcomes and provincially aided district hospitals in the rural
districts have been provincialised. This means that
3.1 Healthcare 2020 all public sector health services in the rural districts
are provided by a single authority – the provincial
The Department of Health provides a comprehensive government. District management structures
package of health services, including the promotion and offices have been created. This consolidation
of health, prevention of disease, curative care and will result in better coordination and improved
rehabilitation, and training and education, delivered efficiencies. The district model must be further
across all levels of care. In order to deliver on its strengthened to ensure the health outcomes
mandate, the Department will develop a compelling necessary for delivery on Healthcare 2020.
vision for 2020 and an effective strategy to deliver on
that vision by 1 August 2011.
The following key elements of the strategy to deliver
on Healthcare 2020 have been identified:
• Patient-centredness: The quality of care, with a
focus on patient experience, will lie at the heart of
Healthcare 2020. This means that excellence in the
clinical quality of care and the need for superior
patient experience must inform every effort
and endeavour of the public health sector in the
Western Cape.
• A move towards an outcomes-based approach:
The department will gear itself to focus on
improving the health outcomes of patients and the
broader population. This will include improving
life expectancy and reducing maternal and child
mortality. Targets will be guided by the Millennium
29You can also read