DELTA ADAPTS: CREATING A CLIMATE RESILIENT FUTURE - EQUITY TECHNICAL MEMORANDUM MAY 2021
←
→
Page content transcription
If your browser does not render page correctly, please read the page content below

DELTA ADAPTS: CREATING A CLIMATE
        RESILIENT FUTURE
      EQUITY TECHNICAL MEMORANDUM

              MAY 2021
DELTA STEWARDSHIP COUNCIL
     A California State Agency

                                 This page intentionally left blank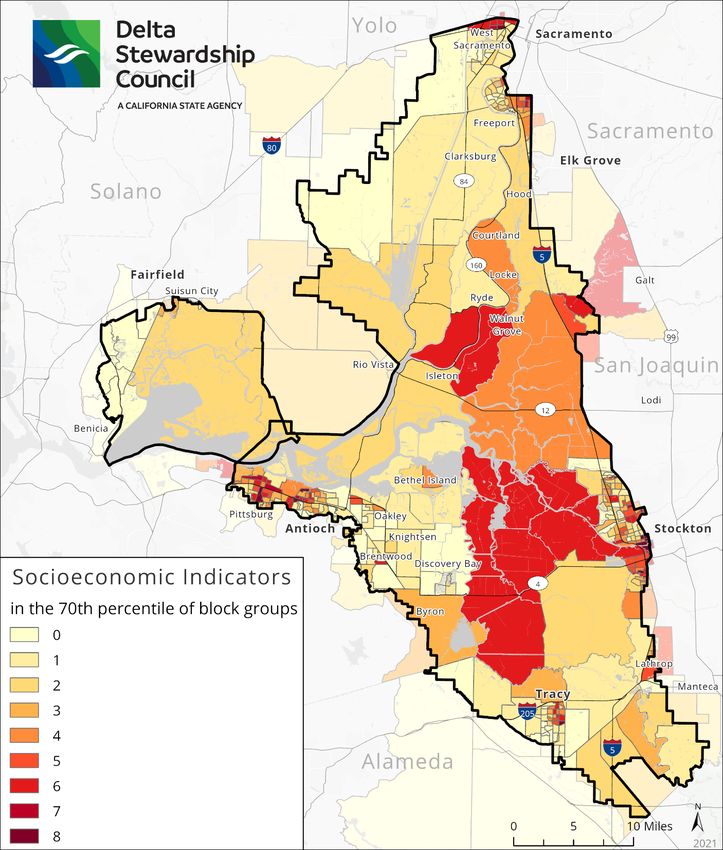
Delta Adapts: Equity Technical Memorandum
                                                                                                                   Contents

CONTENTS
Chapter 1. Background .............................................................................................. 1-1
     1.1 Purpose ......................................................................................................................... 1-1
     1.2 Conceptual Model and Definitions ............................................................................... 1-2
     1.3 Climate Change Stressors and Hazards ........................................................................ 1-3
             1.3.1 Flooding ......................................................................................................... 1-5
             1.3.2 Extreme Heat ................................................................................................. 1-8
             1.3.3 Wildfire ........................................................................................................ 1-10
     1.4 Existing Data and Studies ............................................................................................ 1-13
             1.4.1 Existing Vulnerability Indices ....................................................................... 1-13
             1.4.2 Additional Data Sources .............................................................................. 1-20
             1.4.3 Local and Regional Plans ............................................................................. 1-22
             1.4.4 Data Gaps ..................................................................................................... 1-26
Chapter 2. Methods .................................................................................................... 2-1
     2.1 Equitable Engagement .................................................................................................. 2-1
     2.2 Assessing Vulnerability.................................................................................................. 2-2
     2.3 Preliminary Approach ................................................................................................... 2-3
     2.4 Revised Approach ......................................................................................................... 2-4
             2.4.1 Indicator Selection ......................................................................................... 2-4
             2.4.2 Weighting Scheme ......................................................................................... 2-6
             2.4.3 Other Vulnerable Populations ....................................................................... 2-6
Chapter 3. Results/Discussion .................................................................................. 3-1
     3.1 Socially Vulnerable Communities ................................................................................. 3-1
             3.1.1 Stockton ......................................................................................................... 3-6
             3.1.2 Pittsburg......................................................................................................... 3-7
             3.1.3 Antioch ........................................................................................................... 3-7
     3.2 Vulnerable Populations ................................................................................................. 3-8
             3.2.1 Mobile Home Park Communities .................................................................. 3-8
             3.2.2 Other Vulnerable Populations ..................................................................... 3-11
Chapter 4. References ............................................................................................... 4-1
Chapter 5. Appendices .............................................................................................. 5-1
     Appendix A: Definitions ...................................................................................................... 5-2
     Appendix B: Maps ............................................................................................................... 5-3

May 2021                                                                                                                                     i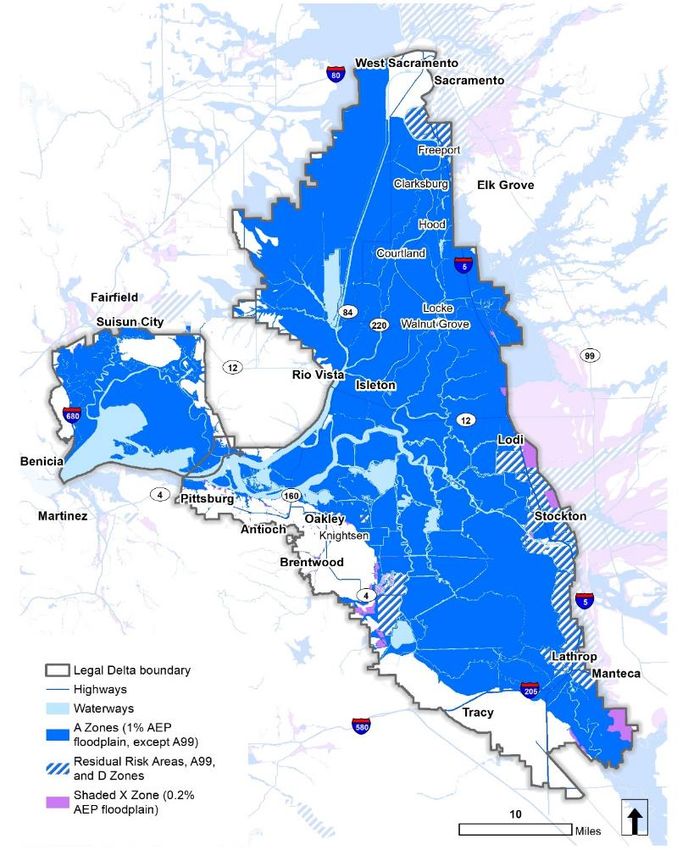
DELTA STEWARDSHIP COUNCIL
                      A California State Agency

FIGURES
Figure 1. Conceptual Model of Vulnerability .................................................................................. 1-2
Figure 2. Relationship Between Climate Stressors and Hazards Evaluated in the VA.………………..1-4
Figure 3. Existing Flood Hazards in the Delta ................................................................................. 1-6
Figure 4. Existing Urban Heat Island Effects in the Delta ............................................................... 1-9
Figure 5. Existing Wildfire Hazards in the Delta............................................................................ 1-11
Figure 6. Number of Indicators with Values in the 70th Percentile of All Block Groups in
        the Delta .............................................................................................................................. 3-2
Figure 7. Number of Indicators with Values in the 70th Percentile of All Tracts in the Delta ........ 3-3
Figure 8. Distribution of Block Groups by Social Vulnerability Index Score ................................... 3-4
Figure 9. Geographic Distribution of Social Vulnerability in the Delta……………………………………….3-5
Figure 10. Distribution of Block Groups by Social Vulnerability Index Score ................................. 3-9
Figure B-1. CalEnviroScreen 3.0 ...................................................................................................... 5-4
Figure B-2. California Heat Assessment Tool: Heat Health Action Index ....................................... 5-5
Figure B-3. Disadvantaged Communities Mapping Tool ................................................................ 5-6
Figure B-4. Healthy Places Index ..................................................................................................... 5-7
Figure B-5. Regional Opportunity Index: People ............................................................................ 5-8
Figure B-6. Regional Opportunity Index: Place ............................................................................... 5-9
Figure B-7. Social Vulnerability Index (SoVI) ................................................................................. 5-10
Figure B-8. Disadvantaged Unincorporated Communities in the Delta ....................................... 5-11
Figure B-9. Disadvantaged Unincorporated Communities in Areas that use Delta Exports ....... 5-12
Figure B-10. Mobile Home Parks .................................................................................................. 5-13

     TABLES
Table 1. Index Characteristics ....................................................................................................... 1-13
Table 2. Low-Income, High-Minority Indicators in RTPs............................................................... 1-23
Table 3. Other Indicators of Vulnerability in RTPs ........................................................................ 1-24
Table 4. Complementary Planning Initiatives ................................................................................. 2-2
Table 5. Exposure Data.................................................................................................................... 2-3
Table 6. Indicators of Social Vulnerability to Climate Change, Block Group Scale ........................ 2-5
Table 7. Indicators of Social Vulnerability to Climate Change, Tract Scale .................................... 2-5
Table 8. Average MHHI of Block Groups as a Share of State MHHI, by Jurisdiction .................... 3-10
Table A-1. Codified Definitions Related to Vulnerable Populations ............................................... 5-2

ii                                                                                                                                     May 2021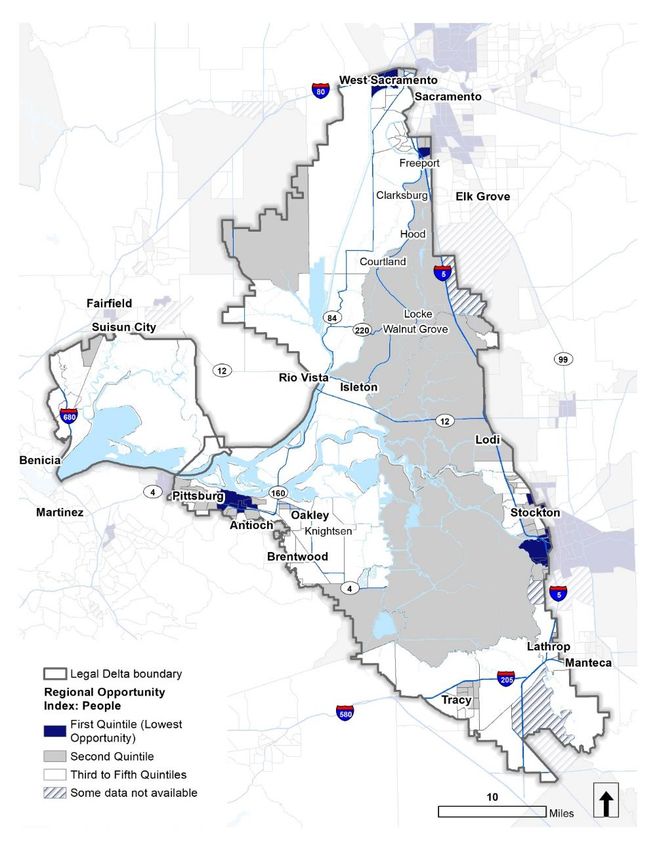
Delta Adapts: Equity Technical Memorandum
                                                                              Contents

ACRONYMS AND OTHER ABBREVIATIONS
 AB                Assembly Bill
 ACS               American Community Survey
 AEP               Annual Exceedance Probability
 ART               Adapting to Rising Tides
 BCDC              Bay Conservation and Development Commission
 CalBRACE          California Building Resilience Against Climate Effects
 CalEnviroScreen   California Communities Environmental Health Screening Tool
 CalEPA            California Environmental Protection Agency
 CHAT              California Heat Assessment Tool
 CCHVIz            Climate Change and Health Vulnerability Indicators
 CDP               Census Designated Place
 CDPH              California Department of Public Health
 DAC               Disadvantaged Community
 DCI               Distressed Communities Index
 Delta             San Francisco-San Joaquin Delta, including the Suisun Marsh
 DUC               Disadvantaged Unincorporated Community
 GGRF              Greenhouse Gas Reduction Funds
 GIS               geographic information system
 HHAI              Heat-Health Action Index
 HHE               Heat Health Event
 HPI               Health Places Index
 MPO               Metropolitan Planning Organization
 MTC               Metropolitan Transportation Commission
 NOAA              National Oceanic and Atmospheric Agency
 OEHHA             Office of Environmental and Health Hazard Assessment
 OPR               Governor’s Office of Planning and Research
 ROI               Regional Opportunity Index
 RTP               Regional Transportation Plan
 SACOG             Sacramento Area Council of Governments
 SB                Senate Bill
 SDAC              Severely Disadvantaged Community
 SJCOG             San Joaquin Council of Governments
 SoVI              Social Vulnerability Index
 SWRCB             State Water Resources Control Board
 VA                Vulnerability Assessment

May 2021                                                                            iii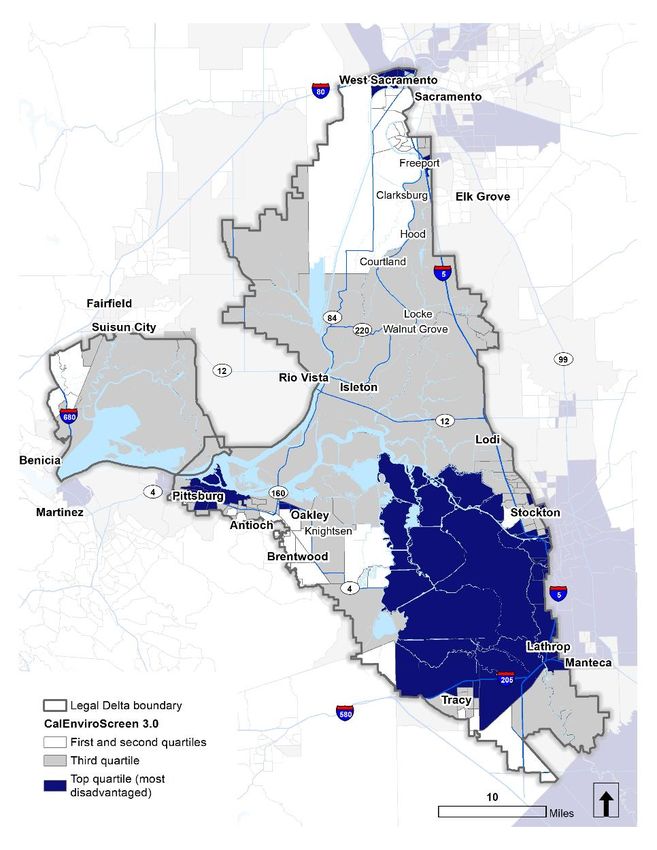
DELTA STEWARDSHIP COUNCIL
          A California State Agency

                                      This page intentionally left blank

iv                                                                         May 2021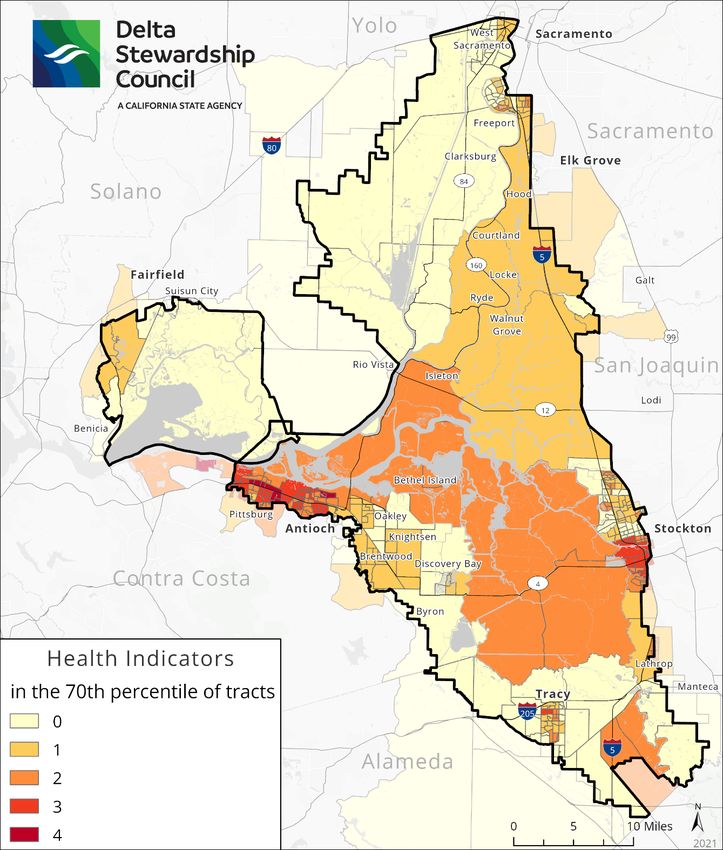
DELTA STEWARDSHIP COUNCIL
                  A California State Agency

CHAPTER 1. BACKGROUND
1.1 Purpose
Equity is just and fair inclusion into a society in which all can participate, prosper, and reach their
full potential (OPR 2017a, PolicyLink 2018). The Governor’s Office of Planning and Research
identifies the following equity challenges for climate change policy: “addressing the impacts of
climate change, which are felt unequally; identifying who is responsible for causing climate
change and for actions to limit its effects; and, understanding the ways in which climate policy
intersects with other dimensions of human development, both globally and domestically” (OPR
2017a). Put another way, climate equity means acknowledging that those who have benefitted
least from the economic activities that cause greenhouse gas emissions are often most
vulnerable to the impacts of climate change (IPCC 2014, Roos 2018, Shonkoff et al. 2011,
Stallworthy 2009).
By Executive Order, State agencies must consider the most vulnerable populations when
incorporating climate change into planning and investment decisions (EO B-30-15). The Delta
Stewardship Council intends to incorporate equity into the Delta Adapts: Creating a Climate
Resilient Future (Delta Adapts) initiative by identifying the communities and populations that are
most vulnerable to climate hazards in the Delta and developing adaptation strategies that
recognize and remedy these inequities. The primary purpose of this memorandum is to identify
data sources, methods, and best practices to ensure that equity is addressed in the first phase of
the initiative, the vulnerability assessment (VA). 1 The information generated in the VA will
inform engagement and planning priorities in the second phase of the initiative, the adaptation
strategy.
Local agencies have similar requirements to incorporate equity (pursuant to Senate Bill 1000) 2
and address climate change (pursuant to Senate Bill 379) 3 in their general plans. While some

1
 This memo also seeks to identify an approach to Delta Adapts that incorporates environmental justice concerns,
to the extent that such concerns are linked to the climate change impacts within the scope of the study. The
Council’s first Five Year Review of the Delta Plan identified environmental justice as one of four key planning topics
and emerging issues requiring more information and analysis to inform potential future actions (Council 2019).
While Delta Adapts will not comprehensively address this need, this memo recognizes the connections between
climate equity and environmental justice and identifies data sources and methods that could support future,
broader environmental justice efforts.
2
 Compliance with SB 1000 requires local agencies to identify goals, policies, and objectives to reduce risks to
disadvantaged communities, defined as areas disproportionately affected by environmental pollution and other
hazards that can lead to negative public health effects, exposure, or environmental degradation, or with
concentrations of people who are of low income, high unemployment, low levels of homeownership, high rent
burden, sensitive populations, or low levels of educational attainment (Cal. Health & Saf. Code § 39711).
3
 Compliance with SB 379 requires local agencies to identify the risks that climate change poses, the geographic
areas at risk, and feasible climate adaptation and resiliency strategies to avoid or minimize those risks (Cal. Gov.
Code § 65302).

May 2021                                                                                                               1-1
Delta Adapts: Equity Technical Memorandum
                                                                                        Chapter 1. Background

local agencies within the Delta have already met these obligations by adopting environmental
justice elements or updating safety elements in their general plans, others are still working
toward compliance with this new set of requirements. Therefore, this memo seeks to identify
data sources and methods that are also useful in addressing SB 1000 and SB 379.

1.2 Conceptual Model and Definitions
The Integrated Climate Adaptation and Resiliency Program (ICARP) Technical Advisory Council
(TAC) developed and adopted the following definition of the most vulnerable populations to
assist local and state agencies in implementing the Executive Order (OPR 2018) 4:
           “[T]hose which experience heightened risk and increased sensitivity to
           climate change and have less capacity and fewer resources to cope with,
           adapt to, or recover from climate impacts. These disproportionate effects
           are caused by physical (built and environmental), social, political, and/or
           economic factor(s), which are exacerbated by climate impacts. These
           factors include, but are not limited to, race, class, sexual orientation and
           identification, national origin, and income inequality.”
This definition aligns with the Intergovernmental Panel on Climate Change (IPCC) definition of
vulnerability: “Vulnerability encompasses a variety of concepts and elements including sensitivity
or susceptibility to harm and lack of capacity to cope and adapt” (2014). The IPCC defines
adaptive capacity as, “The ability of systems, institutions, humans and other organisms to adjust
to potential damage, to take advantage of opportunities, or to respond to consequences (2014).
In simplified terms, exposure, sensitivity, and adaptive capacity interact with one another to
increase vulnerability to climate change (Figure 1).

Figure 1. Conceptual Model of Vulnerability
Any person exposed to a climate hazard is vulnerable. Exposure is the presence of people (or
other assets) in places and settings that could be affected by climate change hazards (IPCC

4
    Related, codified definitions are summarized in Appendix A.

1-2                                                                                                 May 2021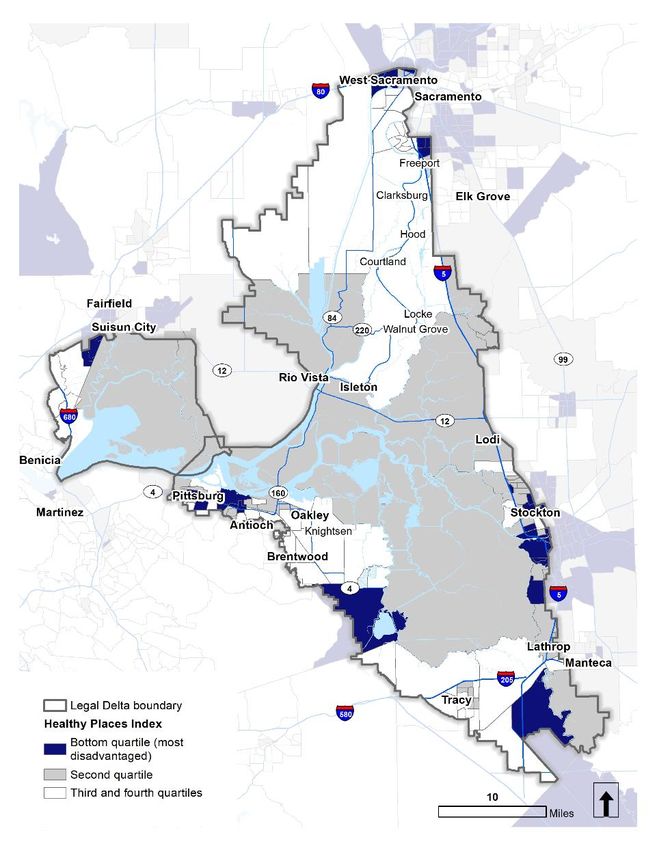
DELTA STEWARDSHIP COUNCIL
                A California State Agency

2014). However, some individuals may have physiological or socioeconomic characteristics that
increase their sensitivity to a particular climate change hazard (Raval et al. 2019). Similarly, some
individuals, neighborhoods, or communities may have greater ability or opportunity to adjust to
future hazards or respond to the consequences of those hazards (IPCC 2014). The most
vulnerable populations are those that are exposed, are highly sensitive, and have low adaptive
capacity (Figure 1).
Direct exposure is not a prerequisite for a person or neighborhood to be vulnerable to the
impacts of climate change. For example, the neighbors of households that experience flooding
may be indirectly affected by the loss of social networks (Paterson et al. 2018) or by consequent
changes in occupancy rates and property values (Kunreuther et al 2018). Whole communities
may lose access to workplaces, schools, or critical community facilities due to flood impacts in a
single neighborhood (Kunreuther et al 2018). Thus, a person or community that is not exposed
to a climate change hazard could still be highly vulnerable if they are highly sensitive or lack the
resources or opportunities to prepare for and respond to the impacts.
Exposure is typically a function of the physical environment, such as the height of nearby levees
and the likelihood that water levels will exceed that height; or urban density and the likelihood
that local temperatures will reach unhealthy levels. Sensitivity and adaptive capacity tend to be a
function of health and socioeconomic characteristics, such as the income that a household
would need to access medical treatment, evacuate, or secure alternative shelter. In general, this
memo will refer to sensitivity and adaptive capacity jointly as social vulnerability.
This conceptual model is not intended to imply that environmental and social vulnerability are
independent of one another. Ample research demonstrates that the physical environment has
been shaped by policies and attitudes towards particular socioeconomic groups. Redlining and
discrimination, reinforced by market forces, have created conditions in which many low-income
communities and communities of color reside and work in more hazardous environments
(Bartlett 1998, CSIWG 2018, Rothstein 2017, Shonkoff et al. 2011) and experience significant
health disparities (McCall 2018, OPR 2017b). Thus, social vulnerability is also closely linked to
place, and is spatially explicit (Raval et al. 2019).

1.3 Climate Change Stressors and Hazards
Delta Adapts has identified three primary climate stressors: sea level rise, changes in
precipitation and hydrologic patterns, and changes in air temperature. Chapter 3 of the VA
describes each of the climate stressors in detail.
These climate stressors are expected to create a variety of climate hazards for populations in the
Delta. Chapter 3 of the VA identifies four climate hazards as having increasing impacts to the
Delta: extreme heat, wildfire, drought, and flooding (Figure 2). Increased air temperatures will
cause more frequent and intense extreme heat events; changes in temperature, precipitation,
and hydrology will increase the risk of drought and wildfire; and sea level rise and changes in
precipitation and hydrology will both increase the risk of levee overtopping, and consequent
flooding.

May 2021                                                                                          1-3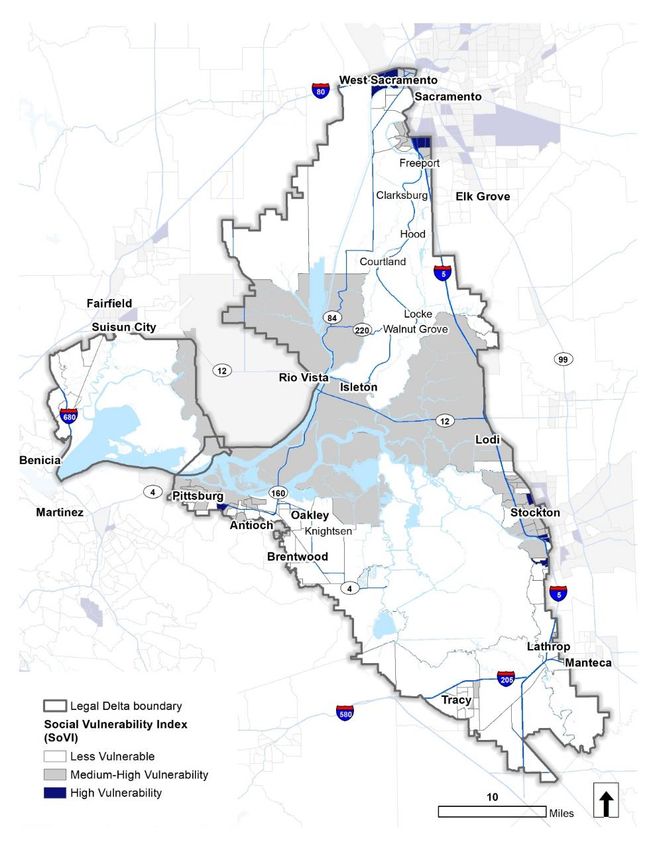
Delta Adapts: Equity Technical Memorandum
                                                                               Chapter 1. Background

Figure 2. Relationship Between Climate Stressors and Hazards Evaluated in the VA

This memo will investigate the factors that increase sensitivity or reduce the capacity to adapt to
three of these climate hazards: flooding, extreme heat, and wildfire. Drought will not be
evaluated in this memo because its effects extend to a different scale than the other hazards;
the effects of drought in the Delta are felt far beyond the Delta - throughout the Delta
watershed, the San Joaquin Valley, the San Francisco Bay Area, and in Southern California
communities. The potential equity implications of drought are discussed qualitatively in the
Water Supply Technical Memorandum and the Crop Yield and Agricultural Production Technical
Memorandum.

1-4                                                                                        May 2021
DELTA STEWARDSHIP COUNCIL
A California State Agency
1.3.1 Flooding
Much of the Delta is protected from tidal inundation and/or riverine flooding by levees. Levees
create residual flood risk for the people and property located behind them, as they are only
designed to protect landside development against a specific peak water level (NRC 2013). Over
time, land subsidence, land cover change, deferred maintenance, and changes to upstream flood
control systems have increased residual flood risk in the Delta to among the highest in the nation
(Burton & Cutter 2008, DWR 2012, NRC 2013). Based on federal levee accreditation criteria and
existing flood insurance studies, a majority of land in the Delta currently has a 1 percent or
greater probability of flooding each year (Figure 3). Climate change will further exacerbate these
risks. Sea level rise will interact with changes in precipitation and hydrology to increase the
frequency of extreme water levels and the risk of levee overtopping and failure throughout the
Delta (Knowles et al. 2018).
Flooding has both immediate and long-term public health impacts. Flooding can lead to death or
injury by drowning, hypothermia, electrocution, and trauma from debris and falls (Bell et al.
2016, Paterson et al. 2018). Individuals experiencing homelessness and emergency response
workers have greater exposure to these immediate risks (OPR 2017b). Drowning is more likely to
result from flash flooding than from slow-onset flooding (Paterson et al. 2018), but even slow-
onset flooding can be deadly to individuals who do not have adequate warning information or
the capacity to evacuate. Income levels affect how people perceive flood risks, and their
willingness and ability to evacuate in response to warnings (Bell et al. 2016). Linguistically
isolated households may not be as aware of flood risks or receive timely warnings (Bell et al.
2016). In addition, households that lack access to a vehicle, as well as young children, older
adults, people with disabilities, and people living in nursing homes, prisons, and other
institutions have less ability to evacuate on their own, and are therefore more vulnerable (Bell et
al. 2016, OPR 2017b, Roos 2018).
Power outages caused by flooding can cause carbon monoxide poisoning (Bell et al. 2016).
Flooding that causes power outages, damages health care infrastructure, or displaces people can
also exacerbate existing heath conditions by making it more difficult to access medication and
treatment (McCall 2018, Paterson et al. 2018), resulting in both immediate and chronic health
impacts. People with cancer, cardiovascular disease, hypertension, diabetes, kidney disease, and
chronic respiratory disorders experience greater health effects after flooding (Bell et al. 2016,
Paterson et al. 2018).
Older adults are more likely to have existing, chronic medical conditions, and are therefore more
sensitive to flood events (Bell et al. 2016). Low-income people and people of color also have
higher baseline rates of chronic medical conditions that increase their sensitivity to the effects of
flooding. It is important to note that these population health disparities are the result of long-
term, cumulative, social and economic factors - not intrinsic differences based on race (OPR
2017b).
May 2021 1-5Delta Adapts: Equity Technical Memorandum
Chapter 1. Background
Figure 3. Existing Flood Hazards in the Delta
Data Source: FEMA 2020. The 1 percent Annual Exceedance Probability (AEP) floodplain is more
commonly known as the 100-year floodplain. The 0.2 percent AEP floodplain is more commonly
known as the 500-year floodplain. Hatched areas are protected by levees with varying levels of
accreditation and protection.
Exposure to floodwaters increases the risk of infection, pneumonia, gastrointestinal disease, and
other diseases (Paterson et al. 2018). LGBTQ+ individuals, immigrants, and individuals without
health insurance are less able to access treatment for these conditions, and are therefore more
vulnerable (McCall 2018, OPR 2017b).
1-6 May 2021DELTA STEWARDSHIP COUNCIL
A California State Agency
Increased incidence of post-traumatic stress disorder, depression, and increased stress levels
have also been linked to flood events. Mental health effects can persist for years after an event
(McCall 2018). Flood events are linked to increases in pre-term births and low birth weight
infants due to increased stress among pregnant mothers (Bell et al. 2016).
People experiencing homelessness are more vulnerable to flooding because they have higher
rates of underlying health conditions and generally lack access to health care (OPR 2017b).
People experiencing homelessness may live in their vehicles, which are the most common
location of flash flood fatalities (Terti et al. 2016). People experiencing homelessness also
frequently reside in informal encampments within or near drainageways and waterways and may
not have information or warning about flash floods (Moreno et al. 2020). Encampments near
drainageways and waterways can also increase the risk of flooding. Unsecured property and
other debris from encampments can blow or wash into drainageways and block flow, increasing
flood stages upstream (Moreno et al. 2020). Encampments that are dug into earthen
embankments and levees can increase erosion and risk of levee failure (Moreno et al. 2020).
Thus, there are feedback effects between homelessness and flood risk, a relationship of growing
concern to the Central Valley Flood Protection Board and levee maintenance districts.
Flooding also damages homes, schools, and community infrastructure, displacing households,
interrupting business, and disrupting children’s education (Bell et al. 2016). People living in
mobile homes are more vulnerable to disasters such as flooding due to both their structural
properties and the tendency for low-income households to occupy this housing type (Cutter et
al. 2000, Fothergill & Peek 2004, Kusenbach et al. 2010). Mobile home foundations may not be
designed for flood forces, and even with a reinforced foundation, structures must be properly
anchored to the foundation to withstand a flood. Although construction standards for
manufactured and mobile homes have improved over time, mobile home residents tend to be
disproportionately impacted by flood events (Baker et al. 2014, FEMA 2009, Kusenbach et al.
2010, Terti et al. 2016).
Communities’ and individual households’ ability to access resources to recover from floods (such
as insurance, public assistance, private loans, and home buyouts) has been found to vary based
on race (Elliott et al. 2020) as well as less-tangible factors, such as a community’s shared sense of
place and history (Finch et al. 2010). Lower income households and renters have fewer resources
to repair damage or procure temporary and replacement housing (Cutter et al. 2003).
While a variety of tools and studies are readily available to understand social vulnerability to
flooding from sea level rise along California’s coastline and in the San Francisco Bay Area, none
of these extend inland to the Delta (see Raval et al. 2019 for a comprehensive inventory). Burton
and Cutter (2008) developed an index to measure social vulnerability to levee failure in the
Delta, but, due to data availability, did not include Contra Costa or Solano County. Moreover, no
existing social vulnerability studies account for the exposure of Delta communities to flooding
under future conditions that include both sea level rise and changes in precipitation and
hydrology.
Delta Adapts will model sea level rise throughout the Delta and Suisun Marsh, and produce
detailed information about the exposure of leveed islands to overtopping due to sea level rise, as
May 2021 1-7Delta Adapts: Equity Technical Memorandum
Chapter 1. Background
well as the combined effects of sea level rise and high flow events. The Council is well-positioned
to leverage this exposure information, in combination with existing indicators of social
vulnerability, to identify the populations that are most vulnerable to flooding.
1.3.2 Extreme Heat
Extreme heat events cause more deaths in the United States than any other natural hazard (Bell
et al. 2016) and are an existing public health concern in California (McCall 2018). The 2006 heat
wave in California caused an estimated 147 deaths statewide; 13 of these were in Sacramento
County and 17 in San Joaquin County (Ostro et al. 2009). Climate change will increase the
frequency of extreme heat events, and associated mortality risk (Hoshiko et al. 2010, Ostro et al.
2011, Steinberg et al. 2018).
The built environment plays a significant role in extreme heat events. In urban areas, impervious
surfaces and scarcity of vegetation create microclimates, or “urban heat islands” that are hotter
than surrounding rural areas (Altostratus Inc. 2015, Oke 1989, Oke 1982) (Figure 4). Even within
heat islands, temperatures can vary spatially, resulting in hotspots of land surface temperature
(Huang et al. 2011). Low-income communities and communities of color are overrepresented in
urban areas that have higher rates of impervious cover and less tree cover and are therefore
more likely to be exposed to the urban heat island effect (Shonkoff et al. 2011).
Exposure to extreme heat can cause cramps, syncope (fainting), edema, and heat exhaustion,
which are all readily treatable conditions if a person is able to quickly relocate to a cool
environment and rehydrate. If a person does not have immediate access to a cooler
environment at the onset of heat stress and exhaustion, and is not able to recover, these
conditions may become more serious and progress to heat stroke. Heat stroke can cause death
from cardiac failure, suffocation, and kidney failure (McCall 2018).
Older adults are considered the age group most sensitive to extreme heat events, especially
those with impaired cognitive ability, immune system, body temperature regulation, and
mobility (Hajat et al. 2007, Knowlton et al. 2009, Kovats et al. 2004). Children and infants are also
highly sensitive to extreme heat events since they are still developing physically and emotionally
(Ebi & Paulson 2007, Gamble et al. 2016). During the 2006 California heat wave, young children
and adults older than 65 experienced higher rates of adverse health effects. Acute kidney failure,
electrolyte imbalance, and inflammation were the most common heat-related health effects
among the elderly (Knowlton et al. 2009).
1-8 May 2021DELTA STEWARDSHIP COUNCIL
A California State Agency
Figure 4. Existing Urban Heat Island Effects in the Delta
Data Source: CalEPA 2015
Extreme heat can also increase hospitalization for other conditions, including pneumonia, stroke,
diabetes, and respiratory disease (McCall 2018). Extreme heat can increase ozone formation and
air pollution, further aggravating existing respiratory disease among sensitive individuals (McCall
2018). Individuals suffering from chronic illnesses, such as diabetes, cardiovascular diseases, and
asthma, are more sensitive to these effects. Mental illness can also cause heightened sensitivity
to extreme heat events from medications that interfere with self-regulation of body temperature
May 2021 1-9Delta Adapts: Equity Technical Memorandum
Chapter 1. Background
(Gamble et al. 2016, OPR 2017b). Because there are disproportionately high levels of health
conditions among low-income communities and people of color, these groups are
disproportionately impacted by extreme heat (OPR 2017b, Shonkoff et al. 2011). As with
flooding, LGBTQ+ individuals, immigrants, and individuals without health insurance may face
more difficulty accessing care for these conditions (Fowler et al. 2010, OPR 2017b).
People who work outdoors, such as farm workers and construction workers, are more exposed
to extreme heat and are more sensitive because body temperatures are elevated during
strenuous activity (Gamble et al. 2016). Between 1992 and 2006, crop workers represented 16
percent of occupational deaths in the U.S. from exposure to environmental heat (Centers for
Disease Control and Prevention 2008).
The primary adaptation strategies individuals use to combat extreme heat are air conditioning,
or evacuating to a cooling center or other, cooler location (Shonkoff et al. 2011). Individuals
experiencing homelessness are highly vulnerable because they are unlikely to have access to
either adaptation mechanism (OPR 2017b). Incarcerated populations are susceptible to heat-
related illness since many correctional facilities do not provide adequate air conditioning
(Motanya & Valera 2016, OPR 2017b). Fewer African Americans, Latinos, and people living in
poverty have home air conditioning (Shonkoff et al. 2011). Renters without air conditioning may
not have the option of installing it (OPR 2017b). Low-income people who do have access to air
conditioning may not be able to afford higher energy costs associated with using air conditioning
during peak demand (Gamble et al. 2016, OPR 2017b). Households without access to a vehicle
are less able to evacuate and are therefore more vulnerable (OPR 2017b, Shonkoff et al. 2011).
A variety of existing studies and tools have projected extreme heat events under various climate
change scenarios (CDPH 2019a, Steinberg et al. 2018) and developed indices to measure the
social vulnerability of California communities to extreme heat, including those in the Delta
(Cooley et al. 2012, Steinberg et al. 2018). Thus, there is ample data available to identify the
populations in the Delta that are most vulnerable to extreme heat. The applicability of each of
these tools to the VA is discussed in the Existing Vulnerability Indices and Revised Approach
sections, below.
1.3.3 Wildfire
Wildfire has become a major public safety threat in California due to decades of fire suppression,
build-up of dead plant material, and development at the wildland-urban interface (WUI). Existing
wildfire risk in the Delta is low relative to other parts of the state, though several large fires have
occurred at the edges of the Delta in recent years. Several moderate Wildfire Hazard Severity
Zones are designated at the edges of the Delta: in rural areas of Solano County between Suisun
Marsh and Cache Slough; east of the Sacramento River, between Hood and Elk Grove; and at the
southeastern Delta boundary between Clifton Court and Antioch (Figure 5).
The California Department of Forestry and Fire Protection (CAL FIRE) was recently directed to
prepare an assessment of community wildfire vulnerability in California (Executive Order N-05-
19). CAL FIRE’s analysis accounted for exposure risk, as well as community sensitivity and
adaptive capacity to wildfire. The analysis confirmed that, relative to other parts of the state, the
Delta has very low wildfire vulnerability (CAL FIRE 2019).
1-10 May 2021DELTA STEWARDSHIP COUNCIL
A California State Agency
Figure 5. Existing Wildfire Hazards in the Delta
Data Source: CalFIRE 2020
Climate change projections indicate that the Delta will not experience a significant increase in
exposure to wildfire. However, climate change is projected to increase wildfire frequency and
severity in areas surrounding the Delta, by stressing forests, altering wind patterns, and
lengthening fire season (Westerling & Bryant 2006). Wildfires in other parts of the state can
create hazardous air quality conditions downwind, affecting the health of Delta residents.
May 2021 1-11Delta Adapts: Equity Technical Memorandum
Chapter 1. Background
Exposure to wildfire smoke is highly dependent on the fire location, wind, temperature, and
humidity, and is difficult to predict on a daily basis let alone at a climatic scale (Stone et al. 2019).
However, recent data indicates that northern California has among the longest duration and
highest levels of fine particulate matter from large fires (Rappold et al. 2017), suggesting the
Delta may have relatively high exposure in the future.
Wildfire smoke is a significant source of fine particulate matter, carbon monoxide, ozone, and
toxic chemicals (Lipsett et al. 2008, McCall 2018). Toxic chemicals in wildfire smoke, such as
formaldehyde and benzene, are believed to contribute to long-term adverse health impacts such
as heart and lung disease, and cancer (Stone et al. 2019). Infants, children, pregnant women,
older adults, and people with existing heart and lung conditions are particularly sensitive to
these air pollutants.
Particulate matter inhalation has been linked to increased hospitalizations for cardiovascular
conditions, stroke, asthma, bronchitis, and other respiratory conditions (McCall 2018) and
premature death (Stone et al. 2019). Similar to the populations sensitive to extreme heat, people
with existing cardiovascular disease, asthma, and chronic obstructive pulmonary disease (COPD)
are particularly sensitive (Stone et al. 2019). Older adults, children, and pregnant women are
physiologically more sensitive to smoke inhalation (Stone et al. 2019). Children’s lungs are still
developing, and they breathe in more air per pound of body weight than adults (Lipsett et al.
2008, Stone et al. 2019). Children are more likely to be exposed to wildfire smoke because they
spend more time outside and engage in more physical activity. Pregnant women’s exposure to
smoke during the 2003 Southern California wildfires was linked to lower birth weights (Breton et
al. 2011, Holstius et al. 2012).
As with the other climate change hazards described above, low-income communities and people
of color are likely to be disproportionately impacted by wildfire hazards because these
populations suffer from high rates of various health conditions (Stone et al. 2019). Reducing
exposure to wildfire smoke requires adaptation measures similar to those recommended for
extreme heat: staying indoors, using air conditioning (or air filters), or evacuating (Stone et al.
2019). Housing quality can also be a significant factor in a household’s exposure to harmful
components of wildfire smoke in indoor air (Joseph et al. 2020). Low socioeconomic status
households are more likely to live in buildings of lower quality and are less likely to have access
to air conditioning or other air filtration systems, and are thus more likely to be exposed to poor
indoor air quality during wildfire smoke events (Joseph et al. 2020; Stone et al. 2019). Thus, the
same populations face increased exposure and reduced adaptive capacity to wildfire smoke:
outdoor workers, individuals experiencing homelessness, low-income households, renters,
African Americans, Latinos, and households that lack vehicle access (Stone et al. 2019). Smokers
may also fail to take protective measures, and may therefore be vulnerable, due to perceptions
that they will not be affected (OPR 2017b).
Rappold et al. (2017) developed the Community Health-Vulnerability Index (CHVI) to measure
vulnerability to wildfire smoke at a national level. The underlying health data for the index are
not publicly available, but the structure of the index provides a useful starting point for the
Council to understand vulnerability to wildfire smoke within the Delta. Given the close
relationship between vulnerability to wildfire smoke, and vulnerability to air pollution (fine
1-12 May 2021DELTA STEWARDSHIP COUNCIL
A California State Agency
particulate matter, in particular) other tools that were developed to focus on air pollution can
help supplement information on social vulnerability to this climate change hazard (CDPH 2019a,
OEHHA 2017).
1.4 Existing Data and Studies
1.4.1 Existing Vulnerability Indices
A multitude of existing vulnerability indices are available, and potentially useful as screening
tools or data sources for identifying the most vulnerable populations with respect to climate
change in the Delta (Raval et al. 2019). Of these, Council staff identified and evaluated eight
indices with publicly available data for applicability to Delta Adapts, drawing primarily from state
guidance (OPR 2018, OPR 2017a). Table 1 summarizes and compares the main characteristics of
each index. Detailed descriptions of each index are provided below.
Table 1. Index Characteristics
Index Spatial Resolution Indicators Domains
(4) pollution exposure, environmental effects,
CalEnviroScreen Census tract 20
sensitivity, socioeconomics
City, county,
CHAT / HHAI 16 (1) heat / (3) social, health, environmental
census tract
County, census (3) climate change exposure, sensitivity,
CCHVIz 21
tract adaptive capacity
DAC Mapping Census place,
1 (1) income
Tool tract, block group
City, county, zip
DCI 7 (1) economic distress
code
(8) economics, education, healthcare,
HPI Census tract 25 housing, social, neighborhood conditions,
environment, transportation
County, zip code, (6) education, economic, housing,
ROI 33
census place, tract transportation, health, civic life
County, census (8) wealth, race, age, health insurance, special
SoVI 29
tract, block group needs, employment, gender
May 2021 1-13Delta Adapts: Equity Technical Memorandum
Chapter 1. Background
1.4.1.1 CalEnviroScreen
Available at: https://oehha.ca.gov/calenviroscreen
The California Communities Environmental Health Screening Tool (CalEnviroScreen) was
developed by the Office of Environmental and Health Hazard Assessment (OEHHA) for CalEPA to
guide public investments and policy decisions to benefit communities that are most burdened by
environmental contamination and pollution (OEHHA 2017). State agencies are encouraged to
use CalEnviroScreen to comply with EO B-30-15 (OPR 2017a). In addition, local agencies are
encouraged to use CalEnviroScreen to comply with SB 1000 (OEHHA 2017, OPR 2018). The index
was vetted through a public process and is in its third iteration (Version 3.0).
The index is calculated from 20 different indicators across four domains: exposure,
environmental effects, sensitivity, and socioeconomic factors. Indicators were selected to
represent widespread concerns related to pollution in California, based on data sources available
for the entire state (OEHHA 2017). Pollution burden indicators were selected to relate to issues
that may be potentially actionable by CalEPA boards and departments (OEHHA 2017). For each
indicator, OEHHA provides a literature review summarizing its relevance to health, and a
summary of data sources, methods, and limitations. Each indicator is normalized across all
census tracts in the state.
OEHHA developed a weighting scheme for the index based on scientific evidence of the relative
contribution of each domain to environmental justice (OEHHA 2017). The exposure and
environmental effects domains are averaged to calculate a pollution burden score, with the
exposure score weighted twice that of environmental effects. The sensitive population and
socioeconomic domains are averaged to calculate a population characteristics score. Finally, the
pollution burden and population characteristic scores are multiplied. OEHHA (2017) documents
several reasons for this weighting scheme, including evidence in the scientific literature of effect
modifiers that multiply the effects of pollution burden by 3 to 10 times; and based on
established risk assessment and scoring methods.
Data are publicly available for download as shapefiles (for use in geographic information systems
[GIS]) or tabular/spreadsheet formats for both the overall index scores and for individual
indicators. OPR (2018) and Seim (2019) identify and recommend specific indicators from
CalEnviroScreen for use in local general plans and Delta Adapts, respectively.
Census tracts with scores in the top quartile statewide are eligible to benefit from an earmarked
share of Greenhouse Gas Reduction Funds (GGRF) under AB 1550, which requires that 25
percent of funds be allocated for projects located in and benefitting disadvantaged communities
as identified by CalEPA (Health & Saf. Code §39711[a]). Tracts in the Delta with scores in the top
quartile are concentrated in the South Delta, particularly in Stockton, Lathrop, Manteca, and
Tracy (Appendix B, Figure B-1). Tracts in portions of Pittsburg, Antioch, Oakley, Sacramento, and
West Sacramento also fall within the top quintile.
SB 1000 uses the same definition of disadvantaged communities as AB 1550 (Gov. Code
§65302[h]). Thus, using CalEnviroScreen to identify focal communities for Delta Adapts would
align with both local government planning needs and potential funding sources.
1-14 May 2021DELTA STEWARDSHIP COUNCIL
A California State Agency
1.4.1.2 California Heat Assessment Tool
Available at: https://www.cal-heat.org
The California Heat Assessment Tool (CHAT) was developed for California’s 4th Climate Change
Assessment on behalf of the California Natural Resources Agency, to provide information about
vulnerability to extreme heat events (CEC 2020).
Various dimensions of extreme heat events, including absolute and relative maximum and
minimum daily temperatures, and duration, all contribute to health impacts. CHAT is based on
the combination of these dimensions that has the greatest statistical relationship to local
increases in emergency room visits. The statistical relationship is then used to forecast future
Heat Health Events (HHEs) using an ensemble of downscaled climate change projections and
models (Steinberg et al. 2018). CHAT defines HHEs as “any event that results in negative public
health impacts, regardless of the absolute temperature” (CEC 2020).
CHAT provides an online interface in which users can view the annual number of projected HHEs,
and the individual dimensions of extreme heat events, at a census tract level. Users can also
download projections in tabular format.
CHAT also developed and published a Heat-Health Action Index (HHAI) that identifies social
vulnerability to extreme heat. The index is calculated from 16 different indicators across three
domains: social (including indicators such as poverty, linguistic isolation, and educational
attainment); health (e.g. asthma rates, low birth weight infants); and environmental (e.g.
impervious cover and tree canopy). Indicators were identified from the California Building
Resilience Against Climate Effects (CalBRACE) program (which developed CCHVIz, discussed in
the next section) and from CalEnviroScreen. Transit-access and urban heat island effects were
identified as contributing factors but omitted from the index because available data only covered
urban areas (Steinberg et al. 2018).
A principal components analysis was used to group indicators into domains and to determine
each domain’s contribution to variation in heat vulnerability. The domain weights were then
used to calculate a social vulnerability score for each census tract, with final scores scaled from 1
to 100. Data sources and methods are summarized in Steinberg et al. (2018).
Based on CHAT, the Delta is projected to experience a moderate number of HHEs compared to
other parts of California. However, the HHAI identifies four census tracts in Stockton 5 and one
tract in West Sacramento as highly socially vulnerable to heat (CEC 2020) (Figure B-2).
1.4.1.3 Climate Change & Health Vulnerability Indicators
Available at: https://discovery.cdph.ca.gov/ohe/CCHVIz
Climate Change & Health Vulnerability Indicators (CCHVIz) is a data visualization tool developed
by the California Building Resilience Against Climate Effects (CalBRACE) program. CalBRACE is a
5
Based on the HHAI, Census tract number 6077000100 in Stockton has the highest social vulnerability to heat in
the state, with a score of 100.
May 2021 1-15Delta Adapts: Equity Technical Memorandum
Chapter 1. Background
project of the California Department of Public Health (CDPH) that provides resources and
technical assistance on climate adaptation to public health departments in California (CDPH
2019a). CCHVIz was developed to help state and local agencies plan to meet the needs of the
communities most at risk of harm from climate change (CDPH 2019b). In addition, OPR
recommends CCHVIz as a resource for complying with SB 1000 (OPR 2018).
CCHVIz is based on the concept that overall community vulnerability to a particular climate
change hazard is a function of exposure, sensitivity, and adaptive capacity, which aligns with the
definition of vulnerable communities in OPR guidance (2018). CCHVIz consists of a set of 21
indicators that represent exposure, sensitivity, and adaptive capacity to one or more climate
change hazards. For each indicator, CDPH provides a literature review summarizing its relevance
to health, and a summary of data sources, methods, and limitations.
The “Vulnerability” visualization tool allows users to select an exposure indicator and a sensitivity
or adaptive capacity indicator in order to view the resulting vulnerability at a county level.
However, the tool does not calculate an overall vulnerability score, and does not provide for
visualizing combinations of more than two indicators at a time. Therefore, CCHVIz does not
account for the cumulative effects of multiple sensitivity factors and cannot be used on its own
to screen for the most vulnerable populations.
CCHVIz may be more useful to the Council as a source of individual indicator data, rather than as
an index. The “Single Indicator” tool allows users to select an indicator and visualize or download
the scores at a census tract level relative to all tracts in the state. The six exposure indicators
include projected extreme heat days, ozone concentration, particulate matter concentration,
drought, projected sea level rise, and wildfire. There are 11 sensitivity indicators and four
adaptive capacity indicators. OPR (2018) and Seim (2019) identify and recommend specific
indicators from CCHVIz for use in local general plans and Delta Adapts, respectively.
1.4.1.4 Disadvantaged Communities Mapping Tool
Available at: https://gis.water.ca.gov/app/dacs
The California Department of Water Resources (DWR) developed the Disadvantaged
Communities (DAC) Mapping Tool to help screen communities in California for Proposition 1
Integrated Regional Water Management (IRWM) funding. The tool is also intended as a resource
for local governments to fulfill their responsibilities related to the California Water Plan and the
Sustainable Groundwater Management Act (SGMA) (DWR 2019).
The DAC Mapping Tool is based on a definition of disadvantaged community that differs
markedly from that used to develop CalEnviroScreen and to comply with SB 1000. For the
purposes of the DAC Mapping Tool, “‘Disadvantaged Community’ means a community with a
median household income less than 80 percent of the statewide average” (Pub. Resources Code
§75005[g]). This is the same definition as that of a low-income community in the Health and
Safety Code (§39713[d][2]). Under AB 1550, five percent of GGRF must be allocated to projects
located within, and benefiting individuals living in these low-income communities. Thus, using
the DAC Mapping Tool to identify focal communities for Delta Adapts would align with projects
1-16 May 2021DELTA STEWARDSHIP COUNCIL
A California State Agency
that were awarded Prop 1 IRWM or GGRF funding, as well as with potential future GGRF or other
DWR grant awards.
With only a single indicator, the DAC Mapping Tool does not account for the cumulative effects
of multiple sources of disadvantage or vulnerability. Communities are identified as either above
or below the 80 percent median household income threshold ($51,026 for the 2012-2016 ACS 5-
year average). The index and threshold were developed by legislation, not through a scientific,
peer-reviewed process. However, other analyses have found this indicator to be a strong
predictor of environmental health outcomes (Delany et al. 2018).
Based on the 2016 tool, disadvantaged communities are distributed throughout the Delta and
Suisun Marsh, suggesting that the Delta has many economically disadvantaged communities
relative to the state as a whole. Tracts in Stockton, Pittsburg, Antioch, Fairfield/Suisun Marsh,
West Sacramento, Sacramento, and Tracy are identified – as well as tracts in the unincorporated
areas of Sacramento and San Joaquin Counties (Figure B-3).
1.4.1.5 Distressed Communities Index
Available at: https://eig.org/dci
The Distressed Communities Index (DCI) was identified for evaluation because it was referenced
in public comments submitted to the Council by Restore the Delta and the Environmental Justice
Coalition for Water with regard to environmental justice (Restore the Delta and EJCW 2017).
The Economic Innovation Group (EIG) created the Distressed Communities Index (DCI) to
measure place-based economic opportunity before and after the Great Recession, and to
understand how the distribution of opportunity in the U.S. has changed over time. EIG is a think-
tank that conducts economic research and advocates for public policy to reduce economic
inequality, create jobs, and encourage entrepreneurship. The EIG highlights the U.S. Treasury
Department’s Opportunity Zones program as a good example of public incentives for private
investment in distressed areas (EIG 2019). However, the DCI itself does not appear to be the
basis for any existing funding or investment programs. Therefore, using this index for Delta
Adapts would not have the benefit of aligning with state and local programs.
This is the only index evaluated that consider the direction of change over time. The index is
calculated from seven socioeconomic indicators including educational level, housing vacancy,
adults not working, poverty, area median income as a percentage of state median income,
change in employment, and change in the number of business establishments. Scores for each
indicator are ranked, normalized, and averaged to calculate the overall DCI score. Indicators are
weighted equally in the overall score. Scores are calculated at the scale of cities, counties,
congressional districts, and zip code tabulation areas. The DCI defines the most distressed areas
as those with the highest 10 percent of distress scores. Notably, Stockton is ranked among the
top 10 most distressed cities in the Unites States (EIG 2016, p 26).
Data are not available for download but can be viewed through a variety of interactive maps. The
“U.S. Zip Codes by State” visualization tool allows users to select a state in order to view the DCI
scores at the zip code level and its rank relative to all zip codes in the state. The EIG does not
May 2021 1-17Delta Adapts: Equity Technical Memorandum
Chapter 1. Background
provide a scientific justification for the selection of indicators or the equal-weighting scheme,
and does not appear to be peer reviewed, but a summary of the methodology is publicly
available (EIG 2016).
1.4.1.6 Healthy Places Index
Available at: https://healthyplacesindex.org
The California Healthy Places Index (HPI) was developed by the Public Health Alliance of
Southern California in partnership with Virginia Commonwealth University’s Center on Society
and Health. The purpose of the index is to target California Department of Public Health (CDPH)
projects and resources to areas with the greatest cumulative extent of deprivation (Delany et al.
2018). State agencies are encouraged to use HPI to comply with EO B-30-15 (OPR 2017a). In
addition, local governments are encouraged to use HPI to implement SB 1000 guidance in their
general plans (OPR 2018). Thus, using HPI to identify focal communities for Delta Adapts would
align with local government planning needs.
The index is comprised of 25 indicators that fall within eight thematic domains: economics,
education, healthcare, housing, social, neighborhood conditions, environment, and
transportation. Indicators were selected based on their relationship to public health and health
outcomes, as identified in the scientific literature, then screened for a statistically significant
correlation to life expectancy at birth, prior to inclusion in the index. Data sources and methods
are summarized. Each indicator is normalized across all census tracts in the state.
Thematic domain scores are calculated as the arithmetic average of the z-scores of individual
indicators. The index weights domain scores based on their statistical contribution to life
expectancy. The economic domain is weighted most heavily (32 percent); the healthcare,
housing, and environment domains were each assigned the minimum weight (5 percent) (Delany
et al. 2018). Tracts in the bottom quartile are identified as the most disadvantaged, or those with
the least opportunity to improve their health conditions (Delaney et al. 2018). Tracts with scores
in the bottom quartile are located at the edges of the Delta and Suisun Marsh, including portions
of Fairfield/Suisun Marsh, Pittsburg, Stockton, Sacramento, and West Sacramento (Figure B-4).
HPI data are publicly available for download in GIS or tabular/spreadsheet formats for both the
overall index scores and for individual indicators. OPR (2018) and Seim (2019) identify and
recommend specific indicators from HPI for use in local general plans and Delta Adapts,
respectively.
A Steering Committee of 20 public health practitioners and researchers advised on the
development of the index, and a Communications Committee comprised of community
organizations, researchers, and staff advised on reframing the index through an asset-based lens
and increasing the accessibility and transparency of the inputs. The index was updated in 2017 to
include more recent data and incorporate new methods to predict health outcomes (Delany et
al. 2018). The index is in its second iteration (Version 2.0).
1-18 May 2021You can also read