DELTA VARIANT INTERRUPTS RECOVERY - U.S. Economic Outlook SEPTEMBER 2021 - Morning Consult
←
→
Page content transcription
If your browser does not render page correctly, please read the page content below

DELTA VARIANT
INTERRUPTS
RECOVERY
U.S. Economic Outlook

 SEPTEMBER 2021

                  Copyright © 2021 Morning Consult. All Rights Reserved.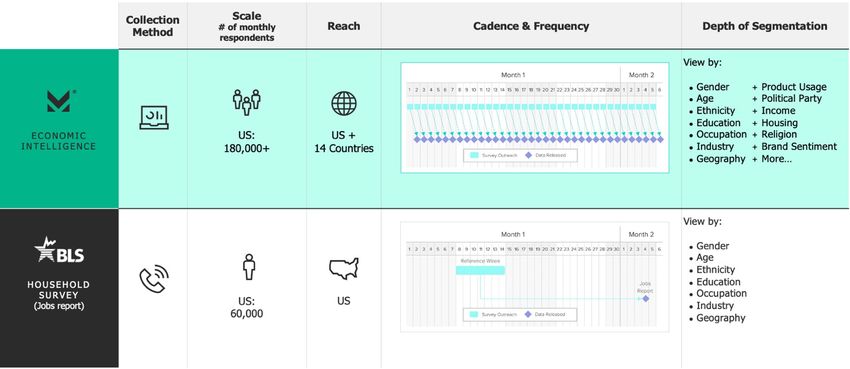
ABOUT THIS REPORT

Morning Consult’s monthly U.S Economic Outlook report
provides an integrated assessment of the strength of U.S.
consumers, workers and households.

Businesses and investors rely on this report to understand
emerging trends in consumer demand, employment and
personal finances.

The report draws on Morning Consult Economic Intelligence,
a high-frequency, global economic dataset, reflecting over 11,000
daily economic surveys across the 15 largest global economies.

                                                                    2
TABLE OF CONTENTS

U.S. Economic Outlook: September 2021             4

Consumer Confidence                               7

Employment                                       16

Spending and Spending Intentions                 27

Price Expectations                               36

Personal Finances, Consumer Credit and Housing   40

Methodology                                      52

                                                      3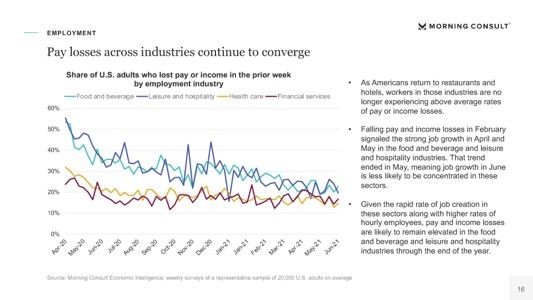
D E L T A V A R I A N T I N T E R R U P T S R E C OV E R Y : U . S . E C ON OMI C OU T L OOK

U.S. ECONOMIC OUTLOOK:
     SEPTEMBER 2021
SUMMARY

In August, a resurgent pandemic further undermined the U.S. economic recovery, as the Delta variant drove cases and
hospitalizations up to levels not seen since January. Consumer sentiment fell sharply as hopes of nearing an end to the
pandemic were dashed. While layoffs and unemployment remained stable in August, real consumer spending likely fell
for the second consecutive month. Should lagging confidence derail the anticipated switch from consumer goods to
service sector spending this fall, rosy forecasts for second half U.S. real GDP will likely need to be downwardly revised.

        Consumer confidence and spending: Morning Consult’s Index of Consumer Sentiment has fallen sharply since the beginning of
  1     July and is now at its lowest level since February 2021, as the 7-day moving average of new COVID cases reaches levels not seen
        since winter. Retail sales likely contracted in August for the second consecutive month, but emerging trends in the data indicate that
        spending will turn the corner in September. The U.S. wasn't alone in terms of deteriorating confidence. Large exporting economies like
        Brazil and Germany experienced the two largest decreases in confidence in August, draining momentum from the global recovery.

        Employment: The increase in COVID-19 cases pushed the U.S. jobs recovery into a holding pattern. Pay and income losses stalled
  2     in August, which is better than Q3 2020 when increasing case counts led to additional layoffs. Morning Consult's unemployment rate
        remained essentially unchanged last month. Looking ahead, employed workers remain relatively optimistic about keeping their jobs
        for the next month, and they grew increasingly open to looking for new positions.

        Personal finances: A growing share of consumers struggled to pay their bills in July leading to a 3-percentage point increase in
  3     missed housing payments. These deferred liabilities are artificially inflating American's savings accounts: Once homeowners and
        renters make their housing payments, their savings will decrease, likely resulting in increased financial vulnerability.

                                                                                                                                                 5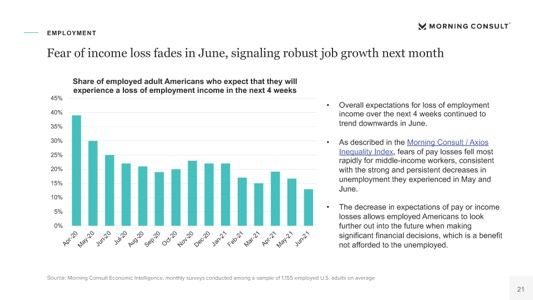
ECONOMIC INDICATORS DASHBOARD

                                   CURRENT PERIOD   PRIOR PERIOD   CHANGE      I M PA C T
Consumer Confidence
ICS                                     91.6            94.1       -2.5 pts   N E G AT I V E

Employment
Lost pay/income                        12.5%           12.1%        0.4%      N E G AT I V E

Unemployment rate                      14.1%           14.0%        0.1%      N E G AT I V E

Labor force participation rate         53.6%           53.9%        -0.3%     N E G AT I V E

Employment to population ratio         46.0%           46.3%        -0.3%     N E G AT I V E

Personal Finances
Fell short of paying bills             16.5%           13.7%        2.4%      N E G AT I V E
Financial vulnerability (unable
to pay basic expenses for a full       21.4%           21.9%        -0.5%     POSITIVE
month using just savings)

                                                                                               6
D E L T A V A R I A N T I N T E R R U P T S R E C OV E R Y : U . S . E C ON OMI C OU T L OOK

CONSUMER CONFIDENCE
C ON S U ME R C ON F I D E N C E
Consumer confidence falls further in August
Morning Consult Daily U.S. Index of Consumer Sentiment
120
March 11, 2020: Dec. 27, 2020: Jan. 20, 2021:
115 WHO declares President Trump signs President
COVID-19 a pandemic second coronavirus Joe Biden’s July 7, 2021:
relief package into law inauguration Consumer
110 confidence begins to
March 13, 2020:
March 9, White House declares national fall amid COVID
105 2020: surge
emergency over coronavirus pandemic
Dow Jones
100 Industrial Nov. 3, 2020:
Average sees March 27, 2020: Election day
95 its worst drop President Donald Trump signs
since 2008 CARES Act into law
90
85
March 6, 2021:
80 Senate passes
Sept. 15, 2020: $1.9 trillion
75 Average daily COVID-19 economic relief bill
cases begin rising again
70
0
1
0
0
1
1
0
0
20
20
1
0
0
1
0
0
1
1
0
1
-2
-2
-2
-2
-2
-2
-2
-2
-2
l-2
l-2
2
2
2
2
2
2
2
n-
n-
n-
n-
g-
p-
-
-
g-
r
r
ar
ar
ay
ay
b
b
ct
ov
ec
Ju
Ju
Ap
Ap
Ja
Ju
Ja
Ju
Au
Se
Au
Fe
Fe
O
M
M
N
D
M
M
Source: Morning Consult Economic Intelligence
8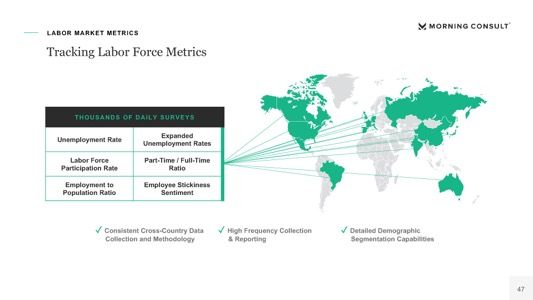
C ON S U ME R C ON F I D E N C E
Delta variant surge continues to drive decline in sentiment
• Morning Consult’s Index of Consumer Sentiment
New cases, 7-day moving average (LHS) ICS, 5-day average (RHS) (ICS) continued to fall in August as the Delta variant
surge saps confidence across the U.S.
300,000 105
• The index has fallen sharply since the beginning of
250,000 100 July and is now at its lowest level since February
2021, as the 7-day moving average of new COVID
200,000 95 cases reaches levels not seen since winter.
150,000 90 • Amid the surge, U.S. adults are increasingly
unwillingly to take part in many activities that could
put them at risk. According to an Aug 19-22 survey,
100,000 85
62% of adults said they were comfortable dining in a
restaurant, down from 71% at the beginning of July.
50,000 80
• With optimistic economic projections dependent on
0 75 consumption shifting from goods to services this fall,
plummeting sentiment will likely lead to downward
1
1
1
0
0
20
20
1
0
1
1
1
1
-2
-2
-2
-2
-2
l-2
2
2
2
2
2
n-
n-
g-
p-
-
-
g-
r
ar
ay
b
ct
ov
ec
Ju
revisions to real U.S. GDP forecasts.
Ap
Ja
Ju
Au
Se
Au
Fe
O
M
N
D
M
Source: Morning Consult Economic Intelligence, Our World in Data, Johns Hopkins University CSSE COVID-19 Data
9
C ON S U ME R C ON F I D E N C E

Consumers most worried about future business conditions and inflation
• The recent decline in consumer sentiment has                         Change in ICS and each of its components (July 1-Aug 23)
  primarily been driven by a deterioration in views
  toward future business conditions.                         Business              Business                         Personal      Personal
                                                           Conditions: 12         Conditions: 5                    Finances:    Finances: 12
                                                              Month                  Year       Current Buying      Current        Month
• Since the beginning of July, 12-month expectations       Expectations           Expectations   Conditions        Conditions   Expectations
  for future business conditions have fallen 12.7%,
  while 5-year expectations have fallen 11.5%. This
  compares to only 5.6% and 4.9% for current and
  12-month expectations for personal finances.
                                                                                                                                  -4.9%
                                                                                                                    -5.6%
• This disparity suggests that pessimism is still being                                                    -6.7%
  driven more by outward fears, rather than negative
  impacts to household balance sheets.

• Consumers are also worried about rising prices,
                                                                                     -11.5%
  with views toward current buying conditions falling
                                                               -12.7%
  6.7% over the last two months. However, the bulk
  of this decline occurred in July, indicating inflation
  fears moderated in August.

                                                           Source: Morning Consult Economic Intelligence
                                                                                                                                               10
C ON S U ME R C ON F I D E N C E
Sentiment stabilizing somewhat among highest earners
• As of Aug. 23, sentiment among the highest
Morning Consult U.S. Index of Consumer Sentiment
income segment – households earning above
By annual household income
$100,000 – has stabilized as the stock market
Rolling 30-day % change
hit record highs. This group is also typically
Adults Less than $50,000 $50,000 - $100,000 Over $100,000 somewhat shielded from high rates of wage
15% income loss.
10%
5% • Despite this respite among high income adults,
consumer sentiment continues to fall overall,
0%
with the last reading for the 30-day change for
-5%
all adults still at -3.9% as of August 23.
-10% Sentiment among those earning less than
-15% $50,000 had the worst 30-day decline at 4.6%.
-20%
-25% • Cooling sentiment likely weighed further on
-30% spending in August, following a 0.14%
contraction in real personal consumption
-35%
expenditures in July. Changes in Morning
Fe 0
20
Fe 1
21
Ju 0
Ju 1
Au 0
Au 1
M 0
N 0
M 1
M 0
Ap 0
M 1
Ap 1
Se 0
20
D 0
Ja 0
21
l-2
l-2
2
-2
2
2
-2
2
-2
2
-2
-2
2
2
-2
-2
Consult’s ICS remain highly correlated with
g-
p-
g-
n-
n-
n-
n-
r-
r-
b-
b-
ov
ec
ct
ay
ay
ar
ar
Ju
Ju
Ja
O
changes in real consumer spending.
Source: Morning Consult Economic Intelligence
11C ON S U ME R C ON F I D E N C E
Consumers’ views of their finances deteriorate across the country
Morning Consult Personal Finances: Current Conditions Index
% change since Jan 2020
-30% -20% -10% 0% 10%
FEBRUARY 2020 APRIL 2020 OCTOBER 2020
JANUARY 2021 MAY 2021 AUGUST 2021
Source: Morning Consult Economic Intelligence. *August 2021 data reflects the 30-day rolling average from July 27 to August 25, 2021.
12C ON S U ME R C ON F I D E N C E
Drop in U.S. sentiment ranks 4th among major economies in August
Morning Consult Index of Consumer Sentiment
Monthly % change
• Among the 15 largest global economies, the
U.S. decline in consumer sentiment in August
was the fourth largest.
• Brazil, Germany, and Australia all saw worse
outcomes than the U.S. in August, with each
economy struggling with COVID-19
resurgences of their own.
• India saw the greatest increase in sentiment,
where an improving public health situation
saw sentiment rise 6.1%. Russia, the U.K.,
and Spain followed India, which saw
sentiment rise 3.3%, 2.8%, and 1.7%,
respectively, in August.
Source: Morning Consult Economic Intelligence, data for August reflects August 1-25, 2021.
13C ON S U ME R C ON F I D E N C E
Vaccines provide key ingredient of consumer recovery
% Change in ICS from Jan 1 to Aug 25, 2021, vs. % of population fully vaccinated
• Higher vaccination rates are strongly 30%
positively correlated with an increase in United Kingdom
consumer confidence since the beginning of
% change in ICS from Jan 1 to Aug 10, 2021
25% Italy Spain
2021.
• While a myriad of factors goes into consumer 20%
Correlation
sentiment readings, vaccinations lay the France = 68.9%
South Korea
foundation for improved public health 15%
outcomes, consumer confidence, spending Japan Canada
and economic activity more broadly. Russia China
10%
• Developing economies that lack the same Mexico
access to vaccinations as Western, 5% Germany
developed countries will continue facing India
additional barriers to stimulating their 0% Australia
economies. United States
-5% Brazil
-10%
0% 10% 20% 30% 40% 50% 60% 70% 80%
% of population fully vaccinated
*Size of bubbles reflect 2020 GDP in USD. Source: Morning Consult Economic Intelligence, Our World in Data, World Bank
14C ON S U ME R C ON F I D E N C E
The U.S. and less-vaccinated developing economies lagging in sentiment rebound
Morning Consult Daily Index of Consumer Sentiment, % Change From
Beginning of Pandemic
10% • With the already sluggish
rebound in consumer sentiment
5% France
China dropping off in recent months,
Japan the U.S. now ranks last among
0%
Australia the 15 largest economies
Russia tracked by Morning Consult in
-5% UK terms of confidence relative to
Canada
-10% Mexico pre-COVID levels.
Germany
-15% India • With sentiment 18.9% below
Brazil January 2020 levels in August,
-20% U.S. the U.S. recovery now ranks
below major developing
-25% economies, which lack the same
access to vaccines or fiscal
-30% firepower available in the U.S.
-35%
-40%
9 9 9 0 0 0 0 0 0 0 0 0 0 0 0 0 1 1 1 1 1 1 1 1
t-1 v -1 c -1 n-2 b-2 r-2 r-2 y -2 n-2 l-2 g -2 p -2 t-2 t-2 v -2 c -2 n-2 b-2 r-2 r-2 y -2 n-2 l-2 g -2
O c No De J a Fe Ma Ap Ma J u J u Au Se O c O c No De J a Fe Ma Ap Ma J u J u Au
Source: Morning Consult Economic Intelligence
15D E L T A V A R I A N T I N T E R R U P T S R E C OV E R Y : U . S . E C ON OMI C OU T L OOK
EMPLOYMENTE MP L OY ME N T
Weekly pay losses ticked slightly higher across all income groups in late August
Share of U.S. adults who lost pay or income in the prior week
• While the Delta variant drove a decrease in U.S. By annual household income
confidence, it has yet to drive a significant increase
in pay or income losses. For the week ending Aug. Adults Less than $50,000 $50,000 - $100,000 Over $100,000
21, 12.5% of U.S. adults reported a loss in pay or 30%
income, close to the same level observed over the
past several months. 25%
• Unlike the second wave of COVID-19 cases from
Oct. – Dec. 2020, the most recent increase in 20%
cases has not disproportionately affected low-
income workers, indicating that recent employment 15%
gains by low-income workers are more resilient to
increases in cases. 10%
• Given the number of workers forced to find
jobs with new employers or in new industries, 5%
elevated levels of pay and income losses are likely
to persist for longer than they would typically. 0%
Au 0
Au 1
Ju 0
Ja 1
Fe 1
Ju 1
Se 0
O 0
D 0
Ja 0
21
M 20
N 20
M 21
M 1
Ap 1
Ju 0
Ju 1
2
-2
-2
-2
l-2
l-2
2
2
2
2
2
2
-2
-2
r-
-
r-
b-
n-
n-
n-
n-
g-
p-
g-
ar
ay
ay
ct
ov
ec
Ap
Source: Morning Consult Economic Intelligence; weekly surveys of a representative sample of 20,000 U.S. adults on average
17E MP L OY ME N T
Despite rising cases, weekly lost pay for hospitality jobs remains stable so far
Share of U.S. adults who lost pay or income in the prior week
By employment industry • The share of restaurant and hotel
workers reporting lost pay has stabilized
Food and beverage Leisure and hospitality Health care Financial services
at a level only slightly above the share of
60% workers in sectors less-impacted by the
pandemic.
50%
• The food and beverage and leisure and
hospitality industries tend to experience
40% higher worker turnover even without the
added impact of COVID-19, so pay
30% losses are likely to remain elevated
through the end of the year, especially
given the rapid rate of job creation in
20%
these sectors.
10% • The spread of the Delta variant over the
past several weeks has not yet resulted
0% in a sizable uptick in job losses, as was
seen during earlier case surges—though
Au 0
Au 1
20
21
21
21
Se 0
20
D 0
0
21
0
1
0
N 0
M 1
21
1
-2
-2
-2
r-2
-2
-2 this may change if rising cases lead to
l-2
l-2
2
-2
-2
b-
n-
n-
n-
n-
g-
p-
g-
ay
ay
r
ar
ct
ov
ec
Ju
Ju
Ap
Ap
Ju
Ja
Ja
Ju
Fe
O
dwindled demand and business
M
M
restrictions.
Source: Morning Consult Economic Intelligence; weekly surveys of a representative sample of 20,000 U.S. adults on average
18E MP L OY ME N T
Hispanic adults reported a sharp increase in income losses in late August
Share of U.S. adults who lost pay or income in the prior week
By ethnicity • Minority workers reported a sharp
increase in income losses in late
Black Hispanic Other White
August, with 19% of Hispanic adults
40% and 16% of Black adults reporting lost
pay or income. For both groups, these
35% increases represented the highest level
of pay losses since since May.
30%
25% • Pay losses among white workers
remained relatively low, though the rate
20% of decline has slowed compared with
earlier in the year.
15%
• For many minority workers employed in
10% services industries, the continuing
impact of COVID-19 and the spread of
5%
the Delta variant are likely to slow
0% recovery and keep pay losses elevated
for these groups.
Au 0
Au 1
20
21
21
21
Se 0
20
D 0
0
21
0
1
0
N 0
M 1
21
1
-2
-2
-2
r-2
-2
-2
l-2
l-2
2
-2
-2
b-
n-
n-
n-
n-
g-
p-
g-
ay
ay
r
ar
ct
ov
ec
Ju
Ju
Ap
Ap
Ju
Ja
Ja
Ju
Fe
O
M
M
Source: Morning Consult Economic Intelligence; weekly surveys of a representative sample of 20,000 U.S. adults on average
19E MP L OY ME N T
Unemployment creeps higher in August
U.S. (4-week moving average)
Note differences in scales
Unemployment Rate Employment to Population Ratio Labor Force Participation Rate
18% 48% 56%
47%
16% 55%
46%
14% 54%
45%
12% 44% 53%
1 0/3 0
1 0/2 2 0
1 2/2 2 0
/2 1
/2 1
4 /1 0 1
/2 1
/2 1
/2 1
8 /1 4 1
/2 1
1 0/3 0
1 0/2 2 0
1 2/2 2 0
/2 1
/2 1
4 /1 0 1
/2 1
/2 1
/2 1
/2 1
/2 1
2 /2 7 1
5 /2 2 1
7 /2 4 1
4 /20
1 2/5 0
6 /20
4 /20
1 2/5 0
6 /20
2 /2 7 1
5 /2 2 1
7 /2 4 1
1 0/3 0
1 0/2 2 0
1 2/2 2 0
/2 1
3 /2 0 1
4 /1 0 1
/2 1
6 /1 2 1
/2 1
/2 1
/2 1
2 /2 7 1
5 /2 2 1
7 /2 4 1
4 /20
1 2/5 0
6 /20
2
2
2
4 /2
4 /2
2
2
2
/2
/2
/2
/2
/2
2
2
2
4 /2
/2
/2
/2
/2
2 /6 /
5 /1 /
7 /3 /
2 /6 /
5 /1 /
7 /3 /
/
/
/
/
2 /6 /
5 /1 /
7 /3 /
/
/
9 /1 2
1 /1 6
3 /2 0
6 /1 2
9 /1 2
1 /1 6
3 /2 0
6 /1 2
8 /1 4
9 /1 2
1 /1 6
8 /1 4
1 1/1
1 1/1
1 1/1
• Labor force participation fell again, hitting a new series low in August, while unemployment ticked higher to 14.1%. Fewer adults were
willing and able to work in August, and a smaller share of the shrinking labor force had a job last month. The combination of these two factors
drove down the employment-to-population ratio to 46.0%, wiping away the gains accumulated so far this year.
• Seasonal factors, workforce decline worsen unemployment outlook. The BLS typically applies a slight negative adjustment to the
unemployment rate in August, diminishing the likelihood of seasonal effects contributing to the June-August upward trend in joblessness.
Furthermore, the late-August decline in unemployment was driven by labor force exits, not job creation.
Source: Morning Consult Economic Intelligence
20E MP L OY ME N T
Unemployment dropped for higher earners in August, stagnated for those earning
under $100,000
U.S. unemployment rate by annual household income (4-week moving average)
Note differences in scales
Under $50,000 $50,000 - $100,000 Over $100,000
26% 10% 7%
24%
9% 6%
22%
8% 5%
20%
18% 7% 4%
1 0/3 0
1 0/2 2 0
1 2/2 2 0
/2 1
3 /2 0 1
4 /1 0 1
/2 1
6 /1 2 1
/2 1
/2 1
/2 1
2 /2 7 1
5 /2 2 1
7 /2 4 1
4 /20
1 2/5 0
6 /20
1 0/3 0
1 0/2 2 0
1 2/2 2 0
/2 1
/2 1
4 /1 0 1
/2 1
/2 1
/2 1
8 /1 4 1
/2 1
4 /20
1 2/5 0
6 /20
2 /2 7 1
5 /2 2 1
7 /2 4 1
2
2
2
4 /2
/2
/2
/2
/2
1 0/3 0
1 0/2 2 0
1 2/2 2 0
/2 1
/2 1
4 /1 0 1
/2 1
/2 1
/2 1
/2 1
/2 1
2 /2 7 1
5 /2 2 1
7 /2 4 1
4 /20
1 2/5 0
6 /20
4 /2
2
2
2
/2
/2
/2
2 /6 /
5 /1 /
7 /3 /
2
2
2
/
/
4 /2
/2
/2
2 /6 /
5 /1 /
7 /3 /
/
/
9 /1 2
1 /1 6
8 /1 4
9 /1 2
1 /1 6
3 /2 0
6 /1 2
2 /6 /
5 /1 /
7 /3 /
/
/
1 1/1
9 /1 2
1 /1 6
3 /2 0
6 /1 2
8 /1 4
1 1/1
1 1/1
• Unemployment remained elevated for those earning less than $100,000 per year
• Joblessness for high-income earners (i.e., annual incomes over $100,000) fell slightly to 4.2%, tying the lowest level since April
Source: Morning Consult Economic Intelligence
21E MP L OY ME N T
Fewer part-time workers want to find full-time jobs
Even if none are exactly correct, what is the main reason
Would you like to work more than 35 hours per week?
why you do not want to work more than 35 hours per week?
Yes Don't Know No
100%
90%
8%
9%
80% 30%
70%
60% 16%
50%
40%
17% 19%
30%
20%
Family/personal obligations
10% Other
0% Health/medical limitations
Retired/Social Security limit on earnings
20
Fe 1
21
M 1
1
0
1
Au 0
Au 1
M 0
N 0
M 1
Se 0
20
D 0
0
21
School/training
2
-2
l-2
l-2
2
-2
2
2
-2
-2
2
-2
-2
g-
p-
g-
n-
n-
n-
b-
r-
r-
ov
ec
ct
ar
ay
ay
Ju
Ju
Ap
Ap
Ju
Ja
Ju
Child care obligations
O
• In August, 46% of U.S. adults that worked fewer than 35 hours per week said they would like to work more hours,
down from 60% in April 2020 and 57% as recently as in January of this year.
• Family or personal reasons other than child care was the most frequently cited reason for not wanting to work more
hours (30%); followed by ”other” reasons and health or medical limitations.
Source: Morning Consult Economic Intelligence; monthly surveys of an average of 566 U.S. adults that worked fewer than
35 hours per week, and 218 who did not want to work more than 35 hours per week in August 22E MP L OY ME N T
Hispanic unemployment increased in August, even as labor force participation fell
U.S. unemployment rates by race or ethnicity U.S. labor force participation by race or ethnicity
(4-week moving average) (4-week moving average)
Black Hispanic Other race or ethnicity White Black Hispanic Other race or ethnicity White
24% 72%
22% 68%
20%
64%
18%
60%
16%
56%
14%
12% 52%
10% 48%
21
21
21
21
21
21
4/20
4/20
6/20
4/20
4/20
6/20
/ 20
/ 20
/ 20
/ 21
/ 21
/ 21
/ 21
/ 21
/ 21
/ 21
/ 21
/ 20
/ 20
/ 20
/ 21
/ 21
/ 21
/ 21
/ 21
/ 21
/ 21
/ 21
2/6/
5/1/
7/3/
2/6/
5/1/
7/3/
9/12
10/ 3
12/ 5
1/16
2/27
3/20
4/10
5/22
6/12
7/24
8/14
9/12
10/ 3
12/ 5
1/16
2/27
3/20
4/10
5/22
6/12
7/24
8/14
10/ 2
11/ 1
12/ 2
10/ 2
11/ 1
12/ 2
• The slight increase in unemployment was largely driven by Hispanic workers; Black and white unemployment remained flat.
• Labor force participation declined for Hispanic adults, remained flat for white adults, and increased slightly among Black adults since July.
Source: Morning Consult Economic Intelligence
23E MP L OY ME N T
Interest in job-switching remains elevated, with active applicants and openness to
new positions both reaching their highest levels of 2021
U.S. workers (4-week moving average)
Note differences in scales
Actively applying for new positions Open to new positions, not applying Not open to new positions
18% 33% 55%
54%
32%
53%
31% 52%
16%
30% 51%
50%
29%
49%
14% 28% 48%
1 0/3 0
1 0/2 2 0
1 2/2 2 0
/2 1
/2 1
4 /1 0 1
/2 1
/2 1
/2 1
/2 1
/2 1
1 0/3 0
1 0/2 2 0
1 2/2 2 0
/2 1
/2 1
4 /1 0 1
/2 1
/2 1
/2 1
8 /1 4 1
/2 1
2 /2 7 1
5 /2 2 1
7 /2 4 1
4 /20
1 2/5 0
6 /20
2 /2 7 1
5 /2 2 1
7 /2 4 1
4 /20
1 2/5 0
6 /20
1 0/3 0
1 0/2 2 0
1 2/2 2 0
/2 1
3 /2 0 1
4 /1 0 1
/2 1
6 /1 2 1
/2 1
/2 1
/2 1
2 /2 7 1
5 /2 2 1
7 /2 4 1
4 /20
1 2/5 0
6 /20
2
2
2
4 /2
2
2
2
4 /2
/2
/2
/2
/2
/2
2
2
2
4 /2
/2
/2
/2
/2
2 /6 /
5 /1 /
7 /3 /
2 /6 /
5 /1 /
7 /3 /
/
/
/
/
2 /6 /
5 /1 /
7 /3 /
/
/
9 /1 2
1 /1 6
3 /2 0
6 /1 2
8 /1 4
9 /1 2
1 /1 6
3 /2 0
6 /1 2
9 /1 2
1 /1 6
8 /1 4
1 1/1
1 1/1
1 1/1
• About 17% of currently employed workers were actively applying for new positions in late July, and an
even higher share of the active workforce (32%) were open to switching roles.
• The number of workers not open to new positions fell to 51% in July, down from 54% in April.
Source: Morning Consult Economic Intelligence
24E MP L OY ME N T
Fear of income loss ticks down in August, hits pandemic series low
Share of employed adult Americans who expect that they will
experience a loss of employment income in the next 4 weeks
30.0%
• Overall expectations for loss of employment
25.0% income over the next 4 weeks remained
stable in August, ticking downwards to a
20.0% new, modestly lower series low.
15.0% • As described in the Morning Consult / Axios
Inequality Index, fears of pay losses
10.0% remained relatively lower compared to last
fall and winter when the last COVID-19
5.0% surge drove fears higher.
0.0%
0
1
0
21
21
20
20
0
0
21
1
0
M 1
21
1
-2
r-2
-2
-2
l-2
l-2
2
-2
-2
b-
n-
n-
n-
g-
p-
g-
ay
ar
ct
ov
ec
Ju
Ju
Ap
Ju
Ja
Ju
Au
Se
Au
Fe
O
M
N
D
Source: Morning Consult Economic Intelligence, monthly surveys conducted among a sample of 1,155 employed U.S. adults on average
25D E L T A V A R I A N T I N T E R R U P T S R E C OV E R Y : U . S . E C ON OMI C OU T L OOK
SPENDING AND SPENDING
INTENTIONSSPENDING
U.S. adults allocated about 36% of monthly household expenditures to housing
in July, and about 14% went towards grocery purchases
Nominal average monthly spending per category in July 2021, all adults
Housing $70 $56
$83
Grocery
$85
Utilities
$90
Cars
$100
Health insurance
$100
Telecom $1,149
Car insurance $103
Total = $3,182
Gas $117
Education
$118 $88 from
Apparel
June
Restaurant $133
Furniture
Healthcare $147
Hotels $154 $433
Airfare $197
Public transportation
Source: Morning Consult Economic Intelligence, monthly surveys conducted among a representative sample of 2,200 U.S. adults. Average spend level estimated as the weighted average
spending level, calculated by multiplying the midpoint for each spending bucket by the share of respondents selecting that respective bucket—then summing all products.
27SPENDING
Housing and vacation spending increased in July, while health
care costs declined
Percent change in spending from June – July 2021, all adults
• Rent and mortgage payments
increased 5.6% on average for
8%
U.S. households in July, driving up 7%
total spending $61 for the month. 6%
• Health insurance and out-of- 4% 4%
3%
pocket medical care spending 2% 2%
declined in July, despite rising 1% 1% 1% 1%
COVID-19 cases and related 0%
hospitalizations over the month. 0% 0%
-1%
• Discretionary categories— -2%
including airfare, hotels,
restaurants, and apparel—all
s
l
l
ry
re
n
e
as
m
s
e
re
t
ng
s
re
n
ho
re
an
tie
ar
el
tio
nc
io
nc
ce
ca
co
it u
rfa
G
si
pa
co
ot
at
increased, a sign that many
ur
C
ra
tili
ra
ta
ou
le
ro
lth
rn
Ai
H
uc
Ap
ta
Al
r
su
U
su
Te
G
po
Fu
H
ea
es
Ed
consumers are taking summer
in
in
ns
H
R
lth
ar
tra
C
ea
vacations despite COVID-19
ic
H
bl
Pu
concerns.
Source: Morning Consult Economic Intelligence, monthly surveys conducted among a representative sample of 2,200 U.S. adults. Average spend level estimated as the weighted average
spending level, calculated by multiplying the midpoint for each spending bucket by the share of respondents selecting that respective bucket—then summing all products.
28SPENDING
U.S. households slightly pared back grocery spending for a
second straight month in July
Monthly spending on groceries, U.S. adults
• Average monthly grocery spending fell in
$460 July, but it remains higher than it was at the
start of the year.
$450
$450
$446 • One reason for lower spending on food to
$440 be consumed at home may be due to U.S.
$437 adults spending less time at home; vacation-
$436
$430 $433 related spending picked up in July,
$428 indicating that many households reallocated
$420 budgets (and made fewer grocery trips) to
$416 account for fewer meals consumed at home.
$410
• While additional restrictions on indoor dining
$400 are likely to harm restaurant spending, they
also have the potential to discourage future
$390 grocery foot traffic.
1/1/21 2/1/21 3/1/21 4/1/21 5/1/21 6/1/21 7/1/21
Source: Morning Consult Economic Intelligence, monthly surveys conducted among a representative sample of 2,200 U.S. adults. Average spend level estimated as the weighted average
spending level, calculated by multiplying the midpoint for each spending bucket by the share of respondents selecting that respective bucket—then summing all products.
29SPENDING
Trips to the grocery store fell steadily since peaking in May, while online
orders for groceries remained stuck at their lowest level of the year
Average monthly visits to grocery stores per adult Average monthly online grocery orders per adult
6.3 2.5
6.2 2.4
6.2
6.1 2.0 2.2 2.1 2.2
6.0 1.9 1.9 1.9
5.9 6.0 1.5
5.8 5.9 5.9
5.8 5.8
5.7 1.0
5.6
5.6
5.5 0.5
5.4
5.3 0.0
1/1/21 2/1/21 3/1/21 4/1/21 5/1/21 6/1/21 7/1/21 1/1/21 2/1/21 3/1/21 4/1/21 5/1/21 6/1/21 7/1/21
US households shopped for groceries less frequently in July as the Delta variant led to increased concern about visiting public places for
some, and while others diverted spending towards restaurants or carry-out.
Source: Morning Consult Economic Intelligence, monthly surveys conducted among a representative sample of 2,200 U.S. adults. Average monthly visits level estimated as the weighted
average visit level, calculated by multiplying the midpoint for each visit bucket by the share of respondents selecting that respective bucket—then summing all products.
30SPENDING
Visits to restaurants and carry-out orders stayed flat from June to July as
comfort with dining out dipped slightly amidst rising COVID-19 case count
Monthly visits to restaurants and share of respondents claiming
to be “very comfortable” with dining out, U.S. adults Monthly carry-out/delivery orders, U.S. adults
Restaurant visits (LHS) Indoor dining (RHS) 3.8
3.5 Outdoor dining (RHS) 60%
3.7
3.0 3.6
3.7
3.1 50%
2.8 2.8 2.8 2.9 3.5
2.5 2.7
40%
3.4
2.0 2.2
3.3 3.4
30%
1.5 3.3 3.3 3.3 3.3
3.2
20%
1.0 3.1 3.2
3.0
0.5 10%
2.9
0.0 0% 2.8
Jan-21 Feb-21 Mar-21 Apr-21 May-21 Jun-21 Jul-21 Jan-21 Feb-21 Mar-21 Apr-21 May-21 Jun-21 Jul-21
• Despite a decline in consumer’s comfort with dining out, U.S. adults did not overwhelmingly substitute carry-out meals for in-person dining
last month; consumers visited restaurants slightly more in July than June and did not change their frequency of to-go orders.
Source: Morning Consult Economic Intelligence, monthly surveys conducted among a representative sample of 2,200 U.S. adults. Average monthly visit level estimated as the weighted
average visit level, calculated by multiplying the midpoint for each visit bucket by the share of respondents selecting that respective bucket—then summing all products.
31SPENDING
Travel plans increased across all income brackets as COVID-19 restrictions
were loosened in late spring of this year
• 47% of adults had vacation plans as of
Share of adults planning to purchase a trip or
vacation in the next 12 months, by income July, only slightly below the peak of
48% a month earlier and up from 38%
Less than $50,000 $50,000-$100,000 More than $100,000 Adults in January, reflecting pent-up demand
90%
created by the lack of travel during the
80% pandemic: Only 22% of adults reported
70% taking trips since July 2020, whereas
nearly half are planning to travel over
60%
the next year.
50%
• Higher-income households are almost
40% twice as likely than those earning less
30% than $50,000 to plan on taking a
vacation; 74% of those earning over
20%
$100,000 had travel plans in July
10% compared with only 38% of households
0% earning less than $50,000.
1/1/21 2/1/21 3/1/21 4/1/21 5/1/21 6/1/21 7/1/21
Source: Morning Consult Economic Intelligence, monthly surveys conducted among a representative sample of 1,000 U.S. adults
32SPENDING
Adults grow less willing to travel domestically in July and August,
foreshadowing future drop in air travel volumes
U.S. adults’ opinion on domestic travel vs. TSA throughput
• The Delta variant and breakthrough
Share of respondents saying they are less likely to travel within the U.S. in the next 6
months due to pandemic (LHS) cases prompted a growing share of
70% TSA throughput (RHS, millions) 2.5 adults in early July to say they’re less
likely to travel within the U.S. in the
60% next six months, reversing a trend since
2
50% early January.
1.5 • Americans' willingness to fly remains a
40%
leading indicator of TSA throughput 2-3
30%
1 weeks into the future, indicating that air
20% travel is likely to continue to fall
0.5 throughout September.
10%
• A decrease in travel should provide
0% 0
0 0 0 0 0 0 0 0 0 1 1 1 1 1 1 1
Americans with additional income to
ar-2 pr-2 ay-2 un-2 ul-2 ug-2 ep-2 ov -2 ec -2 an-2 eb-2 ar-2 pr-2 ay-2 ul-2 ug-2
M A M J J A S N D J F M A M J A spend elsewhere or strengthen their
finances.
Source: Morning Consult Economic Intelligence, monthly surveys conducted among a representative sample of 2,200 U.S. adults; TSA data.
33S P E N D I N G I N T E N T I ON S
Millennials and Gen Z consumers increasingly looking to buy a home
Share of respondents who intend on purchasing a house or apartment in the next 12 months
By generation
Baby Boomers (1946-1964) GenXers (1965-1980) Millennials (1981-1996) GenZers (1997-2012)
50%
45%
40%
35%
30%
25%
20%
15%
10%
5%
0%
Jan-21 Feb-21 Mar-21 Apr-21 May-21 Jun-21 Jul-21
Source: Morning Consult Economic Intelligence, monthly surveys conducted among a representative sample of 1,000 U.S. adults
34D E L T A V A R I A N T I N T E R R U P T S R E C OV E R Y : U . S . E C ON OMI C OU T L OOK PRICE EXPECTATIONS
P R I C E E X P E C T A T I ON S

Fewer consumers expecting price increases for homes and vacations

Percentage point increase from June to July in the share of consumers who said they
     expect prices to rise over the next 12 months in the following categories:                                               • A larger share of consumers
                                                                                                                                expected higher prices in July than
                                                                                                                                June across the majority of spending
  A house or apartment             -2.9%                                                                                        categories tracked by Morning
    Trips and vacations                              -1.6%                                                                      Consult (8 of 11).
  Energy and utility bills                                            -0.3%
                                                                                                                              • However, after months of increases,
    Food and groceries                                                                0.2%                                      several categories saw the share of
   Home improvements                                                                  0.2%                                      consumers expecting price
       Home appliances                                                                     0.6%
                                                                                                                                increases fall in July.

                 Furniture                                                                         1.2%                       • Price expectations fell for homes,
              Electronics                                                                                 1.7%                  vacations and utilities, with the share
          A used vehicle
                                                                                                                                of consumers expecting price
                                                                                                              2.0%
                                                                                                                                increases over the next 12 months in
             Motorcycles                                                                                         2.2%           each of these segments decreasing
           A new vehicle                                                                                           2.4%         2.9%, 1.6% and 0.3%, respectively.

Source: Morning Consult Economic Intelligence, monthly surveys conducted among a representative sample of 1,000 U.S. adults
                                                                                                                                                                          36
P R I C E E X P E C T A T I ON S
Consumer price expectations tracking higher CPI inflation in 2021
Net share of consumers who expect prices to rise over the next 12 months minus
• Despite the modest decline in some categories
share that expect declines, averaged across 11 price categories;
in July, the net share of consumers expecting and CPI inflation, year-over-year
prices to increase in the next 12 months
remains considerably higher compared to the Net share of consumers expecting price increases (LHS) CPI Inflaiton, y-o-y (RHS)
beginning of the year. 45% 6%
40%
• During his Jackson Hole speech, Federal 5%
Reserve Chair Powell reiterated his view that 35%
inflation is likely temporary. He emphasized
30% 4%
inflation was still concentrated in pandemic-hit
sectors and highlighted consumers’ relatively 25%
3%
stable inflation expectations. 20%
• Morning Consult’s data shows that the rate of 15% 2%
growth in price expectations began to slow in 10%
May, supporting Powell’s view that inflation 1%
expectations remain well anchored. 5%
0% 0%
Jan-21 Feb-21 Mar-21 Apr-21 May-21 Jun-21 Jul-21
Source: Morning Consult Economic Intelligence, monthly surveys conducted among a representative sample of 1,000 U.S. adults.
37P R I C E E X P E C T A T I ON S
Conservatives much more likely to be “very concerned” about inflation
• Inflation concerns are prevalent across
political ideologies, but respondents who How concerned are you about inflation (July 2021)? By political ideology
consider themselves conservatives are
more likely to be very concerned about Not concerned at all Not too concerned Somewhat concerned Very concerned
inflation risks.
• 67.1% of conservatives said they were “very Conservative 5.5% 26.5% 67.1%
concerned” about inflation, compared with
40.5% of moderates and 38.7% of liberals.
• The political divide is likely drive by the fact
Moderate 14.0% 43.2% 40.5%
that U.S. conservatives tend to view
themselves as fiscally conservative and
believe the federal government should limit
its spending. Additionally, inflation tends to
be more financially harmful for retirees and Liberal 6.7% 50.6% 38.7%
wealthier investors, a larger share of whom
tend to be conservative.
Source: Poll conducted from July 29 to August 8, 2021, among a representative sample of 1,000 U.S. adults
38D E L T A V A R I A N T I N T E R R U P T S R E C OV E R Y : U . S . E C ON OMI C OU T L OOK
PERSONAL FINANCES, CONSUMER
CREDIT AND HOUSINGP E R S ON A L F I N A N C E S
The share of households with money left over after paying expenses
dwindled to its lowest level since January
After you paid your recurring expenses last month, did you have any
money left over that you could save or add to your savings?
Of those responding “No, our expenses were more than our
No, our expenses were more than our income income,” 80% earned less than $50,000 per year
No, our expenses roughly equaled our income with nothing left over
Over $100,000
Yes, we had some money left over 4%
16% 14% 13% 12% 14% 14% 16%
$50,000-
25% $100,000
25% 26% 26% 25%
28% 26% 16%
Under
61% 63% 61% $50,000
56% 61% 60% 57% 80%
Jan-21 Feb-21 Mar-21 Apr-21 May-21 Jun-21 Jul-21
Source: Morning Consult Economic Intelligence, monthly surveys conducted among a representative sample of 2,200 U.S. adults 40P E R S ON A L F I N A N C E S
Financial vulnerability remains stable in August
Share of adults lacking savings to pay basic expenses for a full month • The share of Americans lacking savings to
30% cover their basic expenses for a full
July 31, 2020:
June 31, 2021: month fell in August to 21.4%, down from
$600 per week federal
More than 20 states terminate 21.9% in July.
25%
unemployment benefits expire
federal unemployment benefits
• Following a modest decline, improving
20%
financial vulnerability was one of the few
metrics that saw improvement in August
15% as concerns over the COVID-19 surge
take their toll on the economy.
10%
• There is no evidence yet of financial
5% vulnerability increasing due to the
expiration of federal unemployment
benefits. However, recent history
0%
suggests it could take a few months
0
1
0
1
20
20
0
0
21
20
21
21
1
21
1
-2
r-2
-2
l-2
l-2
-2
-2
-2
before financial vulnerability increases.
g-
p-
g-
n-
n-
n-
b-
ay
ar
ov
ec
ct
Ju
Ju
Ap
Au
Se
Au
Ju
Ja
Ju
Fe
O
M
N
D
M
Source: Morning Consult Economic Intelligence, monthly surveys conducted among a representative sample of 2,200 U.S. adults 41P E R S ON A L F I N A N C E S
Unemployment payments trending lower as expanded benefits expire
• Average weekly unemployment insurance benefits fell to $471 in mid August, down from $571 in mid July. Payments remain
above the series low of $437 in Dec. 2020, indicating there remains additional room for payments to decrease in the coming months.
• Expiring expanded unemployment payments paired with increasing cases elevates risks for Americans’ finances. Similar to
last year, Americans will become more financially dependent on wage income than government subsidies at a time when the
increase in cases calls into question the employment recovery.
Average weekly unemployment insurance payment ($)
June 2021:
Dec-Jan 2021:
July 31, 2020: March 11, 2021: Over 20 states begin
700 Federal benefits
$600 enhanced Federal benefits terminating federal
extended, but delay
benefits expire extended to unemployment benefits
September: $300 complicates state
600 September
6-week extension implementation
500 $471.03
400
300
200
100
0
Apr-20 Ma y-20 Jun-20 Jul-20 Aug-20 Sep-20 Oct-20 Nov-20 Dec-20 Jan-21 Feb-21 Ma r-21 Apr-21 Ma y-21 Jun-21 Jul-21 Aug-21
Source: Morning Consult Economic Intelligence, monthly surveys conducted among a sample of 2,200 U.S. adults on average 42P E R S ON A L F I N A N C E S
Largest Child Tax Credit payments sent to parents on the higher end
of the eligible income range
• Parents earning over $100,000 are
more likely to have more children,
Child Tax Credit payment amount received in July, by annual income entitling them to multiple payments.
• Higher income, married parents
received larger payments on average as
a result of the credit, suggesting that
these groups may have extra cash to
spend through the end of the year as
$604 $568 payments continue to be distributed.
$543 $523
$436
• The payments are likely to boost
spending among parents as inflation
continues to raise prices on household
expenses and summer travel and back
Over $100,000 $50,000-$100,000 Under $50,000 Married parents Single to school shopping apply added strain to
parent/guardian monthly budgets.
Source: Poll conducted from August 3-7, 2021, among 355 adults that reported having received a Child Tax Credit payment in July 2021, with a margin of error of +/-5%. Average
payment size estimated by taking the weighted average of the midpoints of each dollar value range. 43C ON S U ME R C R E D I T
Middle-income earners reported increasing credit card debt in July, while few earning
over $100,000 reported rising balances
Share of respondents reporting an increase in unpaid credit card debt • Fewer high-earning adults saw an increase
By annual household income
in credit card debt last month, with only
Adults Under $50,000 $50,000-$100,000 Over $100,000 14% of those earning more than $100,000
35% reporting higher balances in July—the
30% second straight monthly drop.
25% • Among adults earning between $50,000
20% and $100,000, 23% increased debt levels
in July, the second highest level this year.
15%
10% • While lower credit card debt can be a
positive indicator for household financial
5% stability, a continued softening in debt-
0% fueled spending can also be a sign of
diminished consumer confidence and
1
1
1
20
20
1
1
1
1
-2
-2
-2
-2
l-2
2
2
flagging demand, potentially harkening a
n-
n-
-
-
r
ar
ay
b
ov
ec
Ju
Ap
Ja
Ju
Fe
M
N
D
M
slower pace of economic recovery.
Source: Morning Consult Economic Intelligence, monthly surveys conducted among a sample of 677 adults with outstanding credit card debt on average 44H OU S I N G
After trending downward for much of the year, missed housing payments
increased from June to July
Did any of the following happen to your household last month?
Forbearance
Jun-21 Jul-21
Missed payments
Forgiveness
10%
9% 8%
7%
6% 6%
My household did not pay in full the Our landlord or bank allowed us to Our landlord or bank allowed us to
rent or mortgage last month even not pay in full the rent or mortgage not pay in full the rent or mortgage
though we didn't receive permission last month, and we will not have to last month, but we will have to repay
from our bank or landlord. repay this money in the future. this money in the future.
Source: Morning Consult Economic Intelligence, monthly surveys conducted among an average monthly sample of 1,447 homeowners with mortgage and rent payments
45H OU S I N G
About 1 in 5 Gen-Z renters or homeowners sought permission to delay
housing payments in July
Did any of the following happen to your household last month?
Our landlord or bank allowed us to not pay in full the rent or mortgage last month, but
we will have to repay this money in the future.
By generation
Jun-21 Jul-21
21%
16%
14% 14%
5% 5%
2% 4%
GenZers (1997-2012) Millennials (1981-1996) GenXers (1965-1980) Baby Boomers (1946-1964)
Source: Morning Consult Economic Intelligence, monthly surveys conducted among an average monthly sample of 1,447 homeowners with mortgage and rent payments 46H OU S I N G
Almost 70% of households currently in forbearance expect to start repaying
deferred housing costs by September 1
When will your household have to start repaying the rent/mortgage payments
that you haven't paid, but still owe your landlord or bank?
39%
29%
18%
14%
8/1/21 9/1/21 October 2021 or later I don't know
Source: Morning Consult Economic Intelligence, survey conducted August 3-7, 2021, among a sample of 144 U.S. adults in forbearance
47H OU S I N G
Evictions increased in July and are likely to climb higher throughout 2021
Share of households that reported having received an eviction notice
• The share of households receiving
eviction notices grew from 5.4% in
June to 6.9% in July as the CDC’s
7.7% nationwide eviction moratorium
6.9% expired on July 31.
6.4%
6.1%
5.5% 5.4% • The expired moratorium was quickly
5.0% replaced on August 3 by a similar
measure set to expire in October,
offering protection against eviction for
about 80% of the population.
• In late August, the Supreme Court
overturned the new rule, paving the
Jan-21 Feb-21 Mar-21 Apr-21 May-21 Jun-21 Jul-21 way for evictions to resume this
month.
Source: Source: Morning Consult Economic Intelligence, monthly surveys conducted among an average monthly sample of 1,447 homeowners with mortgage and rent payments 48REPORT AUTHORS
John Leer Kayla Bruun Jesse Wheeler
C H I E F E C ON OMI S T E C ON OMI C A N A L Y S T E C ON OMI C A N A L Y S T
LEARN MORE FOLLOW US MEDIA AND SPEAKING
INQUIRIES
MorningConsult.com @MorningConsult press@morningconsult.com
49A B O U T M O R N I N G C O N S U LT
Morning Consult is a global enterprise technology company
delivering intelligent data to power leaders’ decisions. The
company’s proprietary AI technology, including both
machine-learning and natural language processing solutions,
pairs with leading, high-frequency datasets and access to
more than 100 million people globally, to optimize decision
making. Morning Consult’s proven approach gives users a
leading advantage for more effective decision making at an
unparalleled speed and scale.
50GET THE LATEST ECONOMIC ANALYSIS CLICK HERE TO SIGN UP
C OV I D S U R GE T H R E A T E N S R E C OV E R Y : U . S . E C ON OMI C OU T L OOK

   METHODOLOGY
ECONOMIC                                                                   MC E I D A T A I N T E L L I GE N C E C A P A B I L I T I E S

                                             INTELLIGENCE                                                               Economic Intelligence collects over 15,000 daily responses on
                                                                                                                        key global macro economic indicators including:

                                                                                                                        § Personal             § Employment           § Pricing Effect
                                             Data Intelligence                                                            Finances               Type                 § Supply
                                             On Key Economic Indicators                                                 § Buying               § Labor Market           Expectations
                                                                                                                          Conditions             Sizing               § Demand
                                             Morning Consult’s SaaS platform that tracks key                            § Business             § Future Price           Expectations
                                                                                                                          Conditions             Increases            § Ability to Pay
                                             economic indicators, including consumer sentiment,
                                                                                                                        § Employment           § GDP
                                             spending, labor conditions, and more.                                        Status                 expectations

Key Use Cases

T R A C K GL OB A L                       MON I T OR L A B OR &                            T R A C K I N F L A T I ON                        U N D E R S T A N D H OU S I N G
C ON S U ME R C ON F I D E N C E          E MP L OY ME N T C ON D I T I ON S               E X P E C T A T I ON S                            MA R K E T
Track global consumer confidence to       Compare labor market conditions across           Tracking consumer inflation expectations          Tracking supply and demand of housing,
better understand and forecast consumer   and within countries to identify job             and the impact that has on consumer               including buying and renting and ability
spending.                                 seekers with appropriate skill sets.             spending and buying habits.                       to make payments.

Available in 15 countries

 USA       CHINA      JAPAN        GERMANY       UK       FRANCE       INDIA       ITALY      BRAZIL       CANADA       S KOREA         RUSSIA       AUSTRALIA         SPAIN       MEXICO
C ON S U ME R C ON F I D E N C E
We use responses to five daily survey questions to measure consumer sentiment.
Index of Cons. Index of Cons. Index of Current
Sentiment Expectations Conditions
(ICS) (ICE) (ICC)
❏ Better Now + % Pos. + % Pos.
Current Conditions: Would you say that you (and your family living
❏ Same - % Neg. - % Neg.
there) are better off or worse off financially than you were a year
❏ Worse
ago? + 100 + 100
❏ Don’t Know/No Opinion
Personal
Finances ❏ Will Be Better Off
12-Month Expectations: Now looking ahead — do you think that a + % Pos. + % Pos.
❏ Same - % Neg. - % Neg.
year from now you (and your family living there) will be better off
❏ Will Be Worse Off
financially, or worse off, or just about the same as now? + 100 + 100
❏ Don’t Know/No Opinion
❏ Good Times + % Pos. + % Pos.
12-Month Expectations: Now turning to business conditions in the
❏ Neither Good/Bad - % Neg. - % Neg.
country as a whole — do you think that during the next twelve
❏ Bad Times
months we’ll have good times financially, or bad times, or what? + 100 + 100
Business ❏ Don’t Know/No Opinion
Conditions 5-Year Expectations: Looking ahead, which would you say is more
❏ Good Times + % Pos. + % Pos.
likely — that in the country as a whole we’ll have continuous good - % Neg. - % Neg.
❏ Unem./Depression
times during the next 5 years or so, or that we will have periods of
❏ Don’t Know/No Opinion + 100 + 100
widespread unemployment or depression, or what?
Current Buying Conditions: Thinking about the big things people buy ❏ Good Time + % Pos. + % Pos.
Buying for their homes — such as furniture, a refrigerator, stove, television, ❏ Neither Good/Bad - % Neg. - % Neg.
Conditions and things like that. Generally speaking, do you think now is a good ❏ Bad Time
or bad time for people to buy major household items? ❏ Don’t Know/No Opinion + 100 + 100
avg. avg. avg.
ICS ICE ICC
54L A B OR MA R K E T ME T R I C S
Tracking Labor Force Metrics
THOUSANDS OF DAILY SURVEYS
Expanded
Unemployment Rate
Unemployment Rates
Labor Force Part-Time / Full-Time
Participation Rate Ratio
Employment to Employee Stickiness
Population Ratio Sentiment
✓ Consistent Cross-Country Data ✓ High Frequency Collection ✓ Detailed Demographic
Collection and Methodology & Reporting Segmentation Capabilities
55L A B OR MA R K E T ME T R I C S
Morning Consult’s labor force calculations are simplified and standardized
versions of those used by the Bureau of Labor Statistics, OECD and International
Labour Organization.
EM PL O YED Working
UNEM PL O YED Not working, but looking for work and not disabled
I N T HE L ABO R F O RCE Employed + Unemployed
Has a job, but is open to leaving current job or is actively
W I L L I NG TO SW I T CH JO BS
applying for new jobs
56S U R V E Y C OMP A R I S ON
Morning Consult’s labor market data provides enhanced scale, frequency, and
depth not captured in BLS data.
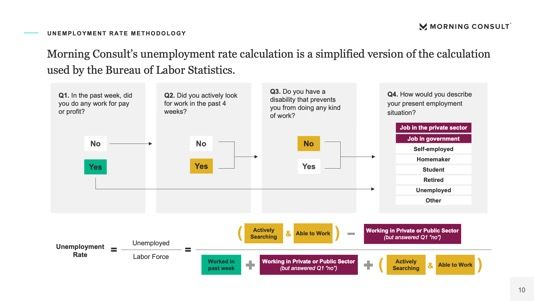
57U N E MP L OY ME N T R A T E ME T H OD OL OGY
Morning Consult’s unemployment rate calculation is a simplified version of the
calculation used by the Bureau of Labor Statistics.
Q3. Do you have a Q4. How would you describe
Q1. In the past week, did Q2. Did you actively look
disability that prevents
you do any work for pay for work in the past 4 your present employment
you from doing any kind
or profit? weeks? situation?
of work?
Job in the private sector
Job in government
No No No
Self-employed
Homemaker
Yes Yes Yes Student
Retired
Unemployed
Other
( Actively
Searching & Able to Work ) Working in Private or Public Sector
(but answered Q1 “no”)
Unemployed
Unemployment
Rate
= =
Labor Force
Worked in
past week
Working in Private or Public Sector
(but answered Q1 “no”) ( Actively
Searching & Able to Work )
58I N T E L L I G E N T DATA ,
INTELLIGENT DECISIONS
© 2021 Morning Consult, All Rights Reserved.You can also read