Democracy Index 2019 A year of democratic setbacks and popular protest - A report by The Economist Intelligence Unit
←
→
Page content transcription
If your browser does not render page correctly, please read the page content below
Democracy Index 2019
A year of democratic setbacks and popular
protest
A report by The Economist Intelligence Unit

                                              www.eiu.com
The world leader in global business intelligence
The Economist Intelligence Unit (The EIU) is the research and analysis division of The Economist Group, the sister company
to The Economist newspaper. Created in 1946, we have over 70 years’ experience in helping businesses, financial firms and
governments to understand how the world is changing and how that creates opportunities to be seized and risks to be managed.
Given that many of the issues facing the world have an international (if not global) dimension, The EIU is ideally positioned to be
commentator, interpreter and forecaster on the phenomenon of globalisation as it gathers pace and impact.
EIU subscription services
The world’s leading organisations rely on our subscription services for data, analysis and forecasts to keep them informed about
what is happening around the world. We specialise in:
•C ountry Analysis: Access to regular, detailed country-specific economic and political forecasts, as well as assessments of
the business and regulatory environments in different markets.
•R isk Analysis: Our risk services identify actual and potential threats around the world and help our clients understand the
implications for their organisations.
• I ndustry Analysis: Five year forecasts, analysis of key themes and news analysis for six key industries in 60 major
economies. These forecasts are based on the latest data and in-depth analysis of industry trends.
EIU Consulting
EIU Consulting is a bespoke service designed to provide solutions specific to our customers’ needs. We specialise in these key
sectors:
•H
ealthcare: Together with our two specialised consultancies, Bazian and Clearstate, The EIU helps healthcare organisations
build and maintain successful and sustainable businesses across the healthcare ecosystem. Find out more at: eiu.com/
healthcare
•P
ublic Policy: Trusted by the sector’s most influential stakeholders, our global public policy practice provides evidence-
based research for policy-makers and stakeholders seeking clear and measurable outcomes. Find out more at: eiu.com/
publicpolicy
The Economist Corporate Network
The Economist Corporate Network (ECN) is The Economist Group’s advisory service for organisational leaders seeking to better
understand the economic and business environments of global markets. Delivering independent, thought-provoking content,
ECN provides clients with the knowledge, insight, and interaction that support better-informed strategies and decisions.
The Network is part of The Economist Intelligence Unit and is led by experts with in-depth understanding of the geographies and
markets they oversee. The Network’s membership-based operations cover Asia-Pacific, the Middle East, and Africa. Through a
distinctive blend of interactive conferences, specially designed events, C-suite discussions, member briefings, and high-calibre
research, The Economist Corporate Network delivers a range of macro (global, regional, national, and territorial) as well as
industry-focused analysis on prevailing conditions and forecast trends.DEMOCRACY INDEX 2019
A YEAR OF DEMOCRATIC SETBACKS AND POPULAR PROTEST
Contents
List of tables 2
Introduction3
Democracy Index 2019 highlights 15
Democracy around the regions in 2019 23
Asia and Australasia 25
Eastern Europe 30
Latin America 33
The Middle East and North Africa 36
North America 40
Sub-Saharan Africa 43
Western Europe 46
Appendix 50
Defining and measuring democracy 50
Methodology52
The Economist Intelligence Unit model 55
References and bibliography 65
1 © The Economist Intelligence Unit Limited 2020DEMOCRACY INDEX 2019
A YEAR OF DEMOCRATIC SETBACKS AND POPULAR PROTEST
List of tables and charts
Table 1 Democracy Index 2019, by regime type
Chart 1 Democracy Index 2019, global map by regime type
Chart 2: Evolution of democracy by category, 2008-19
Table 2 Democracy Index 2019, regional category scores
Table 3 Democracy Index 2006-19
Table 4 Democracy across the regions 2019, by regime type
Chart 3 Democracy Index change over time 2006-19
Table 5 Democracy Index 2006-19 by region
Table 6 Asia & Australasia 2019, regional ranking
Chart 4 Asia & Australasia, Democracy Index 2019 by category
Table 7 Eastern Europe 2019, regional ranking
Chart 5 Eastern Europe, Democracy Index 2019 by category
Table 8 Latin America & the Caribbean 2019, regional ranking
Chart 6 Latin America & the Caribbean, Democracy Index 2019 by category
Table 9 Middle East & North Africa 2019, regional ranking
Chart 7 Middle East & North Africa, Democracy Index 2019 by category
Table 10 North America 2019, regional ranking
Chart 8 North America, Democracy Index 2019 by category
Table 11 Sub-Saharan Africa 2019, regional ranking
Chart 9 Sub-Saharan Africa 2019, Democracy Index 2019 by category
Table 12 Western Europe 2019, regional ranking
Chart 10 Western Europe, Democracy Index 2019 by category
2 © The Economist Intelligence Unit Limited 2020DEMOCRACY INDEX 2019
A YEAR OF DEMOCRATIC SETBACKS AND POPULAR PROTEST
Introduction
The Economist Intelligence Unit’s Democracy Index provides a snapshot of the state of democracy
worldwide in 165 independent states and two territories. This covers almost the entire population of
the world and the vast majority of the world’s states (microstates are excluded). The Democracy Index
is based on five categories: electoral process and pluralism; the functioning of government; political
participation; political culture; and civil liberties. Based on its scores on a range of indicators within
these categories, each country is then itself classified as one of four types of regime: “full democracy”,
“flawed democracy”, “hybrid regime” or “authoritarian regime”. A full methodology and explanations
can be found in the Appendix.
This is the 12th edition of the Democracy Index, which began in 2006, and it records how global
democracy fared in 2019. The global results are discussed in this introduction, and the results by region
are analysed in greater detail in the section entitled Democracy around the regions in 2019 (see page
23). According to The Economist Intelligence Unit’s measure of democracy, almost one-half (48.4%) of
the world’s population live in a democracy of some sort, although only 5.7% reside in a “full democracy”,
down from 8.9% in 2015 as a result of the US being demoted from a “full democracy” to a “flawed
democracy” in 2016. More than one-third of the world’s population live under authoritarian rule, with a
large share being in China.
Table 1
Democracy Index 2019, by regime type
No. of countries % of countries % of world population
Full democracies 22 13.2 5.7
Flawed democracies 54 32.3 42.7
Hybrid regimes 37 22.2 16.0
Authoritarian regimes 54 32.3 35.6
Note. “World” population refers to the total population of the 167 countries covered by the Index. Since this excludes only micro states, this
is nearly equal to the entire estimated world population.
Source: The Economist Intelligence Unit.
According to the 2019 Democracy Index, 76 of the 167 countries covered by the model, or 45.5% of
all countries, can be considered to be democracies. The number of “full democracies” increased to 22
in 2019, up from 20 in 2018, as Chile, France and Portugal joined the top-ranked countries (those scoring
more than 8.00), while Malta was relegated to
“The global march of democracy stalled
the “flawed democracy” category. The number
in the 2000s and retreated in the second
of “flawed democracies” fell by one to 54 in 2019. decade of the 21st century. But the
Of the remaining 91 countries in our index, 54 are recent wave of protest in the developing
“authoritarian regimes”, up from 52 in 2018, and world and the populist insurgency in the
37 are classified as “hybrid regimes”, down from mature democracies show the potential
39 in 2018. (For a full explanation of the index for democratic renewal.”
methodology and categories, see page 52.) Joan Hoey, Editor, The Democracy Index
3 © The Economist Intelligence Unit Limited 2020DEMOCRACY INDEX 2019
A YEAR OF DEMOCRATIC SETBACKS AND POPULAR PROTEST
A year of democratic setbacks and global protest
In the 2019 Democracy Index the average global score for democracy fell from 5.48 in 2018 to 5.44 (on
a scale of 0-10). This is the worst average global score since the index was first produced in 2006. The
2019 result is even worse than that recorded in 2010, in the wake of the global economic and financial
crisis, when the average global score fell to 5.46. From 2011 onwards the average global score recorded
a gradual, modest annual improvement, but in 2015 and 2018 the score stagnated, and in 2016 and 2019
it declined.
The decline in the average global score in 2019 was driven by a sharp regression in Latin America and
Sub-Saharan Africa, a lesser one in the Middle East and North Africa (MENA) region, and by stagnation
in the remaining four regions covered by the Democracy Index. Latin America was the worst-
performing region in 2019, recording a fall of 0.11 points in its average regional score compared with
2018, to 6.13. Starting from an already low base, the regression in Sub-Saharan Africa was also striking:
the average regional score fell by 0.10 points year on year, to 4.26. The democratic deterioration in the
MENA region was more modest but followed a trend of steady regression that started in 2012, when
the gains of the Arab Spring began to be reversed. In the 2019 Democracy Index three regions stood
still in terms of their average scores, as gains in some countries and categories were erased by setbacks
in others. Asia and Australasia and eastern and western Europe all failed to make headway in the
Democracy Index in 2019. The exception to the regression rule in 2019 was North America (Canada and
the US), whose average regional score moved up by 0.03 points because of a modest improvement in
Canada’s score.
In 2019 some 68 countries experienced a decline in their total score compared with 2018, but
almost as many (65) recorded an improvement. The other 34 stagnated, with their scores remaining
unchanged compared with 2018. There were some impressive improvements and some dramatic
declines, as discussed in the Highlights section, with Thailand registering the biggest improvement
in score and China the greatest decline. There were ten changes of regime category, six of them
positive and four negative. Three countries (Chile, France and Portugal) moved from the “flawed
democracy” category to be classified as “full democracies”. Malta moved in the opposite direction,
falling out of the “full democracy” category to become a “flawed democracy”. At the other end of
the democracy spectrum, Iraq and Palestine moved from being classified as “hybrid regimes” to
“authoritarian regimes”. Algeria moved from being classified as an “authoritarian regime” to the “hybrid
regime” category. El Salvador and Thailand moved out of the “hybrid regime” category into the “flawed
democracy” category, while Senegal moved in the opposite direction, from being a “flawed democracy”
to a “hybrid regime”.
4 © The Economist Intelligence Unit Limited 2020DEMOCRACY INDEX 2019
A YEAR OF DEMOCRATIC SETBACKS AND POPULAR PROTEST
Chart 1: Democracy Index 2019, global map by regime type
Full democracy
9.0 – 10.0
8.0 – 9.0
Flawed democracy
7.0 – 8.0
6.0 – 7.0
Hybrid regime
5.0 – 6.0
4.0 – 5.0
Authoritarian regime
3.0 – 4.0
2.0 – 3.0
0 – 2.0
No data
Source: The Economist Intelligence Unit.
What lies behind the global democratic regression?
Surveys by the Pew Research Center on global attitudes towards democracy have in recent years
revealed a disjuncture between still-high levels of public support for democracy across the globe
and deep popular disappointment with the functioning of democracy and systems of political
representation. Since the inception of the Democracy Index in 2006 we have highlighted the
progressive deterioration in the practice of democracy in the most developed democracies in the
West. According to Larry Diamond, a renowned democracy scholar, “we have been going through a
democracy recession”, and he points to a trend towards authoritarianism in the developing world.
The Economist Intelligence Unit’s Democracy Index has also noted these trends towards
authoritarian rule in the non-OECD regions. However, our focus has been much more on the growing
democratic deficit in the developed world, which we have discussed at some length in recent editions
of the Democracy Index (see for example, Democracy Index 2016, Revenge of the deplorables).
5 © The Economist Intelligence Unit Limited 2020DEMOCRACY INDEX 2019
A YEAR OF DEMOCRATIC SETBACKS AND POPULAR PROTEST
A regression and/or stagnation of democracy has been reflected in the declining average scores for
the advanced democracies of the US and Europe over many years. In our view, the main manifestations
of this democracy recession include:
l an increasing emphasis on elite/expert governance rather than popular participatory
democracy;
l a growing influence of unelected, unaccountable institutions and expert bodies;
l the removal of substantive issues of national importance from the political arena to be
decided by politicians, experts or supranational bodies behind closed doors;
l a widening gap between political elites and parties on the one hand and national electorates
on the other; and
l a decline in civil liberties, including media freedom and freedom of speech.
These regressive trends in the mature democracies developed from the 1990s onwards, accelerated
in the 2000s and reached their apogee in the decade that closed in 2019.
In the mature democracies the result was an unsustainable political status quo: the increasing
vacuity of national politics and the retreat of political elites and parties from engagement with
their electorates resulted in falling levels of popular trust in political institutions and parties,
declining political engagement, and a growing resentment among electorates at the lack of political
representation. Eventually the alienation of people from the 21st-century body politic gave rise to
populist movements, which repudiated the mainstream political parties and demanded a new political
contract between the people and their elected representatives.
More developed emerging market democracies in Asia, eastern Europe and Latin America share
some of the democratic deficits that characterise the mature democracies in the West. There too
popular protest movements have emerged in recent years demanding change, as we discuss below
in relation to 2019. The democratic deficits in the CIS region of eastern Europe, the MENA region
and much of Sub-Saharan Africa are more fundamental, and protests in those regions often express
popular aspirations for elementary democratic rights and basic freedoms.
Popular disappointment with the functioning of democracy across the developed and developing
world can be explained by the worsening in the average global score across all but one of the five
categories of the Democracy Index in recent years, a trend that continued in 2019. The five categories
across which all countries are assessed are: electoral process and pluralism; the functioning of
government; political participation; political culture; and civil liberties.
The average global scores for all categories of the Democracy Index with the exception of political
participation have fallen almost sequentially since 2012. Compared with 2008, the first year for which
comparable data are available, the average category scores have fallen significantly. The biggest decline
has been for civil liberties, the score for which fell from 6.35 in 2008 to 5.74 in 2019. This decline was
recorded across all regions of the world, without exception, with the biggest being recorded in Latin
America whose average score fell by 0.75 points between 2011 and 2019. Eastern Europe recorded
the second biggest decline in its civil liberties score (of 0.66 points) during this period. The smallest
decline (0.29 points) was in North America. In Western Europe, where infringements of free speech
6 © The Economist Intelligence Unit Limited 2020DEMOCRACY INDEX 2019
A YEAR OF DEMOCRATIC SETBACKS AND POPULAR PROTEST
Chart 2: Evolution of democracy by category, 2008-19
(Index score out of 10, 10 being best)
Civil Political Political Functioning of Electoral process
liberties culture participation government and pluralism
7.0 7.0
6.5 6.5
6.0 6.0
5.5 5.5
5.0 5.0
4.5 4.5
4.0 4.0
2008 10 11 12 13 14 15 16 17 18 19
Source: The Economist Intelligence Unit.
and religious freedom have increased, the average score declined sharply (by 0.42 points) over the
same period. As highlighted in the Democracy Index 2017: Free speech under attack, free speech is
increasingly being restricted by both state and non-state actors. In the past decade, in fact, no scores
in the Democracy Index have deteriorated as much as those related to freedom of expression and
media freedom.
The second-worst-performing category over the past decade has been electoral process and
pluralism, the score for which deteriorated by 0.10 in 2019 compared with 2018, continuing years of
steady decline. The average global score for this category has fallen from 6.07 in 2008 to 5.80 in 2019,
with most of the regression being concentrated in developing regions such as Asia, eastern Europe,
Latin America and Sub-Saharan Africa. Latin America’s average score in this category is higher than
that of other emerging-market regions but lags significantly behind those for the developed world;
it has also fallen sharply since 2011, from 8.20 to 7.48. The developed democracies of North America
and western Europe continue to score highly in this category, but western Europe’s average score has
declined steadily year by year. The average global score is dragged down by the very poor scores in this
category in the MENA region (2.50) and Sub-Saharan Africa (3.99).
The functioning of government category is the lowest-scoring category in the Democracy Index,
with an average global score of 4.81 in 2019, down from 5.00 in 2008. Asia (5.81), Latin America (5.40) and
eastern Europe (4.54) have struggled to improve their performance in this category. Indeed they have
regressed in recent years. The consistently low scores for transparency, accountability and corruption in
the developing world explain much of the underperformance. In all of these areas there was little or no
progress in 2019, and government failures in these areas help to explain the upsurge of political protest
and social unrest in the developing regions in 2019. The MENA region (2.84) and Sub-Saharan Africa
(3.27) perform very poorly in this area.
7 © The Economist Intelligence Unit Limited 2020DEMOCRACY INDEX 2019
A YEAR OF DEMOCRATIC SETBACKS AND POPULAR PROTEST
It is in the functioning of government category that the advanced democracies have also struggled
in recent years and registered regressions in their scores. Western Europe averages only 7.95 in
this category, while the score for the US was even lower, at 7.14 in 2019. Government dysfunction,
insufficient transparency and a lack of accountability help to explain the relatively low scores for the
mature democracies in this category. However, the questions which have dragged down the country
and regional scores in this category are those that pertain to popular perceptions of control; public
confidence in government; and public confidence in political parties. In the worst-scoring question in
the functioning of government category (and in the entire index), concerning popular confidence in
political parties, the score fell once again in 2019.
There has been a decline in the average global score for the political culture category between 2008
and 2019, from 5.73 to 5.57, a smaller regression compared with other categories. The trajectory of
the score over this period has also been less linear and more lumpy. Disillusionment with traditional
political parties which have failed to address weaknesses in the practice of democracy has undermined
confidence in democracy itself, as revealed in surveys by Eurobarometer, Latinobarómetro,
Afrobarometer, Gallup, Pew and others. In our Democracy Index the score for popular perceptions of
democracy has fallen in recent years. There has also been a notable decline in the score relating to the
degree of societal consensus and cohesion necessary to support democracy.
Democratic backsliding, popular protest
The one category which has recorded a steady and significant upward trajectory is political
participation, for which the average global score has risen from 4.59 in 2008 to 5.28 in 2019. With
the exception of North America, whose average score for political participation fell from 7.78 in
2011 to 7.50 in 2019, every region has recorded an improvement in this category over the same time
period. Admittedly, the improvement has been from a low base, indicating one of the most damning
weaknesses of democracy around the globe; the average global score for political participation is the
second-lowest of all the categories, after that for functioning of government. The improvement in the
average score for political participation over the past decade is in our view correlated with the parallel
deterioration in the scores for electoral process and pluralism, functioning of government and civil
liberties. The failures of “actually existing democracy” in the developing and developed world have
inspired millions of people who aspire to have a better version of democracy, to become engaged, and
to demand change.
As discussed in the section Democracy around the regions (see page 23), following a popular
backlash against “actually existing democracy” in the developed democracies in recent years, public
dissatisfaction with the political status quo boiled over in many places in the developing world in 2019. A
rising tide of popular protest shook regimes run by despots and democrats alike in Asia, Latin America
and the Caribbean, the MENA region and in Sub-Saharan Africa. The willingness of populations to take
to the streets to express their opposition to the established order, to protest against official measures,
unjust laws and corruption and to demand change resulted in improved scores for political participation
in many countries and across the regions.
8 © The Economist Intelligence Unit Limited 2020DEMOCRACY INDEX 2019
A YEAR OF DEMOCRATIC SETBACKS AND POPULAR PROTEST
Economic distress is almost a necessary precondition for serious instability, but in itself is not a
sufficient one, and the protests of 2019 also had clear political mainsprings. Declines in incomes are
not always followed by unrest. It is only when economic distress is accompanied by other structural
features of vulnerability that there is a high risk of instability. The underlying vulnerability to unrest
depends on a host of factors, including the degree of income inequality, the state of governance, levels
of social provision, ethnic tensions, public trust in institutions, and a history of unrest. What appears to
be decisive in firing unrest is the erosion of trust in governments, institutions, parties and politicians—
what is generally termed “the crisis of democracy”. It is only by giving due consideration to this political
dimension that we can understand the mainsprings of protest and see the common denominators of
seemingly diverse protests.
In Latin America, mass protests erupted in 2019 in numerous countries, including Bolivia, Chile,
Colombia, Ecuador, Haiti and Venezuela. The drivers of these protests varied from clashes over
electoral fraud to demonstrations against corruption and austerity measures. All expressed distrust
in the political class and dissension from governments’ policy decisions. In some cases, for example in
Chile, a single issue, such as a government fare hike for Santiago’s metro system, became a lightning rod
for other grievances. Dysfunctional political systems and the failure of governments to address voter
concerns led to an improvement in political participation across the region, as growing numbers of
citizens voiced their dissatisfaction with the status quo and demanded change.
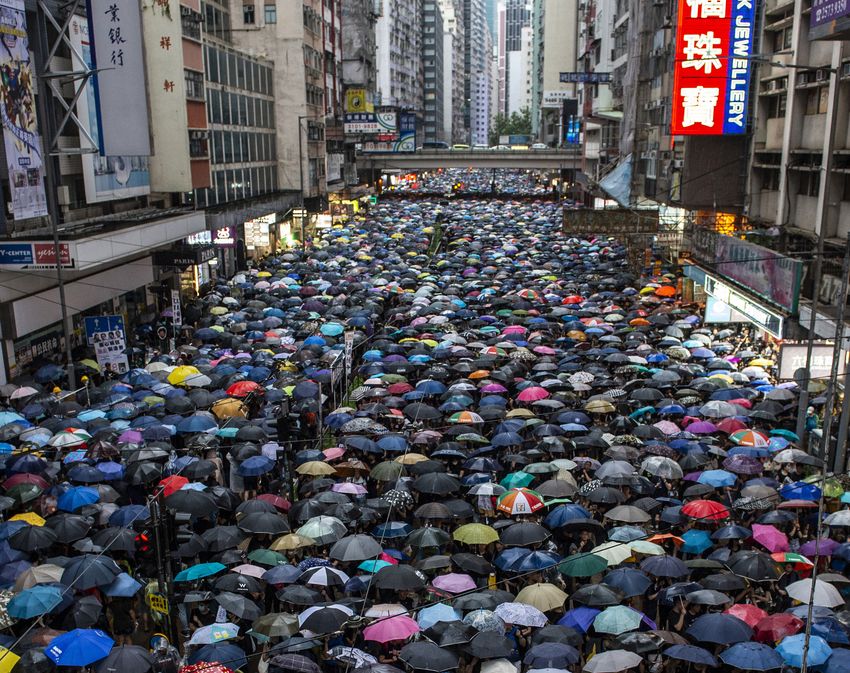
Hong Kong was the epicentre of protest in Asia. What began as a protest against proposed
amendments to Hong Kong’s extradition law soon morphed into a campaign for more democracy.
After starting out by demanding that the local government drop the extradition legislation, protestors
ended up calling for universal suffrage. The protests also gave expression to other concerns, for
example about the increasing influence of central government on local matters, including those
pertaining to freedom of expression.
More upheaval in the MENA region
Rising popular frustration with the political status quo in several countries led to growing public
protests in the MENA region in 2019, including in Algeria, Lebanon, Iraq, Iran and Sudan, continuing a
trend that started in 2018. These protests led to regime change in some countries or elections in the less
authoritarian systems. In other countries populations joined demonstrations to express dissatisfaction
with the slow pace of political and economic change.
Sub-Saharan Africa experienced its fair share of protests in 2019, including in Cameroon, Ethiopia,
Nigeria and South Africa. Disillusioned and incensed citizens expressed their anger and frustration
with national leaders over painfully slow progress on a range of economic, political and social issues.
The protests differed from place to place, but the participants were inspired by common themes. In
particular, protests were driven by frustration with a government that was seen as corrupt and self-
serving, and unwilling or unable to tackle the political and socioeconomic inequalities facing its people.
The new populist movements in the developed world and the upsurge of popular protests in the
developing world hold out the potential for a regeneration of democracy. At the heart of the populist
insurgency has been a demand for more popular sovereignty and political representation. These are
also concerns for protestors in the emerging-market regions, whose demands for government action to
tackle corruption, economic and social inequalities and human rights abuses can be met only through
greater democratisation.
9 © The Economist Intelligence Unit Limited 2020DEMOCRACY INDEX 2019
A YEAR OF DEMOCRATIC SETBACKS AND POPULAR PROTEST
Table 2
Democracy Index 2019
Electoral
Functioning of Political
Overall Score Rank process and Political culture Civil liberties
government participation
pluralism
Full democracy
Norway 9.87 1 10.00 9.64 10.00 10.00 9.71
Iceland 9.58 2 10.00 9.29 8.89 10.00 9.71
Sweden 9.39 3 9.58 9.64 8.33 10.00 9.41
New Zealand 9.26 4 10.00 9.29 8.89 8.13 10.00
Finland 9.25 5 10.00 8.93 8.89 8.75 9.71
Ireland 9.24 6 10.00 7.86 8.33 10.00 10.00
Denmark 9.22 7= 10.00 9.29 8.33 9.38 9.12
Canada 9.22 7= 9.58 9.64 7.78 9.38 9.71
Australia 9.09 9 10.00 8.93 7.78 8.75 10.00
Switzerland 9.03 10 9.58 9.29 7.78 9.38 9.12
Netherlands 9.01 11 9.58 9.29 8.33 8.75 9.12
Luxembourg 8.81 12 10.00 8.93 6.67 8.75 9.71
Germany 8.68 13 9.58 8.57 8.33 7.50 9.41
United Kingdom 8.52 14 9.58 7.50 8.89 7.50 9.12
Uruguay 8.38 15 10.00 8.57 6.11 7.50 9.71
Austria 8.29 16= 9.58 7.86 8.33 6.88 8.82
Spain 8.29 16= 9.58 7.14 7.78 8.13 8.82
Mauritius 8.22 18 9.17 8.21 5.56 8.75 9.41
Costa Rica 8.13 19 9.58 7.50 6.67 7.50 9.41
France 8.12 20 9.58 7.86 7.78 6.88 8.53
Chile 8.08 21 9.58 8.57 5.00 8.13 9.12
Portugal 8.03 22 9.58 7.86 6.11 7.50 9.12
Flawed democracy
South Korea 8.00 23 9.17 7.86 7.22 7.50 8.24
Japan 7.99 24 8.75 8.21 6.67 7.50 8.82
United States of America 7.96 25 9.17 7.14 7.78 7.50 8.24
Malta 7.95 26 9.17 7.50 6.11 8.13 8.82
Estonia 7.90 27 9.58 7.86 6.67 6.88 8.53
Israel 7.86 28 9.17 7.86 8.89 7.50 5.88
Botswana 7.81 29 9.17 7.14 6.11 7.50 9.12
Cabo Verde 7.78 30 9.17 7.36 6.67 6.88 8.82
Taiwan 7.73 31 9.58 8.21 6.11 5.63 9.12
Czech Republic 7.69 32 9.58 6.79 6.67 6.88 8.53
Belgium 7.64 33 9.58 8.21 5.00 6.88 8.53
Cyprus 7.59 34 9.17 6.43 6.67 6.88 8.82
Italy 7.52 35 9.58 6.07 7.78 6.25 7.94
Slovenia 7.50 36= 9.58 6.79 6.67 6.25 8.24
Lithuania 7.50 36= 9.58 6.43 6.11 6.25 9.12
10 © The Economist Intelligence Unit Limited 2020DEMOCRACY INDEX 2019
A YEAR OF DEMOCRATIC SETBACKS AND POPULAR PROTEST
Table 2
Democracy Index 2019
Electoral
Functioning of Political
Overall Score Rank process and Political culture Civil liberties
government participation
pluralism
Latvia 7.49 38 9.58 6.07 6.11 6.88 8.82
Greece 7.43 39 9.58 4.86 6.67 7.50 8.53
South Africa 7.24 40 7.42 7.50 8.33 5.00 7.94
Timor-Leste 7.19 41 9.58 6.29 5.56 6.88 7.65
Slovakia 7.17 42 9.58 7.14 5.56 5.63 7.94
Malaysia 7.16 43= 9.17 7.86 6.67 6.25 5.88
Trinidad and Tobago 7.16 43= 9.58 7.14 6.11 5.63 7.35
Colombia 7.13 45 9.17 6.79 5.56 5.63 8.53
Panama 7.05 46 9.58 6.07 6.67 5.00 7.94
Bulgaria 7.03 47 9.17 6.43 7.22 4.38 7.94
Argentina 7.02 48 9.17 5.36 6.11 6.25 8.24
Suriname 6.98 49 9.17 6.43 6.67 5.00 7.65
Jamaica 6.96 50 8.75 7.14 4.44 6.25 8.24
India 6.90 51 8.67 6.79 6.67 5.63 6.76
Brazil 6.86 52 9.58 5.36 6.11 5.00 8.24
Tunisia 6.72 53 9.17 5.71 7.22 5.63 5.88
Philippines 6.64 54 9.17 5.36 7.22 4.38 7.06
Ghana 6.63 55= 8.33 5.71 6.67 6.25 6.18
Hungary 6.63 55= 8.75 6.07 5.00 6.25 7.06
Poland 6.62 57 9.17 6.07 6.11 4.38 7.35
Peru 6.60 58 9.17 5.00 5.56 5.63 7.65
Croatia 6.57 59 9.17 6.07 5.56 5.00 7.06
Dominican Republic 6.54 60= 9.17 5.36 6.11 5.00 7.06
Lesotho 6.54 60= 9.17 4.50 6.67 5.63 6.76
Mongolia 6.50 62 9.17 5.71 5.56 5.00 7.06
Romania 6.49 63 9.17 5.71 5.56 4.38 7.65
Indonesia 6.48 64 7.92 7.14 6.11 5.63 5.59
Namibia 6.43 65 6.58 5.36 6.67 5.63 7.94
Serbia 6.41 66 8.25 5.36 6.11 5.00 7.35
Ecuador 6.33 67 8.75 5.36 6.11 4.38 7.06
Thailand 6.32 68 7.42 5.36 6.11 6.25 6.47
Sri Lanka 6.27 69 7.00 6.07 5.56 6.25 6.47
Paraguay 6.24 70 8.75 5.71 5.00 4.38 7.35
El Salvador 6.15 71= 9.17 4.64 6.11 3.75 7.06
Guyana 6.15 71= 6.92 5.36 6.11 5.00 7.35
Mexico 6.09 73 7.83 6.07 7.22 3.13 6.18
Papua New Guinea 6.03 74 6.92 6.07 3.89 5.63 7.65
Hong Kong 6.02 75= 3.58 4.36 6.11 7.50 8.53
Singapore 6.02 75= 3.92 7.86 5.00 6.25 7.06
11 © The Economist Intelligence Unit Limited 2020DEMOCRACY INDEX 2019
A YEAR OF DEMOCRATIC SETBACKS AND POPULAR PROTEST
Table 2
Democracy Index 2019
Electoral
Functioning of Political
Overall Score Rank process and Political culture Civil liberties
government participation
pluralism
Hybrid regime
North Macedonia 5.97 77 7.00 5.36 6.67 3.75 7.06
Ukraine 5.90 78 7.42 2.71 6.67 6.25 6.47
Albania 5.89 79 7.00 5.36 4.44 5.00 7.65
Bangladesh 5.88 80 7.83 6.07 6.11 4.38 5.00
Fiji 5.85 81 6.58 5.36 6.11 5.63 5.59
Senegal 5.81 82 6.08 6.07 4.44 6.25 6.18
Moldova 5.75 83 6.58 4.64 6.11 4.38 7.06
Montenegro 5.65 84 5.67 5.36 6.11 4.38 6.76
Madagascar 5.64 85 7.92 3.57 6.11 5.63 5.00
Armenia 5.54 86 7.50 5.36 6.11 3.13 5.59
Malawi 5.50 87 6.08 4.29 5.00 6.25 5.88
Liberia 5.45 88 7.42 3.07 5.56 5.63 5.59
Georgia 5.42 89= 7.83 3.21 6.11 4.38 5.59
Honduras 5.42 89= 7.83 4.29 4.44 4.38 6.18
Bhutan 5.30 91 8.75 6.79 2.78 4.38 3.82
Nepal 5.28 92 4.83 5.36 5.00 5.63 5.59
Guatemala 5.26 93 6.92 4.64 3.89 4.38 6.47
Kenya 5.18 94 3.50 5.71 6.67 5.63 4.41
Tanzania 5.16 95 5.75 5.00 5.00 5.63 4.41
Morocco 5.10 96 5.25 4.64 5.56 5.63 4.41
Benin 5.09 97= 4.67 5.71 4.44 5.63 5.00
Zambia 5.09 97= 4.75 2.93 4.44 6.88 6.47
Uganda 5.02 99 4.33 3.57 4.44 6.88 5.88
Mali 4.92 100 6.42 3.07 3.89 5.63 5.59
Kyrgyz Republic 4.89 101 6.08 2.93 6.67 3.75 5.00
Bosnia and Hercegovina 4.86 102= 6.17 2.93 5.56 3.75 5.88
Sierra Leone 4.86 102= 6.58 2.86 3.33 6.25 5.29
Bolivia 4.84 104 4.75 3.93 5.00 3.75 6.76
Haiti 4.57 105 4.75 2.07 3.89 6.25 5.88
Lebanon 4.36 106 3.92 1.50 6.67 5.00 4.71
Gambia 4.33 107 4.00 4.29 3.33 5.63 4.41
Pakistan 4.25 108 6.08 5.71 2.22 2.50 4.71
Nigeria 4.12 109 5.17 3.93 3.33 3.75 4.41
Turkey 4.09 110 3.08 5.00 5.00 5.00 2.35
Côte d’Ivoire 4.05 111 4.33 2.86 3.33 5.63 4.12
Burkina Faso 4.04 112 3.92 2.71 4.44 5.00 4.12
Algeria 4.01 113 3.08 2.86 5.00 5.00 4.12
12 © The Economist Intelligence Unit Limited 2020DEMOCRACY INDEX 2019
A YEAR OF DEMOCRATIC SETBACKS AND POPULAR PROTEST
Table 2
Democracy Index 2019
Electoral
Functioning of Political
Overall Score Rank process and Political culture Civil liberties
government participation
pluralism
Authoritarian regime
Jordan 3.93 114= 3.58 4.29 3.89 4.38 3.53
Kuwait 3.93 114= 3.58 4.29 3.89 4.38 3.53
Mauritania 3.92 116 3.50 3.57 5.00 3.13 4.41
Palestine 3.89 117 3.33 0.14 7.78 4.38 3.82
Iraq 3.74 118 5.25 0.00 6.67 5.00 1.76
Angola 3.72 119 2.25 2.86 5.56 5.00 2.94
Mozambique 3.65 120 2.58 2.14 5.00 5.00 3.53
Gabon 3.61 121 2.58 2.21 4.44 5.00 3.82
Myanmar 3.55 122= 3.08 3.93 2.78 5.63 2.35
Nicaragua 3.55 122= 1.25 2.86 3.89 5.63 4.12
Cambodia 3.53 124 0.83 4.64 3.33 5.63 3.24
Ethiopia 3.44 125 0.42 3.57 5.56 5.00 2.65
Togo 3.30 126 3.17 1.79 3.33 5.00 3.24
Niger 3.29 127 2.92 1.14 3.33 4.38 4.71
Qatar 3.19 128 0.00 4.29 2.22 5.63 3.82
Rwanda 3.16 129= 1.42 4.29 2.78 4.38 2.94
Zimbabwe 3.16 129= 0.00 2.50 4.44 5.63 3.24
Comoros 3.15 131 2.08 2.21 3.89 3.75 3.82
eSwatini 3.14 132= 0.92 2.86 2.78 5.63 3.53
Guinea 3.14 132= 3.50 0.43 4.44 4.38 2.94
Congo (Brazzaville) 3.11 134= 2.17 2.50 3.89 3.75 3.24
Russia 3.11 134= 2.17 1.79 5.00 2.50 4.12
Vietnam 3.08 136 0.00 3.21 3.89 5.63 2.65
Egypt 3.06 137= 2.67 3.21 3.33 3.75 2.35
Oman 3.06 137= 0.08 3.93 2.78 4.38 4.12
Kazakhstan 2.94 139 0.50 2.14 4.44 4.38 3.24
Venezuela 2.88 140 0.00 1.79 5.00 4.38 3.24
Afghanistan 2.85 141= 3.42 0.64 3.89 2.50 3.82
Cameroon 2.85 141= 1.67 2.50 3.33 4.38 2.35
Cuba 2.84 143 0.00 3.57 3.33 4.38 2.94
Djibouti 2.77 144 0.42 1.29 3.89 5.63 2.65
United Arab Emirates 2.76 145 0.00 3.93 2.22 5.00 2.65
Azerbaijan 2.75 146 0.50 3.21 2.78 3.75 3.53
Sudan 2.70 147 0.00 1.79 5.56 5.00 1.18
Guinea-Bissau 2.63 148 4.92 0.00 2.78 3.13 2.35
Bahrain 2.55 149 0.83 2.71 2.78 4.38 2.06
Belarus 2.48 150 0.92 2.00 2.78 4.38 2.35
Iran 2.38 151 0.00 2.86 4.44 3.13 1.47
13 © The Economist Intelligence Unit Limited 2020DEMOCRACY INDEX 2019
A YEAR OF DEMOCRATIC SETBACKS AND POPULAR PROTEST
Table 2
Democracy Index 2019
Electoral
Functioning of Political
Overall Score Rank process and Political culture Civil liberties
government participation
pluralism
Eritrea 2.37 152 0.00 2.14 1.67 6.88 1.18
China 2.26 153 0.00 4.29 3.33 2.50 1.18
Burundi 2.15 154 0.00 0.07 3.33 5.00 2.35
Laos 2.14 155 0.00 2.86 1.67 5.00 1.18
Libya 2.02 156 0.00 0.00 2.78 4.38 2.94
Uzbekistan 2.01 157 0.08 1.86 2.22 5.00 0.88
Yemen 1.95 158 0.00 0.00 3.89 5.00 0.88
Saudi Arabia 1.93 159= 0.00 2.86 2.22 3.13 1.47
Tajikistan 1.93 159= 0.08 0.79 1.67 6.25 0.88
Equatorial Guinea 1.92 161 0.00 0.43 3.33 4.38 1.47
Turkmenistan 1.72 162 0.00 0.79 2.22 5.00 0.59
Chad 1.61 163 0.00 0.00 1.67 3.75 2.65
Syria 1.43 164 0.00 0.00 2.78 4.38 0.00
Central African Republic 1.32 165 1.25 0.00 1.11 1.88 2.35
Democratic Republic of Congo 1.13 166 0.00 0.00 1.67 3.13 0.88
North Korea 1.08 167 0.00 2.50 1.67 1.25 0.00
14 © The Economist Intelligence Unit Limited 2020DEMOCRACY INDEX 2019
A YEAR OF DEMOCRATIC SETBACKS AND POPULAR PROTEST
Democracy Index 2019 Highlights
2019: the worst global score since 2006
In 2019 the average global score fell from 5.48 in 2018 to 5.44 (on a 0-10 scale), the worst result since
the Democracy Index began in 2006. The decline in the global democracy score was driven by sharp
regressions in the average regional scores in Latin America and Sub-Saharan Africa and a smaller fall
in the average regional score in MENA. Only one region, North America, registered an improvement
in its average score in 2019, and this was due to a modest improvement in Canada’s score. The average
regional scores for Asia and eastern and western Europe stagnated in 2019. Four out of five categories
of the Democracy Index, electoral process and pluralism, the functioning of government, political
culture and civil liberties, also deteriorated in 2019. The exception was political participation, for which
the average global score went up.
Around the world: a year of global protest
As reflected in the improved average global score in the political participation category in 2019, there
was a major increase in political protest and social unrest in emerging-market regions of the world. This
was the biggest upsurge of protest since 2014, in the aftermath of the global economic and financial
crisis. As then, the 2019 protests varied in nature by country and context, but there were several
common underlying drivers. The sheer number of protests spanning different time zones has caught
the attention of commentators everywhere. In fact, protests have been building a head of steam for
several years. The backdrop to the recent wave of protest is in part economic (austerity, cost-of-living
increases, unemployment, income inequality).
But economic issues alone cannot explain the upsurge of unrest. Regressive democratic trends
and political failures have been major factors. It is the growth of popular distrust in governments,
institutions, parties and politicians that is driving many of today’s protest movements. In the developed
world, increasing political participation has been driven by similar concerns about the inadequacies of
democratic politics. Dissatisfaction with the mainstream political parties has given rise to new populist
parties and a demand for more direct democracy. In many places, scores for voter turnout have
increased, membership of political parties and organisations has grown, and engagement with politics
has improved. Despite disenchantment with democracy, and probably because of the degree of
disaffection that now prevails, populations are turning out to vote and to protest. This heightened level
of popular engagement prevented the Democracy Index from sliding even further than it did in 2019.
Top and bottom
There was little change at the very top and the very bottom of the index. Once again Norway came
out on top, with a score of 9.87 (on a scale of 0-10), and North Korea was at the bottom of the global
rankings, with a score of 1.08. Some of the more notable moves up and down the rankings were
recorded by Thailand, which registered the biggest improvement in score and ranking, and by China,
which registered the greatest decline. Following the first election since the military coup in 2014,
Thailand’s score improved by 1.69 points and it moved up 38 places in the rankings, from a “hybrid
15 © The Economist Intelligence Unit Limited 2020DEMOCRACY INDEX 2019
A YEAR OF DEMOCRATIC SETBACKS AND POPULAR PROTEST
regime” to a “flawed democracy”. China’s regression resulted in a decline in score of 1.06 points and a
fall of 23 places down the rankings.
Winners and losers
Although there was no big movement at the top and bottom of the index, there were big movements
in the rankings elsewhere. Three countries (Chile, France and Portugal) moved from the “flawed
democracy” to the “full democracy” category. Malta moved in the opposite direction, falling out of
the “full democracy” category to become a “flawed democracy”. At the other end of the democracy
spectrum, Iraq and Palestine moved from being classified as “hybrid regimes” to “authoritarian
regimes”. Algeria moved from being an “authoritarian regime” to a “hybrid regime”. El Salvador and
Thailand moved out of the “hybrid regime” category into the “flawed democracy” category, while
Senegal moved in the opposite direction from a “flawed democracy” to a “hybrid regime”. There were
other notable improvements, including in Armenia, Bangladesh, El Salvador, eSwatini, Guinea-Bissau,
Madagascar, Sudan, Togo, Tunisia and Ukraine, and there were regressions in Belarus, Benin, Bolivia,
Cameroon, Comoros, Egypt, India, Guyana, Singapore, Mali and Zambia.
An overall setback in Latin America, despite some gains
Latin America is the most democratic emerging-market region in the world. However, its overall score
fell substantially in 2019, from 6.24 in 2018 to 6.13, a fourth consecutive year of decline. In 2019 the
regional decline was chiefly driven by the post-electoral crisis in Bolivia, and to a lesser extent by the
democratic regression in Guatemala and Haiti. Overall scores fell in close to one-half of the countries
in the region. That said, the only two regional ranking modifications in the 2019 Democracy Index
were both upgrades (Chile and El Salvador). The growing use of authoritarian practices in Venezuela,
Nicaragua and Bolivia accounts for much of the recent regional democratic deterioration.
Asia: a year of drama and tumult
Asian democracies had a tumultuous year in 2019. The biggest score change occurred in Thailand,
whose score improved by 1.69 points compared with 2018, to 6.32, resulting in a rise of 38 places in
the global rankings and a transition from a “hybrid regime” to a “flawed democracy”. The biggest
democracy in the world, India, dropped ten places in the Democracy Index’s global ranking, to 51st
place. India’s overall score fell from 7.23 in 2018 to 6.90 in 2019. The primary cause of the democratic
regression was an erosion of civil liberties in the country. The introduction of a “fake news” law in
Singapore led to a deterioration in the score for civil liberties in the city-state. China’s score fell to 2.26,
and the country is now ranked 153rd, close to the bottom of the global rankings, as discrimination
against minorities, especially in the north-western region of Xinjiang, intensified and digital
surveillance of the population continued apace. Hong Kong slipped a further three places in 2019, from
73rd to joint 75th with Singapore out of 167 countries, amid a deterioration in political stability following
a sizeable cumulative decline in 2015-18. The wave of often violent protests that grew from mid-2019 is
largely a manifestation of pre-existing deficiencies in Hong Kong’s democratic environment.
16 © The Economist Intelligence Unit Limited 2020DEMOCRACY INDEX 2019
A YEAR OF DEMOCRATIC SETBACKS AND POPULAR PROTEST
MENA: a turbulent year
Challenging geopolitical circumstances, economic stagnation and corruption have all fed through
into rising popular frustration with the political status quo in several countries, including Algeria,
Iraq, Iran, Lebanon and Sudan. The trend of growing public protests in the region, first apparent in
2018, has widened and deepened, leading to regime change in some countries or elections in the less
authoritarian systems. In other countries, however, protests continued as populations expressed
dissatisfaction with the pace and direction of political change.
Sub-Saharan Africa’s democracy drought
Sub-Saharan Africa, which is highly populated by authoritarian regimes (they account for half of the
region’s 44 countries that are scored in the Democracy Index), experienced a significant democratic
regression in 2019. The region’s overall average score in the Democracy Index fell to 4.26 in 2019, from
4.36 in 2018; 23 countries registered a decline in their scores, which offset marginal improvements in
11. This is the lowest average score for Sub-Saharan Africa since 2010, in the aftermath of the global
economic and financial crisis, when every region of the world registered a democratic regression in the
Democracy Index. This regional deterioration was primarily the consequence of declining scores for
many countries in the category of electoral process and pluralism; the average regional category score
fell to 3.99 (from 4.30 in 2018).
Eastern Europe’s democratic malaise persists
In 2019 eastern Europe’s average score in the Democracy Index remained unchanged from 2018, at 5.42.
This remains markedly below the region’s score of 5.76 in 2006, when the index was first published.
Improvements in the scores for a few countries, notably Armenia and Ukraine, were offset by falling
scores for others, notably Belarus and the Kyrgyz Republic. In total eight countries’ scores rose in
2019, nine fell, and 11 stagnated. This mixed picture suggests that eastern Europe’s democratic malaise
persists amid a weak political culture, difficulties in safeguarding the rule of law, endemic corruption, a
rejection by some countries of “liberal” democratic values and a preference for “strongmen” who bypass
political institutions, all of which creates a weak foundation for democracy.
Western Europe welcomes back two “full democracies” and loses one
Western Europe’s average score in the Democracy Index was stable in 2019 compared with 2018, at
8.35, after falling slightly in each of the three previous years. Countries in western Europe occupy seven
of the top-ten places in the global democracy rankings, including the top three spots, and the region
boasts the largest number of “full democracies” of anywhere in the world, with a total of 15. In 2019
two countries—France and Portugal—moved from the “flawed democracy” to the “full democracy”
category, and one—Malta—moved in the other direction. There are now five countries in the region
that are classed as “flawed democracies”, down from six in 2018. Other countries to improve their
scores in 2019 were Finland, Greece, Ireland, the Netherlands and Spain, but Belgium, Italy and Turkey
registered a fall in their scores. Turkey is the only “hybrid regime” in the region.
17 © The Economist Intelligence Unit Limited 2020DEMOCRACY INDEX 2019
A YEAR OF DEMOCRATIC SETBACKS AND POPULAR PROTEST
Table 3
Democracy Index 2006-19
2019 2018 2017 2016 2015 2014 2013 2012 2011 2010 2008 2006
Canada 9.22 9.15 9.15 9.15 9.08 9.08 9.08 9.08 9.08 9.08 9.07 9.07
US 7.96 7.96 7.98 7.98 8.05 8.11 8.11 8.11 8.11 8.18 8.22 8.22
average 8.59 8.56 8.56 8.56 8.56 8.59 8.59 8.59 8.59 8.63 8.64 8.64
Austria 8.29 8.29 8.42 8.41 8.54 8.54 8.48 8.62 8.49 8.49 8.49 8.69
Belgium 7.64 7.78 7.78 7.77 7.93 7.93 8.05 8.05 8.05 8.05 8.16 8.15
Cyprus 7.59 7.59 7.59 7.65 7.53 7.40 7.29 7.29 7.29 7.29 7.70 7.60
Denmark 9.22 9.22 9.22 9.20 9.11 9.11 9.38 9.52 9.52 9.52 9.52 9.52
Finland 9.25 9.14 9.03 9.03 9.03 9.03 9.03 9.06 9.06 9.19 9.25 9.25
France 8.12 7.80 7.80 7.92 7.92 8.04 7.92 7.88 7.77 7.77 8.07 8.07
Germany 8.68 8.68 8.61 8.63 8.64 8.64 8.31 8.34 8.34 8.38 8.82 8.82
Greece 7.43 7.29 7.29 7.23 7.45 7.45 7.65 7.65 7.65 7.92 8.13 8.13
Iceland 9.58 9.58 9.58 9.50 9.58 9.58 9.65 9.65 9.65 9.65 9.65 9.71
Ireland 9.24 9.15 9.15 9.15 8.85 8.72 8.68 8.56 8.56 8.79 9.01 9.01
Italy 7.52 7.71 7.98 7.98 7.98 7.85 7.85 7.74 7.74 7.83 7.98 7.73
Luxembourg 8.81 8.81 8.81 8.81 8.88 8.88 8.88 8.88 8.88 8.88 9.10 9.10
Malta 7.95 8.21 8.15 8.39 8.39 8.39 8.28 8.28 8.28 8.28 8.39 8.39
Netherlands 9.01 8.89 8.89 8.80 8.92 8.92 8.84 8.99 8.99 8.99 9.53 9.66
Norway 9.87 9.87 9.87 9.93 9.93 9.93 9.93 9.93 9.80 9.80 9.68 9.55
Portugal 8.03 7.84 7.84 7.86 7.79 7.79 7.65 7.92 7.81 8.02 8.05 8.16
Spain 8.18 8.08 8.08 8.30 8.30 8.05 8.02 8.02 8.02 8.16 8.45 8.34
Sweden 9.39 9.39 9.39 9.39 9.45 9.73 9.73 9.73 9.50 9.50 9.88 9.88
Switzerland 9.03 9.03 9.03 9.09 9.09 9.09 9.09 9.09 9.09 9.09 9.15 9.02
Turkey 4.09 4.37 4.88 5.04 5.12 5.12 5.63 5.76 5.73 5.73 5.69 5.70
UK 8.52 8.53 8.53 8.36 8.31 8.31 8.31 8.21 8.16 8.16 8.15 8.08
average 8.35 8.35 8.38 8.40 8.42 8.41 8.41 8.44 8.40 8.45 8.61 8.60
Albania 5.89 5.98 5.98 5.91 5.91 5.67 5.67 5.67 5.81 5.86 5.91 5.91
Armenia 5.54 4.79 4.11 3.88 4.00 4.13 4.02 4.09 4.09 4.09 4.09 4.15
Azerbaijan 2.75 2.65 2.65 2.65 2.71 2.83 3.06 3.15 3.15 3.15 3.19 3.31
Belarus 2.48 3.13 3.13 3.54 3.62 3.69 3.04 3.04 3.16 3.34 3.34 3.34
Bosnia and Hercegovina 4.86 4.98 4.87 4.87 4.83 4.78 5.02 5.11 5.24 5.32 5.70 5.78
Bulgaria 7.03 7.03 7.03 7.01 7.14 6.73 6.83 6.72 6.78 6.84 7.02 7.10
Croatia 6.57 6.57 6.63 6.75 6.93 6.93 6.93 6.93 6.73 6.81 7.04 7.04
Czech Republic 7.69 7.69 7.62 7.82 7.94 7.94 8.06 8.19 8.19 8.19 8.19 8.17
Estonia 7.90 7.97 7.79 7.85 7.85 7.74 7.61 7.61 7.61 7.68 7.68 7.74
Georgia 5.42 5.50 5.93 5.93 5.88 5.82 5.95 5.53 4.74 4.59 4.62 4.90
Hungary 6.63 6.63 6.64 6.72 6.84 6.90 6.96 6.96 7.04 7.21 7.44 7.53
Kazakhstan 2.94 2.94 3.06 3.06 3.06 3.17 3.06 2.95 3.24 3.30 3.45 3.62
Kyrgyz Republic 4.89 5.11 5.11 4.93 5.33 5.24 4.69 4.69 4.34 4.31 4.05 4.08
Latvia 7.49 7.38 7.25 7.31 7.37 7.48 7.05 7.05 7.05 7.05 7.23 7.37
18 © The Economist Intelligence Unit Limited 2020DEMOCRACY INDEX 2019
A YEAR OF DEMOCRATIC SETBACKS AND POPULAR PROTEST
Table 3
Democracy Index 2006-19
2019 2018 2017 2016 2015 2014 2013 2012 2011 2010 2008 2006
Lithuania 7.50 7.50 7.41 7.47 7.54 7.54 7.54 7.24 7.24 7.24 7.36 7.43
Moldova 5.75 5.85 5.94 6.01 6.35 6.32 6.32 6.32 6.32 6.33 6.50 6.50
Montenegro 5.65 5.74 5.69 5.72 6.01 5.94 5.94 6.05 6.15 6.27 6.43 6.57
North Macedonia 5.97 5.87 5.57 5.23 6.02 6.25 6.16 6.16 6.16 6.16 6.21 6.33
Poland 6.62 6.67 6.67 6.83 7.09 7.47 7.12 7.12 7.12 7.05 7.30 7.30
Romania 6.49 6.38 6.44 6.62 6.68 6.68 6.54 6.54 6.54 6.60 7.06 7.06
Russia 3.11 2.94 3.17 3.24 3.31 3.39 3.59 3.74 3.92 4.26 4.48 5.02
Serbia 6.41 6.41 6.41 6.57 6.71 6.71 6.67 6.33 6.33 6.33 6.49 6.62
Slovakia 7.17 7.10 7.16 7.29 7.29 7.35 7.35 7.35 7.35 7.35 7.33 7.40
Slovenia 7.50 7.50 7.50 7.51 7.57 7.57 7.88 7.88 7.76 7.69 7.96 7.96
Tajikistan 1.93 1.93 1.93 1.89 1.95 2.37 2.51 2.51 2.51 2.51 2.45 2.45
Turkmenistan 1.72 1.72 1.72 1.83 1.83 1.83 1.72 1.72 1.72 1.72 1.72 1.83
Ukraine 5.90 5.69 5.69 5.70 5.70 5.42 5.84 5.91 5.94 6.30 6.94 6.94
Uzbekistan 2.01 2.01 1.95 1.95 1.95 2.45 1.72 1.72 1.74 1.74 1.74 1.85
average 5.42 5.42 5.40 5.43 5.55 5.58 5.53 5.51 5.50 5.55 5.67 5.76
Argentina 7.02 7.02 6.96 6.96 7.02 6.84 6.84 6.84 6.84 6.84 6.63 6.63
Bolivia 4.84 5.70 5.49 5.63 5.75 5.79 5.79 5.84 5.84 5.92 6.15 5.98
Brazil 6.86 6.97 6.86 6.90 6.96 7.38 7.12 7.12 7.12 7.12 7.38 7.38
Chile 8.08 7.97 7.84 7.78 7.84 7.80 7.80 7.54 7.54 7.67 7.89 7.89
Colombia 7.13 6.96 6.67 6.67 6.62 6.55 6.55 6.63 6.63 6.55 6.54 6.40
Costa Rica 8.13 8.07 7.88 7.88 7.96 8.03 8.03 8.10 8.10 8.04 8.04 8.04
Cuba 2.84 3.00 3.31 3.46 3.52 3.52 3.52 3.52 3.52 3.52 3.52 3.52
Dominican Republic 6.54 6.54 6.66 6.67 6.67 6.67 6.74 6.49 6.20 6.20 6.20 6.13
Ecuador 6.33 6.27 6.02 5.81 5.87 5.87 5.87 5.78 5.72 5.77 5.64 5.64
El Salvador 6.15 5.96 6.43 6.64 6.64 6.53 6.53 6.47 6.47 6.47 6.40 6.22
Guatemala 5.26 5.60 5.86 5.92 5.92 5.81 5.81 5.88 5.88 6.05 6.07 6.07
Guyana 6.15 6.67 6.46 6.25 6.05 5.91 6.05 6.05 6.05 6.05 6.12 6.15
Haiti 4.57 4.91 4.03 4.02 3.94 3.82 3.94 3.96 4.00 4.00 4.19 4.19
Honduras 5.42 5.63 5.72 5.92 5.84 5.84 5.84 5.84 5.84 5.76 6.18 6.25
Jamaica 6.96 7.02 7.29 7.39 7.39 7.39 7.39 7.39 7.13 7.21 7.21 7.34
Mexico 6.09 6.19 6.41 6.47 6.55 6.68 6.91 6.90 6.93 6.93 6.78 6.67
Nicaragua 3.55 3.63 4.66 4.81 5.26 5.32 5.46 5.56 5.56 5.73 6.07 5.68
Panama 7.05 7.05 7.08 7.13 7.19 7.08 7.08 7.08 7.08 7.15 7.35 7.35
Paraguay 6.24 6.24 6.31 6.27 6.33 6.26 6.26 6.26 6.40 6.40 6.40 6.16
Peru 6.60 6.60 6.49 6.65 6.58 6.54 6.54 6.47 6.59 6.40 6.31 6.11
Suriname 6.98 6.98 6.76 6.77 6.77 6.77 6.77 6.65 6.65 6.65 6.58 6.52
Trinidad and Tobago 7.16 7.16 7.04 7.10 7.10 6.99 6.99 6.99 7.16 7.16 7.21 7.18
Uruguay 8.38 8.38 8.12 8.17 8.17 8.17 8.17 8.17 8.17 8.10 8.08 7.96
Venezuela 2.88 3.16 3.87 4.68 5.00 5.07 5.07 5.15 5.08 5.18 5.34 5.42
average 6.13 6.24 6.26 6.33 6.37 6.36 6.38 6.36 6.35 6.37 6.43 6.37
19 © The Economist Intelligence Unit Limited 2020DEMOCRACY INDEX 2019
A YEAR OF DEMOCRATIC SETBACKS AND POPULAR PROTEST
Table 3
Democracy Index 2006-19
2019 2018 2017 2016 2015 2014 2013 2012 2011 2010 2008 2006
Afghanistan 2.85 2.97 2.55 2.55 2.77 2.77 2.48 2.48 2.48 2.48 3.02 3.06
Australia 9.09 9.09 9.09 9.01 9.01 9.01 9.13 9.22 9.22 9.22 9.09 9.09
Bangladesh 5.88 5.57 5.43 5.73 5.73 5.78 5.86 5.86 5.86 5.87 5.52 6.11
Bhutan 5.30 5.30 5.08 4.93 4.93 4.87 4.82 4.65 4.57 4.68 4.30 2.62
Cambodia 3.53 3.59 3.63 4.27 4.27 4.78 4.60 4.96 4.87 4.87 4.87 4.77
China 2.26 3.32 3.10 3.14 3.14 3.00 3.00 3.00 3.14 3.14 3.04 2.97
Fiji 5.85 5.85 5.85 5.64 5.69 5.61 3.61 3.67 3.67 3.62 5.11 5.66
Hong Kong 6.02 6.15 6.31 6.42 6.50 6.46 6.42 6.42 5.92 5.92 5.85 6.03
India 6.90 7.23 7.23 7.81 7.74 7.92 7.69 7.52 7.30 7.28 7.80 7.68
Indonesia 6.48 6.39 6.39 6.97 7.03 6.95 6.82 6.76 6.53 6.53 6.34 6.41
Japan 7.99 7.99 7.88 7.99 7.96 8.08 8.08 8.08 8.08 8.08 8.25 8.15
Laos 2.14 2.37 2.37 2.37 2.21 2.21 2.21 2.32 2.10 2.10 2.10 2.10
Malaysia 7.16 6.88 6.54 6.54 6.43 6.49 6.49 6.41 6.19 6.19 6.36 5.98
Mongolia 6.50 6.50 6.50 6.62 6.62 6.62 6.51 6.35 6.23 6.36 6.60 6.60
Myanmar 3.55 3.83 3.83 4.20 4.14 3.05 2.76 2.35 1.77 1.77 1.77 1.77
Nepal 5.28 5.18 5.18 4.86 4.77 4.77 4.77 4.16 4.24 4.24 4.05 3.42
New Zealand 9.26 9.26 9.26 9.26 9.26 9.26 9.26 9.26 9.26 9.26 9.19 9.01
North Korea 1.08 1.08 1.08 1.08 1.08 1.08 1.08 1.08 1.08 1.08 0.86 1.03
Pakistan 4.25 4.17 4.26 4.33 4.40 4.64 4.64 4.57 4.55 4.55 4.46 3.92
Papua New Guinea 6.03 6.03 6.03 6.03 6.03 6.03 6.36 6.32 6.32 6.54 6.54 6.54
Philippines 6.64 6.71 6.71 6.94 6.84 6.77 6.41 6.30 6.12 6.12 6.12 6.48
Singapore 6.02 6.38 6.32 6.38 6.14 6.03 5.92 5.88 5.89 5.89 5.89 5.89
South Korea 8.00 8.00 8.00 7.92 7.97 8.06 8.06 8.13 8.06 8.11 8.01 7.88
Sri Lanka 6.27 6.19 6.48 6.48 6.42 5.69 5.69 5.75 6.58 6.64 6.61 6.58
Taiwan 7.73 7.73 7.73 7.79 7.83 7.65 7.57 7.57 7.46 7.52 7.82 7.82
Thailand 6.32 4.63 4.63 4.92 5.09 5.39 6.25 6.55 6.55 6.55 6.81 5.67
Timor Leste 7.19 7.19 7.19 7.24 7.24 7.24 7.24 7.16 7.22 7.22 7.22 6.41
Vietnam 3.08 3.08 3.08 3.38 3.53 3.41 3.29 2.89 2.96 2.94 2.53 2.75
average 5.67 5.67 5.63 5.74 5.74 5.70 5.61 5.56 5.51 5.53 5.58 5.44
Algeria 4.01 3.50 3.56 3.56 3.95 3.83 3.83 3.83 3.44 3.44 3.32 3.17
Bahrain 2.55 2.71 2.71 2.79 2.79 2.87 2.87 2.53 2.92 3.49 3.38 3.53
Egypt 3.06 3.36 3.36 3.31 3.18 3.16 3.27 4.56 3.95 3.07 3.89 3.90
Iran 2.38 2.45 2.45 2.34 2.16 1.98 1.98 1.98 1.98 1.94 2.83 2.93
Iraq 3.74 4.06 4.09 4.08 4.08 4.23 4.10 4.10 4.03 4.00 4.00 4.01
Israel 7.86 7.79 7.79 7.85 7.77 7.63 7.53 7.53 7.53 7.48 7.48 7.28
Jordan 3.93 3.93 3.87 3.96 3.86 3.76 3.76 3.76 3.89 3.74 3.93 3.92
Kuwait 3.93 3.85 3.85 3.85 3.85 3.78 3.78 3.78 3.74 3.88 3.39 3.09
Lebanon 4.36 4.63 4.72 4.86 4.86 5.12 5.05 5.05 5.32 5.82 5.62 5.82
Libya 2.02 2.19 2.32 2.25 2.25 3.80 4.82 5.15 3.55 1.94 2.00 1.84
20 © The Economist Intelligence Unit Limited 2020DEMOCRACY INDEX 2019
A YEAR OF DEMOCRATIC SETBACKS AND POPULAR PROTEST
Table 3
Democracy Index 2006-19
2019 2018 2017 2016 2015 2014 2013 2012 2011 2010 2008 2006
Morocco 5.10 4.99 4.87 4.77 4.66 4.00 4.07 4.07 3.83 3.79 3.88 3.90
Oman 3.06 3.04 3.04 3.04 3.04 3.15 3.26 3.26 3.26 2.86 2.98 2.77
Palestine 3.89 4.39 4.46 4.49 4.57 4.72 4.80 4.80 4.97 5.44 5.83 6.01
Qatar 3.19 3.19 3.19 3.18 3.18 3.18 3.18 3.18 3.18 3.09 2.92 2.78
Saudi Arabia 1.93 1.93 1.93 1.93 1.93 1.82 1.82 1.71 1.77 1.84 1.90 1.92
Sudan 2.70 2.15 2.15 2.37 2.37 2.54 2.54 2.38 2.38 2.42 2.81 2.90
Syria 1.43 1.43 1.43 1.43 1.43 1.74 1.86 1.63 1.99 2.31 2.18 2.36
Tunisia 6.72 6.41 6.32 6.40 6.72 6.31 5.76 5.67 5.53 2.79 2.96 3.06
UAE 2.76 2.76 2.69 2.75 2.75 2.64 2.52 2.58 2.58 2.52 2.60 2.42
Yemen 1.95 1.95 2.07 2.07 2.24 2.79 2.79 3.12 2.57 2.64 2.95 2.98
average 3.53 3.54 3.54 3.56 3.58 3.65 3.68 3.73 3.62 3.43 3.54 3.53
Angola 3.72 3.62 3.62 3.40 3.35 3.35 3.35 3.35 3.32 3.32 3.35 2.41
Benin 5.09 5.74 5.61 5.67 5.72 5.65 5.87 6.00 6.06 6.17 6.06 6.16
Botswana 7.81 7.81 7.81 7.87 7.87 7.87 7.98 7.85 7.63 7.63 7.47 7.60
Burkina Faso 4.04 4.75 4.75 4.70 4.70 4.09 4.15 3.52 3.59 3.59 3.60 3.72
Burundi 2.15 2.33 2.33 2.40 2.49 3.33 3.41 3.60 4.01 4.01 4.51 4.51
Cabo Verde 7.78 7.88 7.88 7.94 7.81 7.81 7.92 7.92 7.92 7.94 7.81 7.43
Cameroon 2.85 3.28 3.61 3.46 3.66 3.41 3.41 3.44 3.41 3.41 3.46 3.27
Central African Republic 1.32 1.52 1.52 1.61 1.57 1.49 1.49 1.99 1.82 1.82 1.86 1.61
Chad 1.61 1.61 1.50 1.50 1.50 1.50 1.50 1.62 1.62 1.52 1.52 1.65
Comoros 3.15 3.71 3.71 3.71 3.71 3.52 3.52 3.52 3.52 3.41 3.58 3.90
Congo (Brazzaville) 3.11 3.31 3.25 2.91 2.91 2.89 2.89 2.89 2.89 2.89 2.94 3.19
Côte d’Ivoire 4.05 4.15 3.93 3.81 3.31 3.53 3.25 3.25 3.08 3.02 3.27 3.38
Democratic Republic of Congo 1.13 1.49 1.61 1.93 2.11 1.75 1.83 1.92 2.15 2.15 2.28 2.76
Djibouti 2.77 2.87 2.76 2.83 2.90 2.99 2.96 2.74 2.68 2.20 2.37 2.37
Equatorial Guinea 1.92 1.92 1.81 1.70 1.77 1.66 1.77 1.83 1.77 1.84 2.19 2.09
Eritrea 2.37 2.37 2.37 2.37 2.37 2.44 2.40 2.40 2.34 2.31 2.31 2.31
eSwatini 3.14 3.03 3.03 3.03 3.09 3.09 3.20 3.20 3.26 2.90 3.04 2.93
Ethiopia 3.44 3.35 3.42 3.60 3.83 3.72 3.83 3.72 3.79 3.68 4.52 4.72
Gabon 3.61 3.61 3.61 3.74 3.76 3.76 3.76 3.56 3.48 3.29 3.00 2.72
Gambia 4.33 4.31 4.06 2.91 2.97 3.05 3.31 3.31 3.38 3.38 4.19 4.39
Ghana 6.63 6.63 6.69 6.75 6.86 6.33 6.33 6.02 6.02 6.02 5.35 5.35
Guinea 3.14 3.14 3.14 3.14 3.14 3.01 2.84 2.79 2.79 2.79 2.09 2.02
Guinea-Bissau 2.63 1.98 1.98 1.98 1.93 1.93 1.26 1.43 1.99 1.99 1.99 2.00
Kenya 5.18 5.11 5.11 5.33 5.33 5.13 5.13 4.71 4.71 4.71 4.79 5.08
Lesotho 6.54 6.64 6.64 6.59 6.59 6.66 6.66 6.66 6.33 6.02 6.29 6.48
Liberia 5.45 5.35 5.23 5.31 4.95 4.95 4.95 4.95 5.07 5.07 5.25 5.22
Madagascar 5.64 5.22 5.11 5.07 4.85 4.42 4.32 3.93 3.93 3.94 5.57 5.82
Malawi 5.50 5.49 5.49 5.55 5.55 5.66 6.00 6.08 5.84 5.84 5.13 4.97
Mali 4.92 5.41 5.64 5.70 5.70 5.79 5.90 5.12 6.36 6.01 5.87 5.99
21 © The Economist Intelligence Unit Limited 2020You can also read