Department Application Bronze and Silver Award - Liverpool ...
←
→
Page content transcription
If your browser does not render page correctly, please read the page content below
Department Application Bronze and Silver Award
ATHENA SWAN BRONZE DEPARTMENT AWARDS
Recognise that in addition to institution-wide policies, the department is working
to promote gender equality and to identify and address challenges particular to the
department and discipline.

ATHENA SWAN SILVER DEPARTMENT AWARDS
In addition to the future planning required for Bronze department recognition,
Silver department awards recognise that the department has taken action in
response to previously identified challenges and can demonstrate the impact
of the actions implemented.
Note: Not all institutions use the term ‘department’. There are many equivalent
academic groupings with different names, sizes and compositions. The definition
of a ‘department’ can be found in the Athena SWAN awards handbook.

COMPLETING THE FORM
DO NOT ATTEMPT TO COMPLETE THIS APPLICATION FORM WITHOUT
READING THE ATHENA SWAN AWARDS HANDBOOK.
This form should be used for applications for Bronze and Silver department awards.
You should complete each section of the application applicable to the award level
you are applying for.

      Additional areas for Silver applications are highlighted
      throughout the form: 5.2, 5.4, 5.5(iv)

If you need to insert a landscape page in your application, please copy and paste the
template page at the end of the document, as per the instructions on that page. Please
do not insert any section breaks as to do so will disrupt the page numbers.

WORD COUNT
The overall word limit for applications are shown in the following table.
There are no specific word limits for the individual sections and you may distribute
words over each of the sections as appropriate. At the end of every section, please
state how many words you have used in that section.
We have provided the following recommendations as a guide.

                                                                                         2
Department application                         Bronze    Silver

Word limit                                      10,500   12,000
 Recommended word count
 1.Letter of endorsement                          500       500
 2.Description of the department                  500       500
 3. Self-assessment process                      1,000     1,000
 4. Picture of the department                    2,000     2,000
 5. Supporting and advancing women’s careers     6,000     6,500
 6. Case studies                                  n/a      1,000
 7. Further information                           500       500

                                                                   3
Name of institution               Liverpool John Moores
                                                                  LJMU
                                  University
Department                        School of Sport and Exercise
                                                                  SES
                                  Sciences
Focus of department               STEMM
Date of application               30TH April 2019

Award Level                       Bronze
Institution Athena SWAN           Date: 2018                      Level: Bronze
award
Contact for application           Professor David Richardson
Must be based in the department

Email                             D.J.Richardson@ljmu.ac.uk

Telephone                         0151 904 6283

Departmental website              https://www.ljmu.ac.uk/about-
                                  us/faculties/faculty-of-
                                  science/School-of-sport-and-
                                  exercise-sciences

                                                                                  4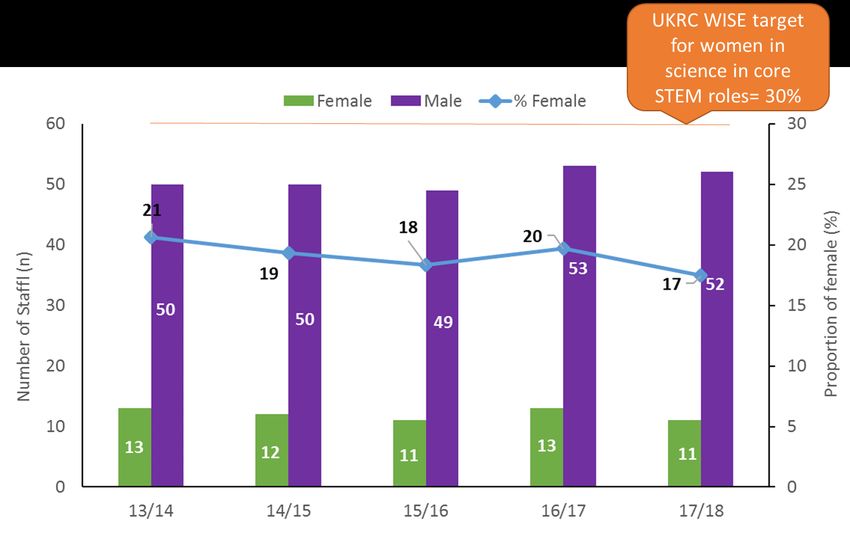
1. LETTER OF ENDORSEMENT FROM THE HEAD OF DEPARTMENT
Recommended word count: Bronze: 500 words | Silver: 500 words

Equality Charters Manager
Equality Challenge Unit
7th Floor, Queens House
55/56 Lincoln’s Inn Fields
London WC2A 3LJ

                                                                          29th April 2019

Dear Ruth Gilligan, Sarah Dickinson-Hyams and your team,

I am delighted to provide my fullest support for my School’s application for the Athena
SWAN Bronze Award. As the Head of School, I am committed to the advancement of
gender equality, representation, progression and success for all. Specifically, I am
committed to the advancement of careers for women in science, including our students,
and our staff, by cultivating a supportive and progressive infrastructure that enables
individuals to fulfil their potential. Furthermore, we are committed to promoting and
embedding a culture of equality, diversity and inclusivity in which all staff enjoy being
part of and have the opportunity to grow, progress and ultimately do the best that they
can for our students, our colleagues and our partners.This application is evidence of my
personal commitment, but also our collective commitment as a department.

Our Athena Swan journey began in 2015, but due to some changes in staffing the original
Self-Assessment Team (SAT) was disbanded and another created in its wake in August
2018. This newly forged team continued with our self assessment process and generation
of our application. The current team comprises an array of committed staff from across
the School and demonstrates our pursuit of an equality, diversity and inclusivity agenda
alongside the provision of a diverse and eclectic team to drive and realise our equality
ambitions as a central part of our day-to-day business. I have led both teams and in doing
so have witnessed the positive impact the self-assessment process has had upon all
aspects of life within the department.

Our application reflects a great deal of hard work from our Athena SWAN SAT and the
progress that we have already made. The process itself has stimulated lively and healthy
debate and discussion amongst all members of the School. The ongoing feedback to staff
related to progress with the application has provided an opportunity for reflection, check
and challenge to our existing working practices and culture. The debate and discussion
have also helped to provide a framework for future action as we strive to achieve greater
equality, diversity and inclusivity within the School. The creation and collective
agreement around our action plan identifies how we seek to change and/or enhance
current practice. We have greatly benefitted from this collective self-assessment process,

                                                                                             5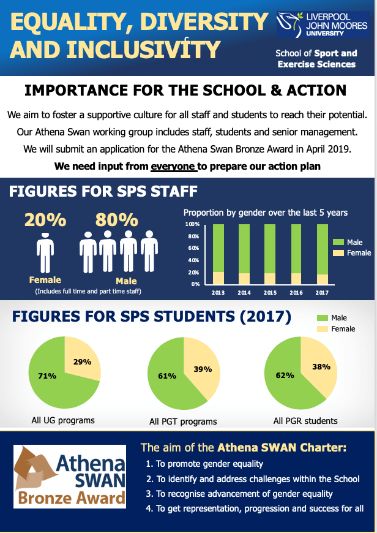
and will only continue to do so with the implementation of our action plan, alongside
continual monitoring.

The self assessment process has been invaluable in highlighting those areas where
improvements in exisiting practices is required. To this end, the information presented in
the application (including qualitative and quantitative data) is an honest, accurate and
true representation of the institution/department.

Yours faithfully,

Professor David Richardson
Head of School, Sport and Exercise Science

432 (500 words)

                                         School of Sport and Exercise Sciences
                                       Tom Reilly Building, Byrom Street Campus,
                                                   Liverpool, L3 3AF
                                        Tel: 0151 904 6283 Fax: 0151 904 6284

                                                                                             6
ABBREVIATIONS

AP          Action Plan
ASP         Applied Sport Psychology
B&B         Brain and Behaviour
BIOMEX      Biomechanics
CHS         Cardiovascular Health Sciences
EDI         Equality, diversity & inclusivity
ECR         Early Career Researcher
EMARG       Exercise Metabolism and Adaptation Research Group
FeX         Football Exchange
HoR         Head of RISES
HoS         Head of School
L/SL        Lecturer/senior lecturer
PaD         Psychology and Development
PAEx        The Physical Activity Exchange
PDPR        Professional Development Practice Review
PGR         Post-graduate researcher
PGT         Taught post-graduate student
POD         People and Organisational Development Unit
PS          Professional Services
RISES       Research Institute of Sport and Exercise Sciences
RSO         Research Support Office
REF         Research Excellence Framework
S&F         Science and Football
SAT         Self-Assessment Team (Athena SWAN)
SES         Sport and Exercise Sciences
SMT         Senior Management Team
STEM        Science Technology Engineering and Maths
VC          Vice Chancellor

                                                                7
2. DESCRIPTION OF THE DEPARTMENT
Recommended word count: Bronze: 500 words | Silver: 500 words
The School of Sport and Exercise Sciences is one of three Schools based within the Faculty
of Science at Liverpool John Moores University. Established in 1975, the School was the
first to host a single honours degree programme in Sport Science, and over 40 years later
continues to be at the forefront of innovation and development in teaching, research and
applied practice. The School is recognised as ‘world leading’ and is currently ranked as
the ninth best Sport and Exercise Science department in the world. The School employs
seventy-one academic and research staff (F=14, M=57; Table 1), who are line managed
within the department, and ten administrative/support staff (F=4, M=6), who are line
managed at faculty level.
Table 1. Current composition of the School of Sport and Exercise Sciences 2018/2019.
Male Female % Female Total
Academic Staff 50 11 18 61
Research Staff 7 3 30 10
Professional and Support Staff 6 4 40 10
Foundation Students 15 7 23 22
Undergraduate Students 613 214 26 827
Postgraduate Taught Students 102 59 37 161
Postgraduate Research Students 103 52 33 157
At any given time, the School supports more than 1200 students across levels 3-8, with a
current post honours degree research community of 157 students. The School offers
three BSc Courses, five MSc Courses and two professional doctorates. The details of the
courses we offer are in the student data section.
With the exception of one member of academic staff, all academic staff are on teaching
and research contracts and are ‘research active’ with most staff generating both
fundamental and applied research, together with knowledge exchange, consultancy and
outreach. The Research Institute for Sport and Exercise Sciences (RISES) provides a core
operational structure for research and is organised into five core discipline areas, and
two themes exchanges (Table 2).
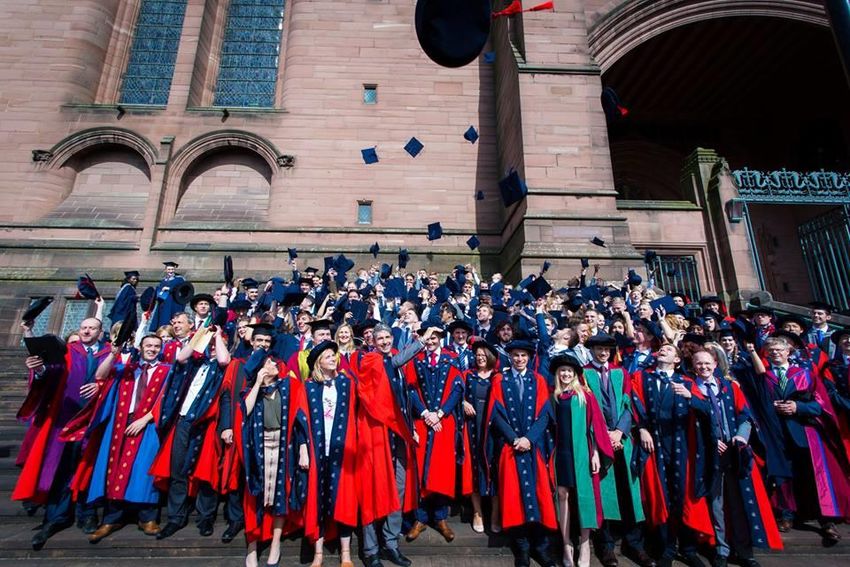
8Figure 1. Staff and students from School of Sport and Exercise Sciences at a recent
graduation ceremony.
Table 2. Research group overview and group leads.
Research Group Group Lead
Psychology and Development (PaD) Dr David Tod
Exercise Metabolism and Adaptation Research
Professor Anton Wagenmakers
Group (EMARG)
Biomechanics (BIOMEX) Professor Constantinos Maganaris
Brain and Behaviour (B&B) Professor Simon Bennett
Cardiovascular Health Sciences (CHS) Professor Dick Thijssen
Education and training provision is underpinned by a research-informed philosophy and
applied practice focus. World-class facilities and strong links with partners in the sports,
fitness, exercise, health and medical sectors support staff and students in realising our
ambition to challenge the status quo in research and teaching. The majority of the
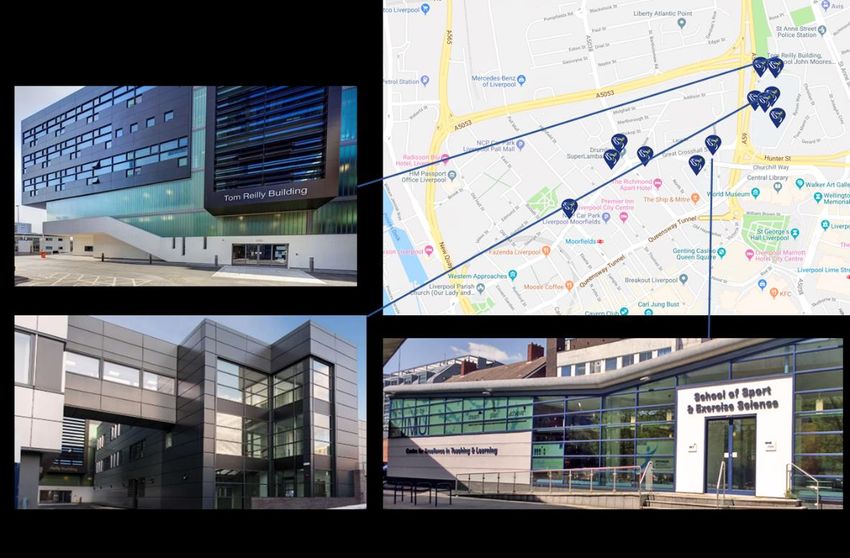
department staff are based in the Tom Reilly Building, a purpose-built facility which
opened in 2010. Some EMARG staff are based in an adjacent purpose-built Life Sciences
building with access to centralised wet labs and imaging facilities, and the majority of
staff in the two Exchanges based in a purpose-built Teaching and Learning facility, all of
which are located on the City Centre Byrom Street Campus, some 0.3miles apart (5
minute walk) (see Figure 2).
9Figure 2. Geographical location of School of Sport and Exercise Sciences.
School operating structures are summarised below. Eight staff members comprise the
Strategic Leadership team (F=2; M=6). Four Subject leaders have line management
responsibility for academic and research staff within their discipline of expertise, (n=4;
F=1, M=3). The HoS has line management responsibility for some staff. There are
strategic leads for core Schools agendas (n=5; F=2; M=3), to demonstrate the schools
commitment to the EDI agenda a Strategic Lead for EDI will be created (action F1). In
addition, each taught programme has a programme leader (n=11; F=1; M=10), and each
research or exchange group in RISES also has a lead (Table 2; n=7; F=1; M=6).
Strategic & Operational Approach:
To be recognised globally as a world leading sport and exercise science department through our
continual pursuit of the fusion of high level science within applied environments…
Head of RISES Head of
External
International Head of Academic Professional
engagement Research Head of T&L
Lead Physiology Regs, PaD, practice lead
lead Group leads Biomex
Civic & Global Impactful research and Outstanding student Excellence in
Engagement Scholarship Experience Education
Figure 3. School of Sport and Exercise Science operating structure. Line management
responsibilities lie with the the subject leads, or ‘Heads of..’ Strategic leaders do not
have any line management responsibilities.
10There is a robust consultation and feedback process that is inclusive of all staff and
specific groups that is diarised and communicated via the School calendar at the onset
of each academic year (Figure 4).
Figure 4. School consultation process that feeds into the Faculty Management Team.
499 (500 words)
113. THE SELF-ASSESSMENT PROCESS
Recommended word count: Bronze: 1000 words | Silver: 1000 words
(i) description of the self-assessment team
Our Athena Swan journey began in 2015, however due to some changes in staffing the
current Self-Assessment Team (SAT) was established in August 2018 and continued the
self-assessment process. Our SAT is chaired by the HoS and comprises 21 staff and
student members (F=10, M=11). The HoS is also a member of the University-wide Athena
SWAN Working Group. Initially, departmental staff were invited to register their interest
in membership. Subsequently, specific members of the department were invited to the
SAT with a view to representing, as far as was possible, diversity in the school (with
respect to gender, career stage/experience, departmental role, level of caring
responsibility). The SAT was introduced to the whole department during the all staff away
day in September 2018, when the intention to submit for Bronze Award in April 2019 was
announced.
Table 3. SAT Membership
TABLE REMOVED FOR SHARING
Membership will be reviewed annually (action F7).
NB Prof Zoe Knowles joined the SAT in March 2019 due to changes in workload.
*Moni Akinsanya and Holly Nicholls, University Equality, Diversity and Inclusion Manager and Support
Officer and advisors to SAT
(ii) an account of the self-assessment process
Dr Rebecca Murphy, was appointed during summer 2018 and developed a timeline
schedule document in preparation for submission with goals and milestones.
Monthly meetings were organised and diarised (September–March; agendas and
minutes produced for all meetings). Engagement to gain wider staff perspectives, and
awareness raising activities, were identified and agreed upon as a priority. These goals
were approached in a number of ways that are represented below in chronological order
to reflect the development of these activities. The narrative includes details of
communication, internal consultation, development of the submission and action plan,
and external consultation.
Staff consultation
All staff and PGRs in the School were invited, via email, to take part in focus groups
facilitated by an independent consultant, to discuss experiences of working in the School.
In particular, underrepresented groups/individuals were encouraged to take part in these
focus’ groups and thus the compositions are not wholly reflective of departmental
population. In total fourteen staff and eight post graduate research students volunteered
to take part. The focus groups ran as a standalone PG research student group (n=8 F=5,
M=3) and two staff groups (n=6 F=4, M=3; n=7 F=3, M=4).
The external consultant who conducted the focus groups was invited to a staff forum in
December 2018 to discuss her findings and to raise awareness of the importance of
equality and diversity. An infographic (Figure 4) was developed and circulated to all staff,
12PGRs and UG student representatives at the Board of Studies, which included key
quantitative data. This infographic was developed in order to raise awareness and
encourage involvement from the whole School in the self-assessment process. It also
served as a primer for the feedback session in the staff forum. During this staff forum,
preliminary quantitative data figures were also shared with staff.
Figure 5. Awareness raising infographic featuring key quantitative data representing
staff and student gender balance.
In February 2019 all SAT members were tasked to engage a small group of staff to
determine staff and PGR student perspectives with respect to the School Athena SWAN
Application and gender balance within the School and STEMM more broadly. Spcific
questions were posed to staff and then responses were inserted into confidential
documents and qualitatively analysed by appropriate SAT members.
On International Women’s Day a staff and student (UG and PG) survey was launched by
the Director of School. This was launched as a further effort to ensure that the self-
assessment process represented the perspectives of the entire department, to continue
to raise awareness, and encourage reflection on current working practices in the School.
Internal and external consultation
Between February to April 2019, Professor David Richardson, HoS, oversaw the
application process. Sections of the form were allocated lead authors, who assigned sub-
groups ensuring equal and representative contribution (Table 3). During the SAT
meetings, issues and ideas were discussed and staff and student data that had been
collected and analysed (qualitative and quantitative) were debated and interpreted,
collectively. As the assessment process progressed, discussions informed the action plan.
13Members of the SAT have been involved throughout data collation, action plan drafting
and application process as a whole, as well as in awareness raising and promotion of our
EDI agenda more widely within the School. The entire SAT was involved in the drafting of
this application, and the LJMU EDI team and School SMT provided comments in detail on
drafts. Following this, the application was sent out to external review and wider
consultation (Ms Rachel Tobbell, Focus Group Consultant; Dr Sean McWhinnie,
Independent consultant; Dr Sharon Dixon, Critical friend). Finally, the action plan was
debated and signed off by the School SMT.
(iii) plans for the future of the self-assessment team
SES is keen to further increase momentum and further cultivate the EDI remit to address
other areas of inequality (intersectionality), in addition to gender. The group will continue
to meet every other month (diarised into core School calendar), with sub-groups meeting
in between feeding into the wider SAT. Importantly, membership will be reviewed
annually. We seek to establish an annual cycle of business for the SAT which includes
regular items such as monitoring the action plan, a cycle of reviewing updated datasets
as new information becomes available, reviewing new reports and recommendations for
action as they are produced, and a formal annual review of the action plan. In that action
plan review, completed actions can be signed off, ongoing actions can be updated, and,
as appropriate, new actions can be added. The new edition of the action plan can then
be published and circulated.
SES plans to appoint a strategic lead for EDI. This individual will formulate a ‘within
School’ EDI group that will be tasked with driving an EDI agenda, and will encompass the
SAT. Key staff from the SAT have been identified to drive this agenda (RM, TS, NH) and
have been encouraged, and supported, to attend equality and diversity
workshops/courses (Table 4). Knowledge gained from these will be fed directly back into
this new working group, and will inform the School’s EDI agenda moving forward.
Table 4. Overview of attendance at institutional equality and diversity events.
Date Event Staff in attendance
November 2018 LJMU BAME Staff Network Launch Dr Nicola Hopkins
Event
February 2019 Intercultural Competence – Dr Rebecca Murphy
Unconscious Bias
December 2018 LJMU | International Day of Dr Nicola Hopkins and Dr
Persons with Disabilities Victoria Sprung
February 2019 LJMU LGBT History Month Event Dr Nicola Hopkins and Dr
Victoria Sprung
May 2019 Women in STEM conference 2019 Dr Victoria Sprung
950 (1000 words)
144. PICTURE OF A PICTURE OF THE DEPARTMENT
Recommended word count: Bronze: 2000 words | Silver: 2000 words
4.1. Student data
(i) Numbers of men and women on access or foundation courses
The 2018/19 academic cycle was the first for the foundation courses in the Faculty of
Science.
(ii) Numbers of undergraduate students by gender
The School offers three BSc courses; SES, ASP, and S&F.
Figure 6. Full time undergraduate students and proportion of students who are female.
National benchmark for proportion of full time female UG students in sport sciences
(HESA 2017-18)=32%.
The proportion of females is ~24%, notably below the national benchmark. The number
of undergraduate students studying part time between 2013-2018 was; SES- 14 male, 3
female; ASP- 2 male, 0 female; S&F- 0 female, 5 male. Examination of the data at
programme level provides further insight.
Most students are registered for the SES programme (~70%). Approximately 1 in 4
students are female.
In 2017-18 15% of our students were registered for ASP, of whom 34% were female.
The psychological focus of this course seems to be more attractive to females.
In 2017-18, 14% of our UG students were registered on S&F of whom 9% were
female.
There is clearly scope to increase the representation of females on all programme(actions
A1, A2).
15A)
BSc Sport and Exercise
Sciences
B)
BSc Applied Sport Psychology
C)
BSc Science and Football
Figure 7. Fulltime student headcounts and proportion of students who are female on A)
BSc SES, B) BSc Applied Sport Psychology and C) BSc Science and Football.
16Table 5. Proportion of total student headcount on each course by year, gender and
ethnicity
Proportion of students (%)
Ethnicity
Chinese
Gender
Course
Mixed
White
Other
Asian
Black
Arab
Year
race
F 0 0 0 0 3 0 97
14/15
M 0 3 3 2 8 0 85
F 0 0 3 0 9 0 88
15/16
M 0 3 3 1 8 0 85
ASP
F 0 3 3 0 11 0 84
16/17
M 0 3 3 0 3 0 91
F 0 5 3 0 8 0 85
17/18
M 1 1 6 0 6 0 84
F 0 7 0 0 7 0 86
14/15
M 0 4 2 1 8 1 84
F 0 6 0 0 6 0 88
15/16
M 0 1 4 1 4 1 88
S&F
F 0 8 0 0 0 0 92
16/17
M 0 2 3 1 4 2 88
F 0 0 0 0 0 0 100
17/18
M 0 4 2 0 3 1 90
F 0 1 2 0 2 0 96
14/15
M 0 4 2 1 3 0 89
F 0 1 3 0 3 0 94
15/16
M 0 3 3 0 5 1 88
SES
F 0 1 2 0 3 0 94
16/17
M 0 3 2 0 5 0 89
F 0 2 1 0 2 0 95
17/18
M 0 2 3 0 5 0 89
Ninety percent of students enrolled are white, varying between 85-100% by gender, year
and course. There are no clear trends over time. The current ethnic diversity of the course
reflects the local population of Liverpool (White: 91%, Asian: 3%, Black: 1.9% Mixed race:
2%, Chinese: 1.1%, Other: 1.0%).
17Table 6. Number of applications, offers, accepted, enrolled and conversion rates on BSc Sport and Exercise Sciences by year and sex.
Applications Offers to Acceptance to Applications to
to offers acceptance enrolled entries
Applications (N) Offered (N) Accepted (N) Enrolled (N)
conversion conversion conversion rates conversion rate
rate (%) rate (%) (%) (%)
Female 300 284 64 62 95 23 97 21
2013 Male 958 863 194 183 90 22 94 19
%F 24 25 25 25
Female 349 337 60 57 97 18 95 16
2014 Male 1029 934 210 199 91 22 95 19
%F 25 27 22 22
Female 319 303 57 55 95 19 96 17
2015 Male 975 906 204 194 93 23 95 20
%F 25 25 22 22
Female 291 276 62 59 95 22 95 20
2016 Male 835 765 187 179 92 24 96 21
%F 26 27 25 25
Female 303 290 80 78 96 28 98 26
2017 Male 840 753 177 172 90 24 97 20
%F 27 28 31 31
Female 1562 1490 323 311 95 22 96 20
Overall Male 4637 4221 972 927 91 23 95 20
%F 25 26 25 25Table 7. Number of applications, offers, accepted, enrolled and conversion rates on BSc Applied Sports Psychology by year and sex.
Applications to Offers to Acceptance to Applications to
Applications Offered Accepted Enrolled
offers conversion acceptance enrolled conversion entries conversion
(N) (N) (N) (N)
rate (%) conversion rate (%) rates (%) rate (%)
Female 57 54 15 15 95 28 100 26
2013 Male 143 121 28 26 85 23 93 18
%F 29 31 35 37
Female 49 45 8 7 92 18 88 14
2014 Male 138 121 27 26 88 22 96 19
%F 26 27 23 21
Female 53 47 13 12 89 28 92 23
2015 Male 149 127 33 30 85 26 91 20
%F 26 27 28 29
Female 72 64 16 16 89 25 100 22
2016 Male 145 135 31 29 93 23 94 20
%F 33 32 34 36
2017 Female 57 52 14 13 91 27 93 23
Male 145 128 33 32 88 26 97 22
%F 28 29 30 29
Female 288 262 66 63 91 25 95 22
Overall Male 720 632 152 143 88 24 94 20
%F 29 29 30 31
.Table 8. Number of applications, offers, accepted, enrolled and conversion rates on BSc Science and Football by year and sex.
Applications to Offers to Acceptance to Applications to
Applications Offered Accepted Enrolled
offers conversion acceptance enrolled conversion entries conversion
(N) (N) (N) (N)
rate (%) conversion rate (%) rates (%) rate (%)
Female 16 14 4 4 88 29 100 25
2013 Male 241 189 45 42 78 24 93 17
%F 6 7 8 9
Female 25 24 6 6 96 25 100 24
2014 Male 280 233 56 50 83 24 89 18
%F 8 9 10 11
Female 26 25 9 8 96 36 89 31
2015 Male 224 190 70 62 85 37 89 28
%F 10 12 11 11
Female 13 13 3 3 100 23 100 23
2016 Male 190 152 40 37 80 26 93 19
%F 6 8 7 8
Female 13 11 4 3 85 36 75 23
2017 Male 143 120 28 28 84 23 100 20
%F 8 8 13 10
Female 93 87 26 24 94 30 92 26
Overall Male 1078 884 239 219 82 27 92 20
%F 8 9 10 10For SES and ASP, the overall proportions of applicants are 25% and 29% female,
respectively. Females are more likely than males to receive offers, although the
difference is not significant. Rates of offer, acceptance and enrolment vary but are similar
by gender.
Females represent between 8% and 13% of applicants on S&F annually. Females seem
more likely to receive offers than males, however small numbers likely skew this trend.
There are no gender differences in acceptance or enrolment rate. Data from all courses
suggest the best way to increase female representation is to increase female applications
(action A1).
Admissions
All admissions staff undertake annual mandatory training on the University’s policy. The
School offers 7 Applicant days annually for potential students. Little consideration has
previously been given to gender of staff and students supporting these events, recently
highlighted by an attendee:“It just confirmed to me LJMU is the university for men.”
Our Strategic Lead for External Engagement and associated committee are reviewing
open day and marketing activity with a focus on attracting female attendees and
improving their experience (actions A1, A2).
21Table 9. Number and proportion of qualifications awarded by undergraduate degree, year and sex.
First 2.1 2.2 3rd HND/DipHE Other qualification Pass - Fallback Total %F obtaining
Course Year a qualification
F M %F F M %F F M %F F M %F F M %F F M %F F M %F
13/14 12 22 35 25 78 24 10 37 21 0 1 0 0 2 0 3 1 75 0 6 0 25
14/15 13 12 52 21 40 34 12 36 25 0 4 0 1 1 50 1 16 6 2 2 50 31
SES 15/16 11 24 31 23 65 26 16 32 33 2 1 67 0 4 0 1 11 8 0 3 0 27
16/17 11 21 34 30 64 32 9 37 20 0 3 0 0 6 0 2 6 25 0 0 0 28
17/18 16 25 39 21 65 24 9 44 17 0 6 0 0 0 0 0 0 0 0 0 0 26
13/14 1 0 100 6 9 40 2 5 29 0 0 0 0 2 0 0 0 0 0 1 0 35
14/15 2 2 50 3 7 30 1 3 25 0 0 0 0 1 0 0 1 0 1 1 50 32
ASP 15/16 4 1 80 6 11 35 2 10 17 0 0 0 0 1 0 0 2 0 0 0 0 32
16/17 2 4 33 4 5 44 3 7 30 0 0 0 0 0 0 0 1 0 0 0 0 35
17/18 3 2 60 4 11 27 3 6 33 0 2 0 0 0 0 0 0 0 0 0 0 32
13/14 0 2 0 1 9 10 0 9 0 0 1 0 0 2 0 0 3 0 0 3 0 3
14/15 0 3 0 2 10 17 1 10 9 0 0 0 0 0 0 0 3 0 1 0 100 10
S&F 15/16 0 4 0 1 13 7 3 18 14 0 0 0 0 0 0 0 2 0 0 0 0 10
16/17 0 2 0 0 25 0 3 7 30 0 0 0 0 1 0 0 1 0 0 0 0 7
17/18 2 7 22 1 21 5 1 8 11 0 4 0 0 0 0 0 0 0 0 1 0 9
Bench marking data for percentage of females obtaining a qualification in sciences 2017/18 = 38%.A)
B)
C)
Figure 8. Distribution of females and males across degree classes 2013-2018, A) Sport
and Exercise Sciences, B) Applied Sports Psychology, C) Science and Football. National
benchmark for proportion of sports science students achieving a first or 2.1 female = 75%,
male = 60%.
There were no gender differences in UCAS points by course between 2013-2018. On SES
and ASP, female students are more likely to achieve a first than male students, consistent
with national data. Our student survey suggests females may feel they must excel:
“…. it makes me wonder if I'll be one of the few females that stands out enough to have
a successful career”
23There are no gender differences in attainment on S&F, however females have lower
attainment than SES, ASP and the national benchmark. The programme leader suggests
females may feel isolated:
“….in L5 this year we have 2 females. When one went on leave of absence the other also
did. Part of the reason cited was she felt her only friend had gone. It is possible that this
has an impact.”
It is important we understand the experience and attainment of females on this course
(action A3). We identified a need to improve support offered to females (actions A4, F9).
BSc Sport and Exercise Sciences
BSc Applied Sport Psychology
BSc Science and Football
Figure 9. Retention rates of females and males between 2013-2018 on A) Sport and
Exercise Sciences, B) Applied Sports Psychology, C) Science and Football.
Retention rates in SES have increased by 10%, in line with a University directive to
improve retention rates. Individual course retention rates vary, there is no gendered
pattern.
24(iii) Numbers of men and women on postgraduate taught degrees
Figure 10. Number of students and proportion of females enrolled on taught postgraduate degrees by year, sex and mode of study. Bench marking data
for percentage of females enrolling on a PG course (taught/research) in sciences for 2017/18 = 41%.
NB. The intake for Strength and Conditioning MSc (S&C) 2017/18 was 17 male, 0 female, 15 white, 1 mixed race, 1 information refused.Table 10. Proportion of total student headcount on each course by gender and ethnicity
between 2014-2018
Proportion of students (%)
Mixed Other
MSc Course White Arab Chinese Asian Black
race Ethnicity
F 83 0 4 4 0 10 0
Clinical Exercise
Physiology (CEP) M 100 0 0 0 0 0 0
Sport and Clinical F 93 0 0 4 0 0 0
Biomechanics
(SCBiomech) M 89 0 0 5 0 6 0
Sport and Exercise F 89 0 5 6 0 0 0
Physiology (SEP) M 86 1 3 5 0 0 0
Sport Psychology F 100 0 0 0 0 0 0
(SPsych) M 94 1 0 0 0 3 0
F 87 0 0 0 0 13 0
Sport Nutrition (SN)
M 100 0 0 0 0 0 0
PGT numbers have doubled, driven by the addition of SN in 14/15 and S&C in 17/18, and
increased numbers on SPsych. 36% of PGTs are female, which is higher than at UG and
may be related to the higher attainment of females at UG level (locally/nationally), as
minimum entry requirement for an MSc is 2.1. The proportion of females has declined by
18% over 5 years, strongly influenced by the introduction of SN and S&C (Figure 11). Thus
identifying a need to improve numbers of females on SN and S&C (action A5).
Males on CEP have increased, while female numbers have not. An increased intake from
15 to 20 and an effort to recruit LJMU students from SES are likely drivers. Additionally,
the PG markerting materials are male dominated (promotional materials will be reviewed
for gender balance for all courses (action A5iii)). Overall 90% of females and 94% male
PGTs are white.
Figure 11. The proportion of females and males on all postgraduate taught courses.
26Table 11. Number of applications, offers and accepted on postgraduate taught degrees.
Applications Offered Accepted
Course (MSc) Year
F M F M F M
13/14 23 15 21 10 11 6
14/15 18 16 18 12 11 6
Clinical Exercise
15/16 33 30 15 11 9 9
Physiology
16/17 25 32 17 24 10 13
17/18 30 45 16 26 7 15
13/14 7 7 6 4 2 2
14/15 8 18 6 17 6 14
Sport & Clinical
15/16 18 17 13 12 8 9
Biomechanics
16/17 26 26 17 16 8 11
17/18 14 24 9 11 4 6
13/14 11 31 8 21 3 13
14/15 18 54 11 23 10 6
Sport & Exercise
15/16 25 59 12 21 5 12
Physiology
16/17 30 40 11 17 6 11
17/18 17 42 10 19 5 8
13/14 NA NA NA NA NA NA
14/15 13 39 7 20 4 17
Sport Nutrition 15/16 48 61 19 26 8 14
16/17 44 69 13 29 8 20
17/18 36 62 15 33 5 21
13/14 12 37 10 17 5 10
14/15 12 36 7 22 5 15
Sport Psychology 15/16 35 35 14 20 6 15
16/17 44 67 18 24 11 15
17/18 62 60 28 28 18 21
Programme Leaders are responsible for application decisions but do not undertake
unconscious bias training (action A6iii). 40% of PGT applicants are female. The proportion
of females applying for SEP, SN and S&C is lower than other courses (Action A4). Female
applicants for SN are least likely to receive and accept an offer. A better understanding
of the reasons is needed (action A6). Otherwise there are no significant differences in the
offer rate. There is no gender difference in the applications to acceptance rate. Females
are more likely (5%) to complete on time than males. There are no differences in
completion rates between courses.
27Table 12. Number & proportion of applications, offers, accepted on PGT degrees (2013-
2018).
Application:
Acceptanc
acceptance
Applicatio
acceptanc
Offers:
offers
Applicati
ns:
es
Course (MSc) Gender Offers
e
ons
Clinical Female 129 87 48 67% 55% 37%
Exercise Male 138 83 49 60% 59% 36%
Physiology %F 48% 51% 50%
Sport & Female 73 51 28 70% 55% 38%
Clinical Male 92 60 42 65% 70% 46%
Biomechanics %F 44% 46% 40%
Sport & Female 101 52 29 52% 56% 29%
Exercise Male 226 101 50 45% 50% 22%
Physiology % 31% 34% 37%
Female 141 54 25 38% 46% 18%
Sport
Male 231 108 72 47% 67% 31%
Nutrition
%F 38% 33% 26%
Female 165 77 45 47% 58% 27%
Sport
Male 235 111 76 47% 69% 32%
Psychology
%F 41% 41% 37%
Female 6 3 1 50% 67% 17%*
Strength &
Male 39 26 19 67% 73% 49%
Conditioning
%F 13% 10% 10%
Female 609 321 175 53% 55% 29%
Overall Male 922 463 289 50% 62% 31%
%F 40% 41% 38%
S&C data is for 2017/18 only and is not included in the overall calculation.
*Student withdrew early in semester 1.
28Table 13. Number of student enrolments and completions, taught postgraduate degrees
by year, sex and course.
Enrolled Completed on time (%)
F completions (%)
F M F M
13/14 10 4 100 100 71
14/15 9 5 100 100 64
Clinical Exercise
15/16 6 6 100 100 50
Physiology
16/17 8 11 100 100 42
17/18 7 12 71 100 26
13/14 2 2 100 50 50
14/15 5 11 100 91 31
Sport & Clinical
15/16 8 6 100 100 57
Biomechanics
16/17 7 9 100 100 44
17/18 3 6 100 83 33
13/14 2 12 100 100 14
14/15 5 10 100 90 33
Sport & Exercise
15/16 3 12 100 83 20
Physiology
16/17 4 9 100 78 31
17/18 4 5 100 100 44
13/14 NA NA NA NA NA
14/15 4 16 100 100 20
Sport Nutrition 15/16 8 14 88 93 32
16/17 6 18 100 100 25
17/18 5 22 80 86 15
13/14 5 9 100 89 36
14/15 4 10 100 80 29
Sport Psychology 15/16 3 13 100 100 19
16/17 10 13 100 85 43
17/18 9 17 89 94 31
Bench marking data for percentage of females obtaining a post graduate (taught)
qualification in sport sciences 2017/18 = 31%.
29Figure 12. Distribution of females and males across MSc degree classifications between
2013-2018.
We observed no gender difference in attainment across MSc programmes, so data was
combined. There is no clear gender difference in attainment at PGT level.
(iv) Numbers of men and women on postgraduate research degrees
Figure 13. Number of students and proportion of females enrolled on research post-
graduate degrees by year, sex and mode of study.
Table 14. Proportion of total PGR student headcount by year, gender and ethnicity.
30Proportion of students (%)
Mixed Other
White Arab Chinese Asian Black race Ethnicity
F 91 0 0 9 0 0 0
14/15
M 87 1 3 6 0 0 0
F 69 0 8 15 0 8 0
15/16
M 96 0 0 4 0 0 0
MPhil F 82 0 0 18 0 0 0
16/17
M 96 0 0 4 0 0 0
F 86 0 0 14 0 0 0
17/18
M 94 0 0 6 0 0 0
F 82 0 2 14 0 2 0
Average
M 93 0 1 5 0 0 0
F 77 0 8 15 0 0 0
14/15
M 90 0 0 5 0 5 0
F 88 0 4 8 0 0 0
15/16
M 89 1 3 5 0 0 0
F 82 0 3 12 3 0 0
PhD 16/17
M 95 1 0 2 0 0 0
F 85 0 3 9 3 0 0
17/18
M 91 0 0 7 2 0 0
F 83 0 4 11 1 0 0
Average
M 92 1 1 5 1 1 0
Our PGRs population has increased over 5 years by 33 (7% increase in femlaes). More
females undertake a PhD than an MPhil. There are very few females PGRs in FEx.
Research groups that perform health-related work and have higher proportions of female
staff have higher proportions of females (PAEx – 55%, CHS- 46%). Improved visibility of
female staff/role models may encourage students to study in other reseach groups
(action A3v). Disparity in gender balance between research groups is to be monitored
and improved (action E1, E3).
Most PGR students are white (83% females and 92% males, Table 14).
31Figure 14. Headcount of students and proportion of females enrolled on research post-
graduate degrees by research group in 2017-18. BB- Brain and Behaviour, Biomech –
Biomechanics, CHS – Cardiovascular Health Sciences, EMARG - Exercise Metabolism and
Adaptation Research Group, FEx – Football Exchange, PAEx – Physical Activity Exchange,
PAD – Psychology and Development
Table 15. Number of students applications, offers and accepted on postgraduate
research degrees by year and sex
: acceptance
Acceptances
Applications
Application:
acceptance
Offers:
offers
Applicat
Year Gender Offers
ions
Female 9 7 5 78% 71% 56%
2013/14 Male 21 13 13 70% 100% 62%
% Female 30% 35% 28%
Female 21 15 13 71% 87% 62%
2014/15 Male 38 27 25 71% 93% 66%
% Female 36% 36% 34%
Female 35 18 17 51% 94% 49%
2015/16 Male 47 25 23 53% 92% 49%
% Female 42% 42% 42%
Female 27 20 19 74% 95% 70%
2016/17 Male 51 23 23 45% 100% 45%
% Female 35% 47% 45%
Female 10 9 8 90% 89% 80%
2017/18 Male 33 21 21 64% 100% 64%
% Female 23% 30% 28%
Female 102 69 74 68% 87% 63%
Overall Male 190 109 93 57% 97% 57%
% Female 35% 39% 44%
32Overall 35% of applicants for PGR positions are female. Supervisory/research teams
review applications and communicate their decision with the Postgraduate admissions
and progression tutor who processes all applications (action A5iii).
Males are less likely to receive and more likely to accept an offer than females. The
differences are not significant. There are no clear gender trends in application to
acceptance rate. Application numbers and proportion of female applicants dropped in
2017/18. However, the application:offer and application:acceptance ratios were higher
for females this year. There is no obvious explanation.
On-time completion has declined from 2012 (Table 16). There is little gender difference
in on-time completion rate (6%). MPhil and part-time PhD data are not available from the
University. We will monitor all PGR completions in the School annually (action E1).
Table 16. Number of full time PhD completions and ontime completions by gender and
year.
Start Completed
Gender Completed %
Year on time
F 4 3 75
2010/11
M 9 6 67
F 5 4 80
2011/12
M 12 7 58
F 3 1 33
2012/13
M 7 1 14
F 3 1 33
2013/14
M 7 4 57
Table 17. Numbers of students on Professional Doctorate programmes by gender, year
and mode of study.
Course Full time Part time
Year
F M %F F M %F
Professional Doctorate 15/16 1 0 100 1 0 100
Sport and Exercise 16/17 2 5 29 1 0 100
Psychology 17/18 6 7 46 1 0 100
15/16 1 6 14 0 1 0
Professional Doctorate
16/17 1 6 14 2 6 25
Applied SES
17/18 1 6 14 2 9 18
Students enrolled on professional doctorates have increased since 2015. Male and
female students on Sport and Exercise Psychology have increased. Part-time males on
Applied SES have increased, but not females. Students on this course work concurrently
as practitioners in sport, which is generally male dominated. We will monitor the intake
on these courses (action E1).
33(v) Progression pipeline between undergraduate and postgraduate student levels
Figure 15. Progression of females from undergraduate to PhD by year.
Gender balance improves with study level, highlighting the need to increase female
representation at UG. There is little gender difference in the proportions of eligible UG
students from SES who continue to PG level at LJMU (Table 18). Female ASP students are
most likely to enrol on a PGT course. There is no gender difference for PGR study. S&F
students are least likely to progress to PG level, with males more likely to progress than
females (~10%).
34Table 18. Number and progression rates of students enrolling on a postgraduate course
at LJMU from our undergraduate programmes.
N enrolments Proportion F (%) Progression rate (%)
BSc Year Gender PGT PGR PGT PGR PGT PGR
F 10 1 30 10 NA NA
2013-14
M 23 9 NA NA
F 9 5 31 36 26 15
2014-15
M 20 9 38 17
F 10 3 22 60 29 9
SES 2015-16
M 35 2 39 2
F 17 3 38 33 41 7
2016-17
M 28 6 33 7
F 10 3 23 60 26 8
2017-18
M 34 2 38 2
F 11 3 29 40 31 10
Average
M 28 6 37 7
F 0 0 0 0 NA NA
2013-14
M 4 1 NA NA
F 4 1 36 100 57 14
2014-15
M 7 0 78 0
F 5 0 38 0 100 0
ASP 2015-16
M 8 0 89 0
F 3 0 43 0 30 0
2016-17
M 4 2 33 17
F 5 0 63 0 83 0
2017-18
M 3 0 33 0
F 3 0 36 20 68 4
Average
M 5 1 58 4
F 0 0 0 0 NA NA
2013-14
M 3 3 NA NA
F 0 0 0 0 0 0
2014-15
M 2 2 15 15
F 0 0 0 0 0 0
2015-16
S&F M 5 1 29 6
F 1 10 0 0 0
2016-17
M 9 3 33 11
F 1 33 0 33 0
2017-18
M 2 2 7 7
F 1 0 9 0 8 0
Average
M 4 2 21 10
Progression rate is calculated from students eligible for MSc at LJMU (i.e. students achieving a
>2.1).
354.2. Academic and research staff data
(i) Academic staff by grade, contract function and gender: research-only, teaching and
research or teaching-only
All but one HEFCE funded academic staff hold teaching and research contracts. All staff
are research active and undertake research-led teaching. We have full (n=55) and part
time staff (n=6); No academic staff are on zero hours contracts. Although staff represent
a number of European cultures there is no black, asian or minority ethnic representation.
Our postgraduate and postdoctoral fellows are appointed to fixed-term research-only
contracts (6 full time and 4 part time).
The staff grades have clear descriptors and generally represent classical role titles;
Grade 3-6- Postgraduate Research Fellow
Grade 7- Postdoctoral Research Fellow
Grade 8- Lecturer/Senior Lecturer
Grade 9- Reader
Grade 10- Professor and Subject Leads
Figure 16. Number of male and female staff. HESA benchmarking data for proportions of
females employed by other Sports Science Departments are as follows; University of
Birmingham F=44.4%, Cardiff Metropolitan F=41.6%, University of Exeter F=33.3%,
University of Hull F=16.6%, Leeds Beckett University F=34.2%, Loughborough University
F=43.4%, Manchester Metropolitan F=36.4%, Northumbria University F=40%, Sheffield
Hallam University F=43.8%.
36Table 19. The gender distribution of academic staff, according to role and grade.
Leader (GRD
L/SL (GRD8)
Researcher
Professor
(GRD10)
(GRD10)
Director
(GR3-7)
Subject
Reader
(GRD9)
10)
Year Gender
Female 5 4 3 1 0 0
13/14 Male 5 17 13 12 2 1
% Female 50% 19% 19% 8% 0% 0%
Female 1 5 3 1 0 0
14/15 Male 0 16 13 14 1 1
% Female 100% 24% 19% 7% 0% 0%
Female 1 4 4 1 0 0
15/16 Male 0 15 11 16 1 1
% Female 100% 21% 27% 6% 0% 0%
Female 1 4 2 2 1 0
16/17 Male 0 19 11 18 2 1
% Female 100% 17% 18% 10% 33% 0%
Female 1 4 1 3 1 0
17/18 Male 1 18 9 17 2 1
% Female 50% 18% 10% 15% 33% 0%
Figure 17. Proportion of female representation of acedmic staff across grades by year.
Female representation at Professor has improved by 7% due to internal promotions,
however there has been a resultant reduction in female readers (n=1). This inconsistent
pipeline is an area of concern which we aim to address by improving the recruitment of
female staff (actions B1-B8) and improve our promotion processes. (actions C2 & C3).
37100 F M 90
82 84
80 73 72 70
65 66 67
60 58
60
(%)
40
40 42
20 35 34 33 10
27 28 30
18 16
0
Figure 18. Progression pipeline in Sport Science related subjects by gender (2017/18).
GCSE and A Level data is national data from the Joint Council for Qualifications, BTEC data
refers to students registered on BTEC SESs nationally (Pearson UK). All other data is
departmental data. Undergraduate and postgraduate data is compiled from total
headcounts across all courses in the School.
Figure 18 identifies gender disparity across the whole progression pipeline. At PGR level
the gender representation improves. However, there is a steady decline in the proportion
of females after PGR. A significant number of actions (A1, A2, A4-6, B2, B3 & B6) address
issues related to gender disparity within the progression pipeline.
Posts available for senior/lecturer are limited and highly competitive, creating a “bottle
neck” in academic careers for PGR students and research fellows. A PGR career
development training programme is therefore important to maximise employability
(action B1). Currently our PGR students are able to complete a 3i’s qualification resulting
in Associate Fellow status of the Higher Education Authority, and going forward we aim
to improve completion rates (action B1). Additionally, the School provides teaching
support hours for PGR students allowing them to gain experience.
There are further pipeline issues from L/SL>reader>professor. With relatively low
numbers of senior positions being advertised and recruited, our focus is on internal
promotion, which has improved gender representation at Professorial level over recent
years (Table 19). The LJMU EDI team will launch a mentoring scheme aimed at female
staff seeking promotion in 2019/2020 (action C2).
38Table 20. Number of staff according to research group and gender in 2018/2019.
Research Group Female (n) Male (n) % Female
B&B 0 8 0%
Biomex 0 8 0%
CHS 4 6 45%
EMARG 3 26 10%
FEx 0 8 0%
PAEx 5 2 71%
PaD 1 7 13%
NB One female academic works across CHS and PAEx. All males in FEx belong to other
research groups (EMARG n=4, PaD n=3, B&B n=1).
The trends identified across research groups in students appear more pronounced within
academic staff. There is no female representation within the Football Exchange, Brain
and Behaviour or Biomechanics groups, we will take action to improve female
representation in these groups (E3).
In line with PGR data, groups that perform mostly health related work seem to have the
highest proportions of female staff (PAEx – 71%, CHS- 45%). The visibility of female role
models may encourage female students to pursue academic careers in these areas, and
potentially that male students may not be encouraged to pursue these research areas.
This is further supported by the PGR focus group data:
“I think more female staff will provide role models to students, attract more female
undergraduate students and be a marker of success/role model for male students.”
39Table 21. Academic and research staff on full and part-time contracts, by gender and
grade.
Female Male
Year Grade Full Time Part Time % Part-Time Full Time Part Time % Part-Time
Grade 3-7 4 1 20% 4 2 33%
Grade 8 4 0% 16 1 6%
2013/14
Grade 9 2 1 33% 11 2 15%
Grade 10 1 0% 10 5 33%
Grade 3-7 1 2 67% 4 0%
Grade 8 5 0% 16 1 6%
2014/15
Grade 9 2 1 33% 12 1 8%
Grade 10 1 0% 10 6 38%
Grade 3-7 1 1 50% 4 0%
Grade 8 4 0% 14 2 13%
2015/16
Grade 9 3 1 25% 11 0%
Grade 10 1 0% 11 7 39%
Grade 3-7 2 2 50% 4 0%
Grade 8 4 0% 17 2 11%
2016/17
Grade 9 1 1 50% 9 0%
Grade 10 3 0% 14 7 33%
Grade 3-7 1 1 50% 5 0%
Grade 8 4 0% 16 2 11%
2017/18
Grade 9 1 0% 9 0%
Grade 10 3 1 25% 14 6 30%
Approximately 1 in 5 academic staff are on part-time contracts, with negligible
differences in the proportions for male and female staff (Table 21). Male Professors are
the most likely to be part time: 14/15 and 15/16 almost 40% were part-time; this high
proportion is mainly driven by members of staff working as practitioners/consultants to
professional sport, or holding dual tenure with another institution/NHS trust. These data
reflect the departments commitment to flexible working and professional development.
40(ii) Academic and research staff by grade on fixed-term, open-ended/permanent
and zero-hour contracts by gender
Table 22. Academic and research staff on fixed term and permanent contracts, by
gender and grade.
Female Male
Year Grade Fixed Permanent % Fixed Fixed Permanent % Fixed
Grade 3-7 4 1 80% 4 1 80%
Grade 8 4 0% 1 16 6%
2013/14
Grade 9 3 0% 13 0%
Grade 10 1 0% 2 13 13%
Grade 3-7 3 0 100% 3 1 75%
Grade 8 5 0% 1 16 6%
2014/15
Grade 9 3 0% 13 0%
Grade 10 1 0% 3 13 19%
Grade 3-7 2 100% 4 100%
Grade 8 4 0% 1 15 6%
2015/16
Grade 9 4 0% 11 0%
Grade 10 1 0% 2 16 11%
Grade 3-7 4 100% 4 100%
Grade 8 4 0% 19 0%
2016/17
Grade 9 2 0% 9 0%
Grade 10 3 0% 1 20 5%
Grade 3-7 2 0 100% 4 1 80%
Grade 8 4 0% 18 0%
2017/18
Grade 9 1 0% 16 0%
Grade 10 4 0% 1 12 8%
In general, research staff are appointed on fixed-term contracts. Currently the only non-
researcher on a fixed-term contract is a male at Grade 7 providing cover for a member of
staff on secondment. The University policy is to consider staff with >four years’ service
or more, on successive FTC, for conversion to permanent status. If this is not possible,
objective justification should be given for the decision not to convert. The University also
automatically undertakes redployment.
41(iii) Academic leavers by grade and gender and full/part-time status
Table 23. Number of academic leavers and their reasons for leaving.
Leaving Rate
Resignation
Retirement
Total Staff
Leavers
Gender
Tenure
End of
Total
(%)
F 11 2 18 2
Full-time M 41 8 20 7 1
F% 21 20 22 0
2013/ 14
F 2 1 50 1
Part-time M 10 9 90 7 2
F% 17 10 13 0
2013/2014 TOTAL 64 20 31% 17 (85%) 3 (15%) 0
F 9 0 0
Full-time M 42 4 10 3 1
F% 18 0 0 0
2014/ 15
F 3 0 0
Part-time M 8 1 13 1
F% 27 0 0
2014/2015 TOTAL 62 5 8% 1 (20%) 3(60%) 1 (20%)
F 9 1 11 1
Full-time M 40 4 10 1 3
F% 18 20 0 25
2015/ 16
F 2 1 50 1
Part-time M 9 3 33 2 1
F% 18 25 33 0
2015/2016 TOTAL 60 9 15% 4 (44%) 4 (44%) 1 (12%)
F 10 1 10 - 1
Full-time M 44 4 9 3 1
F% 19 20 0 50
2016/ 17
F 3 2 67 2
Part-time M 9 1 11 1
F% 25 67 67
2016/2017 TOTAL 66 8 12% 3 (37.5%) 5 (62.5%) 0
F 9 1 11 1
Full-time M 44 2 5 1 1
F% 17 33 50 0
2017/ 18
F 2 0 0
Part-time M 8 2 25 2
F% 20 0 0
2017/2018 TOTAL 63 5 8% 2 (40%) 3 (60%) 0
GRAND TOTAL 47 27 (57.5%) 18 (38.3%) 2 (4.3%)
42Females make up ~20% of all leavers in line with current staff gender balance. Leaving
rates for full-time female and male staff are similar. There are larger gender differences
for part time staff, but this appears to be due to a large number of fixed term contracts
coming to an end.
The majority of leavers are research staff (grades 3-7) on fixed term contracts (57.4% of
leavers between 2013-2018), 38.3% of leavers resign and 4.3% of leavers retire. The are
no gender differences in reasons for leaving.
Data capture of academic leavers is coordinated by POD. There is an ‘Exit Questionnaire’
that staff are asked to complete prior to leaving, data from which is communicated back
to HoS. POD state that ‘the uptake is low’ and no data is available. Currently there are no
formal exit interviews. This process has been identified as suboptimal; the department
will therefore conduct leaving interviews, as is considered best practice (action C8).
1990 (2000 words)
5. SUPPORTING AND ADVANCING WOMEN’S CAREERS
Recommended word count: Bronze: 6000 words | Silver: 6500 words
5.1. Key career transition points: academic staff
(i) Recruitment
Females are employed to 17% of academic and 7% of research positions. To address this,
actions in Theme B are dedicatd to improving female staff recruitment.
Table 24. Proportion of posts filled by gender between 2015-2018.
Proportion
Job N of posts Gender
employed (%)
F 0
L/SL 3 M 100
Unfilled 0
2015-16
F 0
Research 2 M 50
Unfilled 0
F 25
L/SL 4 M 75
Unfilled 0
2016-17
F 20
Research 5 M 80
Unfilled 0
F 25
L/SL 8 M 37.5
Unfilled 37.5
2017-18
F 0
Research 4 M 75
Unfilled 25
F 17
L/SL 15 M 71
Unfilled 13
Overall
F 7
Research 11 M 68
Unfilled 25
43No data was available from POD on the gender or number of applicants, those shortlisted,
offered and accepted for positions over the last 3 years so we are unable to comment on
trends in this data. We will locally record and monitor this data in the future (action B7).
Staff consultation indicated that only 36% of staff are satisfied that the recruitment
process encourages applicants from under represented groups to apply. Recruitment of
candidates is performed in accordance with university policies. Using a standard
statement from POD, a person specification (PS) and job description (JD) are developed
with input from staff members with relevant subject specific expertise. A final version is
approved by the SES Executive Dean. POD are responsible for ensuring documentation
contains all necessary information. Advertisements are set out in standard format on the
LJMU vacancies website and should have a statement detailing LJMUs commitment to
diversity and equality, however this is not applied consistently (action B3). Language in
JDs and PS is not currently checked for gender bias (action B8).
The LJMU vacancies website is linked on the JD and includes a ‘why join us’ section which
states LJMUs commitment to equality and diversity, and has details on childcare
vouchers, flexible working and the relocation package. However, there is no information
on the School webpages, and there are no specific departmental recruitment processes
in place to encourage females to apply (actions B3, B6). All job adverts provide HoS and
a subject specialist contact details for enquiries. This was raised in the staff consultation
exercise:
“The School needs to offer other specific contacts to encourage enquiries from those in
underrepresented groups…all contacts on adverts to date have been male.”
Shortlisting panels are comprised of the HoS, HoR, a relevant subject head and 2 - 3
subject specialists. Interview panels for > grade 8 must include the Executive Dean
(male) and HoS (male). Institutional policy dictates that the HoR (male) must be on
interview panels. These combined Institutional and School processes act as a barrier to
gender balance on panels. This was reflected in the staff consultation:
“The make-up of the interview panel does not allow any diversity (Dean, director of
School and head of research), all are white, middle aged males.”
Nonetheless, interview panels must include a minimum of 1 female and male, and
members must undertake recruitment and selection training and complete the diversity
in the workplace online module. Recruitment training is not refreshed regularly and no
unconscious bias training is undertaken (actions B4, B5). Involvement of all panel
members in all aspects of the recruitment process is challenging, interview panel
members can be invited having had no involvement in the development of the JD, PS or
shortlisting activity. Feedback from the staff consultation exercise raised late female
involvement as a point of contention which should be addressed (action B2).
“It’s - we need a female. Could you sit on the panel? We need you to be here because
we are complying and not for any other reason.”
44(ii) Induction
Feedback from staff who have commenced employment in the School in the previous six
months demonstrates the supportive and welcoming nature of staff in the School:
“Staff were really welcoming and supportive. A few members of staff really went out of
their way to make sure that I had settled in ok, had access to everything that I needed,
and gave advice from their own experiences of services/schemes that are useful”
All new academic staff appointed to the School complete an induction process to receive
information relating to University, Faculty and School policy and procedures. The line
manager is responsible for completion of university/faculty required
paperwork/checklist. Compliance with this process is 100%, and is monitored by POD.
New starters receive a formal email from the PA to the Director of School directing them
to a Faculty Induction Sharepoint site, which provides detailed information
about Institutional and Faculty policies and procedures. The new starter is responsible
for completing mandatory online modules on GDPR and Equality and Diversity, and for
signing and submitting a health and safety declaration, also monitored by PoD.
Nonetheless there are no school specific induction procedures or paperwork,
development of a consistent approach to school induction would enhance transition to
the school for new staff (action F3).
Mutliple people within the School are expected to engage with the new staff member.
This includes; HoS to discuss culture and philosophy of the School; HoR to discuss
research and School technicians to facilitate technical skill development and provide
laboratory specific inductions. The PA to HoS also circulates a welcome email to staff
within the School with details of the new employee with a ‘headshot’ image. There is
currently no (formal) process to monitor this additional inter-activity within the School.
Given the complexity of School inter-activity with new starters it is possible that
experience of induction may be inconsistent for new starters. A
School specific guide/checklist, also monitored at School level may help all stakeholders
in ensuring consistency in the induction process (action A3). This is also supported by
staff feedback for suggestions at School level:
“The main thing that I feel is missing is perhaps a School booklet with policy and
procedures detailed in it”
There is no clear local policy on allocating a mentor for new starters, the introduction of
a formal school mentoring programme would benefit new starters (action C1).
(iii) Promotion
Applications for Readership/Professorship conferment are advertised by PoD anually, for
submission at the end of January. To assist in understanding the criteria University
services provide support sessions for potential applicants. Promotion can be in one or
more of the following areas; as academic leaders; as researchers and scholars; as
teachers; as entrepreneurs. All staff are advised as to the opportunity and criteria via
institutional email and encouraged to discuss this with their line managers. Support is
provided by the School via peer support, individual research group
45mentoring/discussions (informal/non-documented), and the PDPR process
(documented), although the PDPR form does not have specific content on promotion.
There is no formal or consistent process for the School to identify and support eligible
staff, a more proactive approach to identify suitable staff for promotion and support
them through the process would benefit all staff (action C2). Staff consultation raised a
perceived lack of support as specific issue for female academics (action C2):
“Women seem to have less chance to get [a] promotion or are encouraged less”
“Nobody talks to you about how you might navigate promotion - you really need to
work this out for yourself.”
Table 25. Applications and successful promotions by Gender, Role and year.
Professor Reader
Year
Female Male Female Male
Eligible staff 3 13 5 16
Applications 0 1 1 1
Application rate (%) 0 8 20 6
Shortlisted 0 1 1 1
2015
Conferred 0 1 1 1
Applications to shortlist NA 100% 100% 100%
Shortlist to conferred NA 100% 100% 100%
Application to conferred NA 100% 100% 100%
Eligible staff 4 11 4 15
Applications 1 1 1 1
Application rate (%) 25 9 25 6
Shortlisted 1 1 0 1
2016
Conferred 1 1 0 1
Applications to shortlist 100% 100% 0% 100%
Shortlist to conferred 100% 100% 0% 100%
Application to conferred 100% 100% 0% 100%
Eligible staff 2 9 4 19
Applications 1 0 0 2
Application rate (%) 50 0 0 11
Shortlisted 1 0 0 2
2017
Conferred 1 0 0 1
Applications to shortlist 100% NA NA 100%
Shortlist to conferred 100% NA NA 50%
Application to conferred 100% NA NA 50%
Eligible staff 1 9 4 18
Applications 0 1 0 4
2018 Application rate 0 11 0 22
Shortlisted 0 1 0 4
Conferred 0 1 0 4
46You can also read