Determining Landscape Connectivity and Climate Change Refugia Across the Sierra Nevada
←
→
Page content transcription
If your browser does not render page correctly, please read the page content below
Determining Landscape Connectivity
         and Climate Change Refugia
          Across the Sierra Nevada
Toni Lyn Morelli1,2 & Sean P. Maher1,5
with Craig Moritz4, Steven R. Beissinger5,
Michelle Hershey1, Marisa Lim1, Christina
Kastely1, Lindsey Eastman1,
Alan L. Flint3 & Lorraine E. Flint3
[1] MVZ, UC Berkeley
[2] Northeast Climate Science Center, UMass
[3] USGS, Sacramento CA
[4] RSB, ANU, Canberra
[5] ESPM, UC Berkeley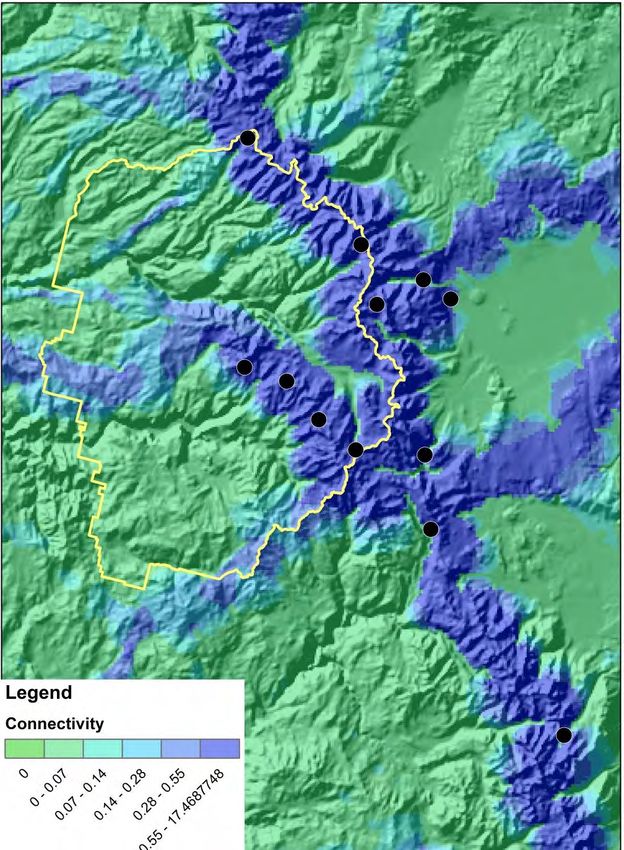
Outline
• Biological and Management Relevant Context
  – Climate Change Refugia
  – Metapopulation dynamics
  – California climate change trends
• Research Objectives
• Patterns of Connectivity in Meadows
  – How Sierra Nevada meadows have changed and will change
• Refugia Mapped
• Maps Tested – Montane Mammal Data
• Implications for Management

The Role of Climate Refugia

          “We argue for the utility of a proactive approach in conservation
that is focused on identifying and protecting genetic hotspots and climate refugia
                  with viable populations and low vulnerability”
The Role of Climate Refugia

  “Refugia are habitats that components of biodiversity retreat to,
     persist in and can potentially expand from under changing
environmental conditions…applicable to biodiversity under potential
   future climates arising from the enhanced greenhouse effect.”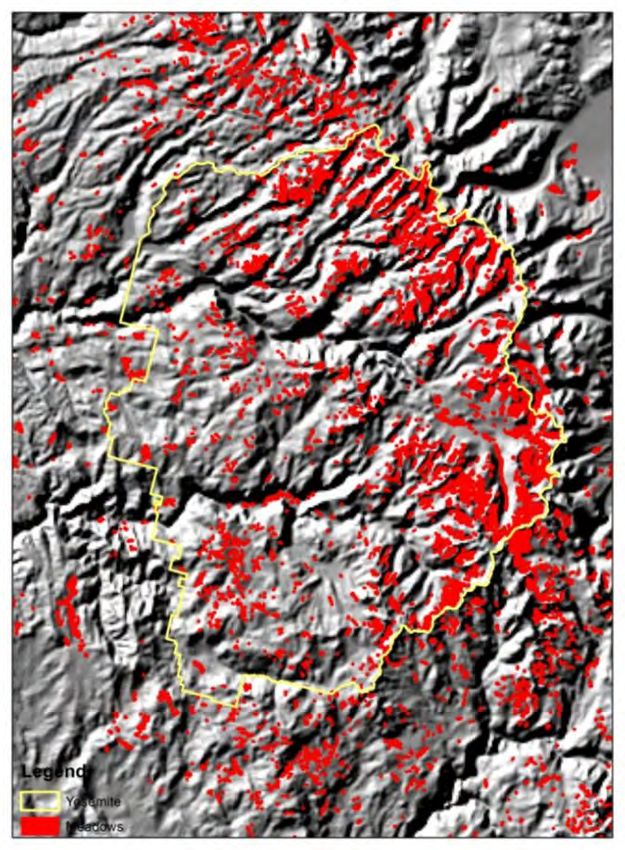
Climate change in                     20 th      Century
             Modern (1970-1999) vs. Historic (1910-1939)
Annual Temperature (Actual)             Annual Precipitation (Relative)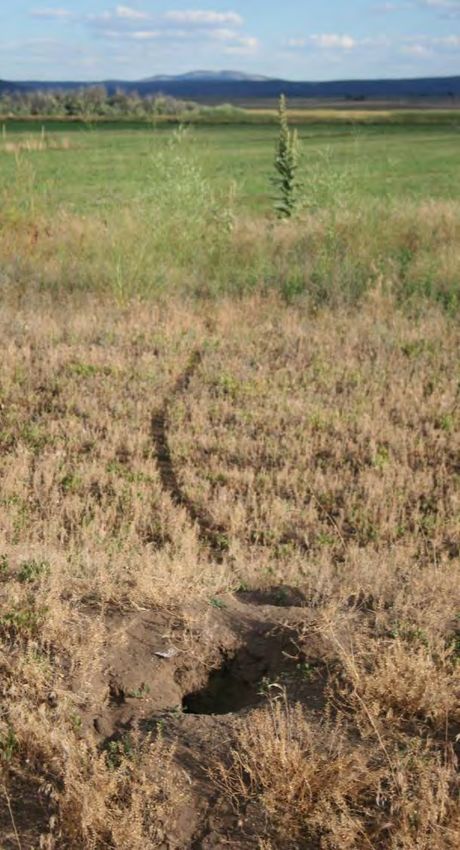
Do patterns differ between variables?
 Minimum Temp         Maximum Temp
Water balance variables are
       more striking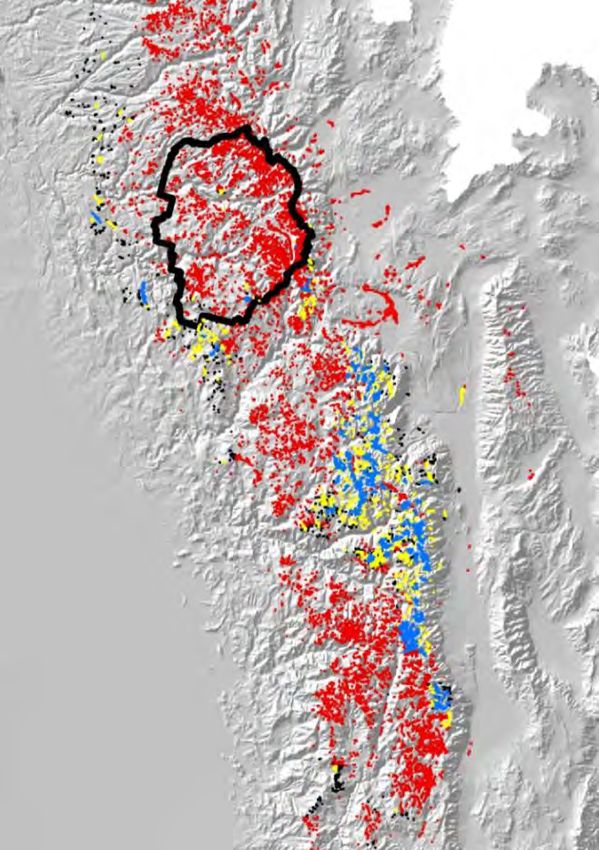
Historic
Modern

New Community or
    Life Zone
Modern Potential Refugia Potential Refugia
Moritz et al. 2008
             Science

                        Grinnell Resurvey Project

                 Expansion     Contraction       No change
Elevation (m)

                                    Species
                Persistence          Expansion        Contraction
Populations and species
responses to change
• Range shift
– Elevationally (per our example)
– Latitudinally
• Population shift
– Range is stable, but distribution of individuals has
changed
– Change in age structure
• Genetic shift
– Selection and adaptationWhat characteristics would allow
refugia to maintain a population?
• Size
– Larger area, maybe more species or individuals
– Perhaps a SLOSS-type debate
• Access
– Easy to “find”
• Orientation and arrangement
– Permit and facilitate movement between patches
Measures of connectivity can help assess
Access and OrientationWhat do we mean by “connectivity”? • Abstract measurement, so values can be relative to the system or analysis • Mapped routes of expected dispersal – Based upon some friction surface – Would assist in identifying corridors of retraction – Least-cost distance, for instance • Estimated value of movement through an area – Identify well-traveled node in network – Provide an additional quantity of value
Metapopulations and connectivity
Metapopulations and connectivity
Metapopulations and connectivity
Refugia and connectivity
                   Refugia defined as
                   patches that do
                   not change (a lot)
Refugia and connectivity
Refugia and connectivity

Well-connected refugial sites are likely to be important for
        occupancy of populations and gene flow
PROJECT OBJECTIVES • Map hypothetical connectivity of meadows in the Sierra Nevada • Map hypothetical climate change refugia in the Sierra Nevada • TEST mapped connectivity and refugia using occupancy and genetic data
Hypotheses of connectivity to test

1.   Isolation by distance
2.   Isolation by topography
3.   Isolation by watercourses
4.   Isolation by roads
5.   Isolation by environmental heterogeneity
How are meadows connected and how
   is their environment changing?

• Spatial layer of meadows – ICE at UC Davis
• Estimate the connectivity between them using
  Circuitscape based upon resistance and
  conductance surfaces
• Plotted forward in time to assess how
  meadows are expected to change
Meadows
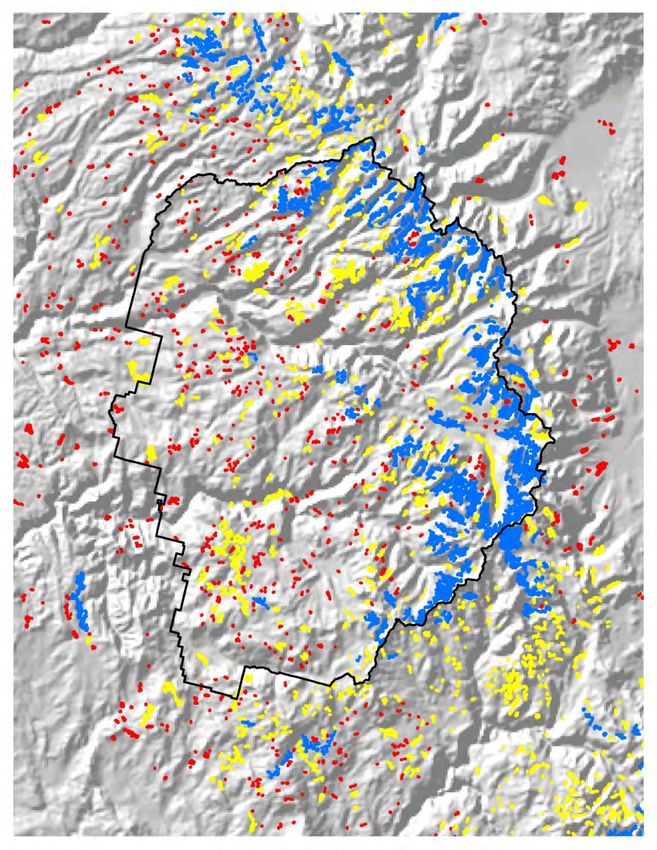
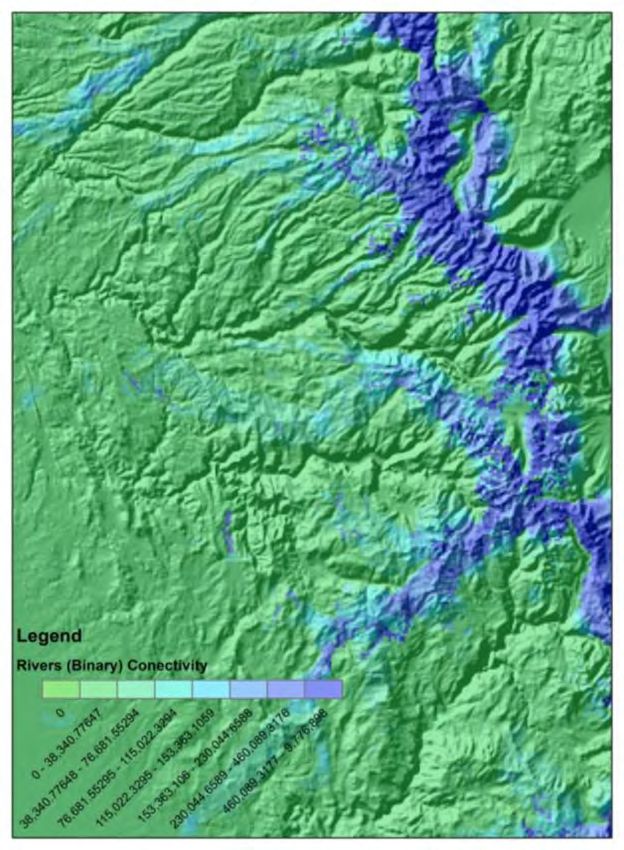
Connectivity based on presence or
absence of watercourses (Hyp #3)
Overall patterns of connectivity
         depends on surface
A                       B         C

    Environmental Heterogeneity       Topography
D                       E         F

    Watercourses                      Roads
Distribution of values of connectivity
Four of the Circuitscape layers Arrangement of meadows
Distance Distance Distance Rivers Rivers
(10km) (50km) (100km) Topography (Distance) (Presence) Roads
Distance (10km) 1 0.788 0.638 0.326 0.154 0.169 0.322
Distance (50km) 0.788 1 0.935 0.236 0.102 0.116 0.297
Distance (100km) 0.638 0.935 1 0.218 0.113 0.129 0.280
Topography 0.326 0.236 0.218 1 0.584 0.637 0.770
Rivers (Distance) 0.154 0.102 0.113 0.584 1 0.960 0.591
Rivers (Presence) 0.169 0.116 0.129 0.637 0.960 1 0.645
Roads 0.322 0.297 0.280 0.770 0.591 0.645 1Where are the Well-Connected Meadows?
Within 75th
percentile
of all
estimatesAre Well-Connected Meadows at
higher elevations?
Red = “Less” Connected
Yellow = “More” Connected
Blue = “Well” connectedAre larger meadows more connected?
Of the 5894 meadows,
470 were classified as
WC (8.0%), and 2266
were classified as rWC
(38.4%), and 3158
Frequency of Meadows
meadows (53.6%) were
unclassified. However,
the amount of area
represented by the WC
meadows was much
larger (31.9%), while
rWC meadows
represent a similar
proportion (35.6%),
such that WC meadows
tended to be those that
are larger than other
meadows.
Log10 (Area)Change within meadows is variable
Relative Change in Annual Precipitation
Change in AET
Change in CWD Change in Mean Annual Temperature
WC meadows are red pointsDifferences in proportion of refugia
within network of meadows
Variable Measure (Threshold) WC rWC Rest Binomial test Direction
CWD Central Tendency (10%) 0.289 0.467 0.640 P < 0.001 Lower
SWE Central Tendency (10%) 0.472 0.458 0.287 P < 0.001 Higher
Annual Temp. Central Tendency (1°C) 0.791 0.817 0.934 P < 0.001 Lower
Annual Precip. Central Tendency (10%) 0.538 0.453 0.302 P < 0.001 Higher
Max. Temp. Central Tendency (1°C) 0.636 0.662 0.705 P = 0.019 Lower
Min. Temp. Central Tendency (1°C) 0.330 0.237 0.316 P = 0.028 Higher
Mean. Temp. of
Central Tendency (1°C) 0.696 0.658 0.805 P = 0.020 Lower
Coldest Quarter
Monthly Extreme Warming
0.332 0.226 0.212 P < 0.001 Higher
Min. Temp. (30 Months)
Monthly Extreme Warming
0.570 0.482 0.507 P = 0.001 Higher
Min. Temp. (60 Months)
Extreme Wet
Monthly Precip. 0.021 0.008 0.003 P < 0.001 Higher
(30 Months)
Extreme Wet
Monthly Precip. 0.968 0.961 0.904 P < 0.001 Higher
(60 Months)
Monthly Precip. Extreme Dry (30 Months) 0.174 0.221 0.290 P < 0.001 Lower
Annual Temp. &
Central Tendencies 0.419 0.363 0.291 P < 0.001 Higher
Annual Precip.
SWE & Central Tendency &
0.094 0.067 0.033 P < 0.001 Higher
Monthly Min. Temp Extreme (30 Months)Erosion of the network
in the (near) future
Ann Temp Ann Precip
Ann Temp & Ann PrecipSo how do we expect climate to
change in well-connected meadows?
Change from Change from
1910-1939 in 1910-1939 in
2010-2039 2070-2099
PCMA2 Annual TempSo how do we expect climate to
change in well-connected meadows?
Change from Change from
1910-1939 in 1910-1939 in
2010-2039 2070-2099 PCMA2 Annual TempSo how do we expect climate to
change in well-connected meadows?
Change from Change from
1910-1939 in 1910-1939 in
2010-2039 2070-2099
PCMB1 Annual TempSo how do we expect climate to
change in well-connected meadows?
Change from Change from
1910-1939 in 1910-1939 in
2010-2039 2070-2099 PCMB1 Annual TempTesting the Refugia and Connectivity Maps
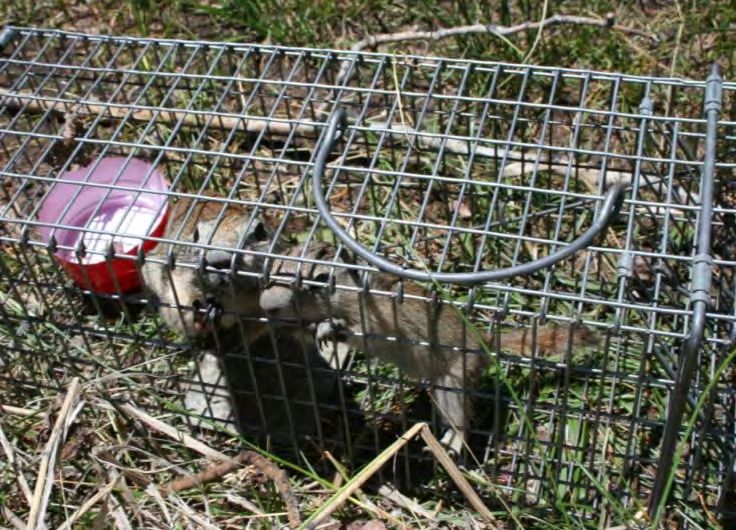
Belding’s Ground Squirrel
  (Urocitellus beldingi)

     • Montane meadow
       specialist

     • Highly detectable

     • Group-living

     • Habitat specialist
Site Extirpations (N=31) Site Persistence (N=43) Original Surveys: 1902-1966 Resurveys: 2003-2011 Detectability (p) > 0.995 for 2+ visits
Site Extirpations (N=31)
                       Site Persistence (N=43)

42% Rate of Site Extirpations Across CA

                          Morelli et al. 2012 Proc. B
Site Extinction at Hotter Sites
p < 0.005
Modern Winter Temperature (°C)
-6 -4 -2 0
Extirpated Sites Persistent SitesAnthropogenic Refugia?
Morelli et al. 2012 Proc. BChange from 1910-1939 in 2010-2039
2011 Surveys for Belding’s Ground Squirrel

• Independent data set

• 38 sites, distributed
  throughout YNP

• 20 occupied,
  18 unoccupied
Refugia Concept
   Supported
Genetic Analysis
• 187 tissue samples
• Qiagen extraction
• 12 nuclear
microsatellite loci
• Genepop
• FSTAT
• STRUCTURE
–Model-based clustering
method
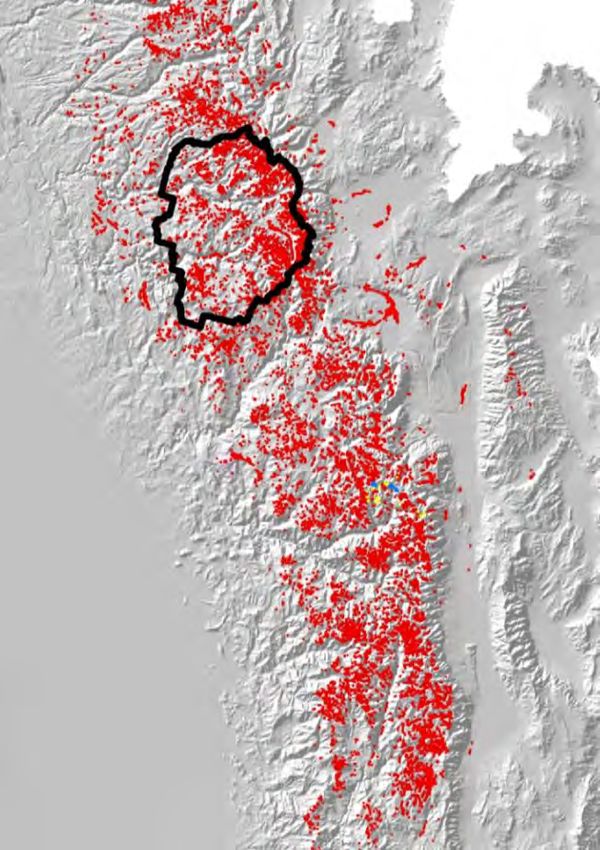
• BayesAssGenetic Structure Across CA
187 Belding’s sampled
At 15 sites
2003-2011Is allelic richness related to
connectivity or climate?
Positive relationship
Allelic Richness
between AR and Connectivity –
More alleles in well-connected
meadows
Log (Mean Connectivity)
Allelic Richness
Negative relationship
between AR and Refugia –
Fewer alleles in warmer meadows Mean Temperature of the Coldest Quarter (°C)Is genetic distance related to isolation?
• Permutations to
examine patterns of Fst 0.047
0.16
• Support for dispersal
limitation by
watercourses ~45 kmConclusions and Implications • Climate may be changing more rapidly than species can move or adapt • Inclusion of connectivity within climate change research with empirical data is important • Climate refugia concept supported • Opportunities for California managers to focus limited resources on critical areas?
Funding & Data Sources           Comments & Assistance

                                  • Michelle Koo
                                  • Michelle Hershey
                                  • Moritz Lab
                                  • Beissinger Lab
                                  • Ilaria Mastroserio, Jeni
    UC Davis
    Information Center for the      Chan, Matt Pfannenstiel,
    Environment (ICE)               and other field assistants
                                  • BIGCB working group
                                  • Biotic Responses to
                                    Climate Change in
                                    California working group

                        Thanks!
You can also read