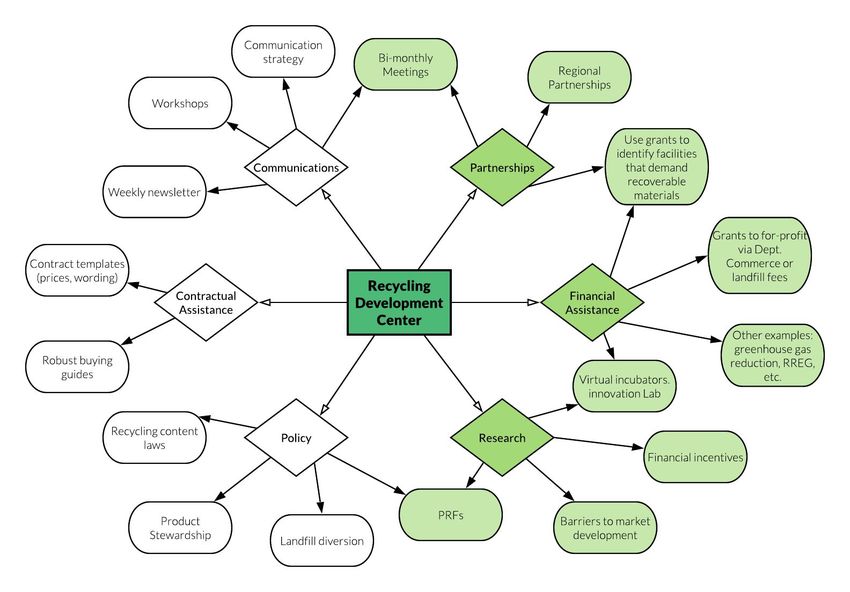
RECYCLING DEVELOPMENT CENTER - Developing Secondary Markets for Recycled Materials in the Pacific Northwest - Washington ...
←
→
Page content transcription
If your browser does not render page correctly, please read the page content below
WASHINGTON STATE'S

RECYCLING
DEVELOPMENT
CENTER
Developing Secondary Markets
for Recycled Materials
in the Pacific Northwest
WASHINGTON STATE'S

RECYCLING
DEVELOPMENT
CENTER

PREPARED BY:
Sophia Ahn, Emily Coleman,
Katy Ricchiuto, and Katherine Walton

PREPARED FOR:
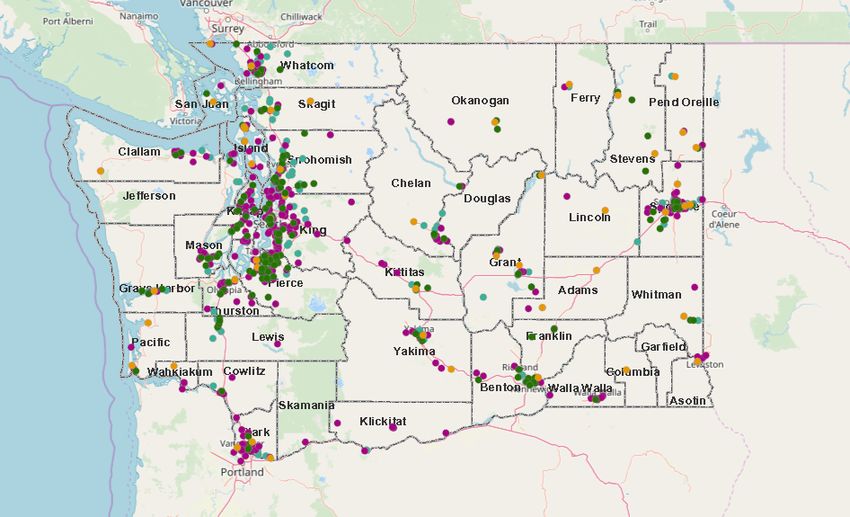
Table of Contents
───

Executive Summary . . . . . . . . . . . . . . . . . . . . . . . . .                                                                                                                                                                                                                                                       1

Acknowledgements . . . . . . . . . . . . . . . . . . . . . . . . .                                                                                                                                                                                                                                                        2

Chapter One: Introduction . . . . . . . . . . . . . . . . . . . . . .                                                                                                                                                                                                                                                     3

Chapter Two: Background and Review of Literature . . . . . . . . . . . . 4

     2.1 China National Sword                       .               .               .               .               .                   .                       .                           .                   .                       .                       .                       .                           .     4

     2.2 Regulatory Context                 .           .               .               .               .                   .                       .                           .                   .                           .                       .                       .                       .                . 5

     2.3 Materials      .       .       .           .               .               .               .               .                   .                           .                       .                       .                       .                       .                       .                       .     7

     2.4 Recycling Market Trends                                .               .               .               .                   .                       .                           .                   .                       .                           .                       .                       .        12

     2.5 Recycling Processing Facilities in Washington State                                                                                                                                    .                       .                       .                       .                       .                       . 12

     2.6 Financial Assistance Opportunities in Washington State                                                                                                                                                         .                       .                           .                       .                    14

     2.7 Other Relevant Resources and Reports                                                                           .                       .                       .                       .                       .                       .                       .                       .                       . 15

Chapter Three: Research Methodology . . . . . . . . . . . . . . . . . 16

     3.1 Research Questions                 .           .               .               .               .                   .                       .                       .                       .                       .                       .                       .                           .                16

     3.2 Qualitative Analysis of Data Collected                                                                 .                       .                       .                       .                       .                       .                       .                       .                       .        16

     3.3 Criteria for Evaluating Recommendations                                                                                    .                       .                       .                       .                       .                       .                       .                       .            17

     3.4 Methods for Creating Work Plan                                                     .               .                   .                       .                       .                       .                       .                       .                       .                       .                17

Chapter Four: Findings . . . . . . . . . . . . . . . . . . . . . . . . 19

     4.1 Case Studies       .       .           .           .               .               .               .                   .                       .                           .                   .                       .                           .                       .                       .            19

         4.1.1 Government Program: Washington - The Clean Washington Center (Defunct)                                                                                                                                                                                                                       .            19

         4.1.2 Government Program: California - CalRecycle                                                                                      .                           .                       .                       .                       .                       .                       .                   . 22

         4.1.3 Government Program: Colorado - NextCycle                                                                                     .                       .                           .                   .                       .                           .                       .                       . 23

         4.1.4 Recycling Development Council: Southeast Recycling Development Council                                                                                                                                                                                                               .                    24
4.1.5 Recycling Development Council: Northeast Recycling Council . . . . 25
4.1.6 Recycling Development Council: Recycling Council of British Columbia, Canada . 27
4.1.7 Recycling Partnership: Chicago Board of Trade Recyclables Exchange (Defunct) . 28
4.1.8 Recycling Partnership: The Recycling Partnership . . . . . . . 29
4.1.9 Recycling Partnership: Beyond 34 . . . . . . . . . . 30
4.1.10 Recycling Partnership: Alabama Recycling Partnership . . . . . . 31
4.1.11 Recycling Partnership: Arizona State University RISN Incubator . . . . 32
4.2 Interview Findings . . . . . . . . . . . . . . 34
4.2.1 Materials . . . . . . . . . . . . . . 35
4.2.2 Recycling Development Center . . . . . . . . . . 36
Chapter Five: Recommendations and Workplan . . . . . . . . . . . . . 40
5.1 Recommendations . . . . . . . . . . . . . . 40
5.1.1 Develop a Regional Partnership . . . . . . . . . . 42
5.1.2 Create an Accelerator Program . . . . . . . . . . 43
5.1.3 Research Strategies to Attract Manufacturing Facilities . . . . . 44
5.1.4 Develop Two Public Databases to Better Connect Industry Stakeholders . 45
5.1.5 Research Infrastructure Needs . . . . . . . . . . 46
5.1.6 Future Considerations . . . . . . . . . . . . 46
5.2 Proposed Work Plans for Fiscal Years 2020 and 2021 . . . . . 47
5.2.1 Major Proposed Projects for Fiscal Years 2020 and 2021 . . . . . 47
5.2.2 Advisory Board . . . . . . . . . . . . . 49
5.2.3 Future Proposed Projects . . . . . . . . . . . 51
Chapter Six: Conclusion . . . . . . . . . . . . . . . . . . . . . . . 55
Appendices . . . . . . . . . . . . . . . . . . . . . . . . . . . . 56
Appendix 1: Interview List . . . . . . . . . . . . . 56
Appendix 2: Case Study Matrix . . . . . . . . . . . . 57Appendix 3: List of Relevant Legislative Bills and State Codes . . . . 61
Appendix 4: Life-cycle (Process and Transportation) Energy . . . . . 64
Appendix 5: Interview Findings Matrix . . . . . . . . . . 65
Endnotes . . . . . . . . . . . . . . . . . . . . . . . . . . . . . 69Executive Summary
───
In April 2019, the Washington State Legislature passed House Bill 1543 to create a Recycling
Development Center (Center) to provide or facilitate research and development, marketing, and
policy analysis to bolster recycling markets and processing in Washington. Anticipating the
potential passing of HB 1543, the Washington State Department of Ecology (Ecology) contracted
with the University of Washington’s Evans School of Public Policy and Governance Student
Consulting Lab. In December 2018, we began working with Ecology to create a report that would
support the implementation of the new Recycling Development Center.
Our study used interviews and case studies to answer the question: What are the most
effective approaches that the Washington Recycling Development Center can take
to reduce overall waste and increase recycling rates in response to changing
markets and China’s National Sword policy?
Based on interviews with 31 industry professionals and 11 case studies of government programs,
recycling development councils, and other recycling partnership models, we recommend that
Ecology consider prioritizing the following options:
1) Develop a Regional Partnership – The Center should establish a regional partnership
model, consider British Columbia and Oregon as potential partners, delegate to Recycling
Development Center staff to manage these partnerships, and maintain consistent
communication with potential partners.
2) Create an Accelerator Program – The Center should develop and implement an
accelerator program to bolster a diverse recycling market through intentional business
development support and resources.
3) Research Strategies to Attract Manufacturing Facilities Using Recycled Feedstocks –
The Center should analyze Washington State’s relative attractiveness to manufacturing
facilities interested in using recycled feedstock and recommend and implement a model
to increase its competitiveness and realize the benefits of this activity.
4) Develop Two Public Databases to Better Connect Industry Stakeholders – The Center
should provide a digital database for manufacturers and recycling processors to build
relationships and share knowledge, tapping the potential high market impacts of those
relationships.
5) Research Infrastructure Needs – The Center should explore the development of a plastic
recycling facility (PRF) and consider siting a PRF in close proximity to an existing
material recovery facility (MRF) in a densely populated area of the state.
WASHINGTON STATE RECYCLING DEVELOPMENT CENTER |1|Acknowledgements
───
We would like to first and foremost thank the Washington State Department of Ecology for giving
us the opportunity to work on this project. In particular, we are grateful to Julie Robertson,
Laurie Davies, and other Ecology staff who shared their time, resources, insights, and feedback
with us as we developed this report.
We would like to express our gratitude to our professor and advisor Matt Steuerwalt who
provided ongoing guidance and feedback throughout this report.
Finally, we would like to thank the industry professionals we interviewed for their invaluable
insights and feedback. These interviews helped us understand the developing recycling landscape
and guided our recommendations.
Thank you.
WASHINGTON STATE RECYCLING DEVELOPMENT CENTER |2|Chapter One: Introduction
───
1.1 Report Overview
Recycling in Washington State is a growing concern, and in April 2019, the Washington State
Legislature passed House Bill 1543 to create a Recycling Development Center (Center) in the
state. The Center is housed within the Washington State Department of Ecology (Ecology) in
partnership with the Department of Commerce (Commerce) and is mandated by law to provide
or facilitate research and development, marketing, and policy analysis to bolster recycling
markets and processing in Washington. This law’s passage comes at a time when recyclers
increasingly struggle to find markets for recycled materials in the face of rising contamination
standards, volatile international markets, and dwindling local buyers.
In December 2018, Ecology contracted with the University of Washington’s Evans School of
Public Policy and Governance Student Consulting Lab to prepare for the new Recycling
Development Center in Washington. This study used interviews and case studies to answer the
question: What are the most effective approaches that the Washington Recycling
Development Center can take to reduce overall waste and increase recycling rates
in response to changing markets and China’s National Sword policy? This report has
six chapters that are organized as follows:
● In Chapter Two: Background and Review of Literature, we provide context for changing
recycling markets, review the regulatory context, and explore the literature on recyclable
materials, recycling market trends, and financial opportunities in Washington State.
● In Chapter Three: Research Methodology, we provide an overview of our research
process.
● In Chapter Four: Findings, we present the results of the case studies and interviews with
industry professionals.
● In Chapter Five: Recommendations and Work Plan, we provide recommendations for
the Recycling Development Center, as well as a work plan for the first two years of the
Center.
● In Chapter Six: Conclusion, we provide a brief conclusion of the purpose and outcome of
the report.
● In the Appendices, we include a list of interviewees, a case study matrix, a regulatory list,
a life-cycle energy analysis comparing virgin inputs to recycled inputs, and an interview
findings matrix.
WASHINGTON STATE RECYCLING DEVELOPMENT CENTER |3|Chapter Two: Background and Review of Literature
───
2.1 China National Sword
Washington first required recycling in 1989 with the Waste Not Washington Act, and by 1991, 85
percent of Washington residents had access to curbside recycling.1 As a western state with
proximity to the Pacific Rim markets, Washington had access to growing markets for these
recycled materials. Recycling companies became heavily reliant on exporting the materials they
collected through recycling programs to Asian countries, mainly China. International cargo
companies who shipped Chinese-produced goods to the United States offered low shipping costs
to American recyclers in cargo containers that would otherwise return empty. In 2016,
Washington State recycling companies shipped 790,000 metric tons of materials to China
through the ports of Seattle and Tacoma.2
However, contamination of bales sent overseas had been a major problem for decades.
Contamination occurs when a non-recyclable material, or the incorrect recyclable material, ends
up in a bale of recyclable materials; food is a common contaminant, as are broken glass and
plastic bags. Contamination is a serious issue and can reduce efficiency and lower the value of the
bale significantly. But because bales of recycled materials were low-cost to send overseas, and
because recycled materials were in such high demand, few restrictions were placed on
contamination levels until recently.
In 2017, China announced its National Sword Policy, which banned the import of 24 types of
recycled commodities and limited the amount of contamination on other materials to below 0.5
percent.3 Since the typical contamination level for recycling falls between three and five percent,
the policy effectively bans the importation of these materials from the current U.S. recycling
processing system.4 This policy became effective in early 2018 and was expanded to include an
additional 32 materials in April 2018.5
As a result, recyclers in Washington State have had to ask for permission to landfill materials,6
cities have suspended their recycling programs,7 municipalities have restricted the types of
materials they will accept,8 and rates have had to rise as materials that formently generated
revenue now cost haulers and processors money.9 While some recyclers have found markets in
other Southeast Asian countries, this does not offer a long-term solution, since these countries
are also beginning to increase restrictions of scrap imports.10 With a large amount of collected
material from its recycling programs, Washington State faces an issue of how to divert this waste
from the landfill to appropriate markets.
WASHINGTON STATE RECYCLING DEVELOPMENT CENTER |4|2.2 Regulatory Context
The new Recycling Development Center does not exist in a vacuum; it will need to adhere to
Washington State’s existing regulatory framework. The Recommendations in Chapter Five were
developed with this framework in mind to determine which recommendations are politically and
legally feasible and which policies could be translated into tools to advance the Center’s purpose
to reduce waste and increase material recovery. The state’s solid waste policy is defined by several
legislative bills that have passed since 1969.
Most recently, the Washington State Legislature passed House Bill (HB) 154311—an act relating to
sustainable recycling in 2019. HB 1543 amends sections of chapter 70.95 RCW, chapter 70.93
RCW, and adds a new chapter to Title 70 RCW. The bill states the value of recycling and waste
reduction and stresses the importance of recycling commodity markets in response to strict
international regulations. HB 1543 also creates the Recycling Development Center within
Ecology. According to the bill:
“The purpose of the center is to provide or facilitate basic and applied research and
development, marketing, and policy analysis in furthering the development of markets
and processing for recycled commodities and products. As used in this chapter, market
development consists of public and private activities that are used to overcome
impediments preventing full and productive use of secondary materials diverted from the
waste stream and that encourage and expand use of those materials and subsequent
products. In fulfilling this mission, the center must initially direct its services to
businesses that transform or remanufacture waste materials into usable or marketable
materials or products for use rather than disposal.”12
The new law also outlines a number of activities pertaining to the above purpose, and mandates
an advisory board to advise the Center. In parallel with the work of the Center, the bill mandates
contamination and reduction plans in any comprehensive waste management plan by July 1,
2021.
2.2.1 Overview of Revised Code of Washington
Solid waste planning in the State of Washington is regulated by the Revised Code of
Washington (RCW), and specifically chapter 70.95 RCW Solid Waste
Management—Reduction and Recycling.13 The last major guideline revision of 70.95 was in
1999; relevant changes since then include permit exemptions regarding beneficial use (RCW
70.95.305) and the transport and handling of recyclable materials (RCW 70.95.400-440).
Local governments prepare comprehensive solid waste management plans, and Ecology is
responsible for the review and approval of these plans (RCW 70.95.094). For a list of the most
pertinent sections of chapter 70.95 RCW, see Appendix 3.
WASHINGTON STATE RECYCLING DEVELOPMENT CENTER |5|2.2.2 Department of Ecology Responsibility
Ecology is responsible for providing technical assistance, such as planning guidelines, to cities
to help them prepare, review, and revise their waste management plans and information
related to unique local recycling and reduction plans (RCW 70.95.100).14 Ecology is also
responsible for developing a comprehensive public education program to encourage waste
reduction, source separation, and recycling as well as operating a toll-free public information
hotline.
According to RCW 70.95.263, Ecology is also responsible for developing a statewide
comprehensive waste management plan in coordination with other state departments.15
Ecology is authorized by RCW 70.95.268 to disburse funds to local governments to help them
develop solid waste recovery or recycling projects.16 Finally, RCW 70.95.280 through RCW
70.95.295 mandate Ecology to develop best practices for solid waste management, including
waste reduction and recycling, through waste stream evaluations and analyses, and to
incorporate findings into the state’s comprehensive plan.17
2.2.4 Comprehensive Waste Management Plans
Local counties and cities are required by RCW 70.95.110 to adopt comprehensive waste
management plans.18 According to the RCW 70.95.080, the purpose of the comprehensive
plans is “to plan for solid waste and materials reduction, collection, and handling and
management services and programs throughout the state, as designed to meet the unique
needs of each county and city in the state.”19 RCW 70.95.090 defines the required contents of
these waste management plans.20 Importantly, the requirements include the creation of a
comprehensive waste reduction and recycling program. We explore this further in 2.2.6
Recyclable Materials below. The plans may span more than one county and must be created in
cooperation with the cities located within the county (RCW 70.95.080).21
The State of Washington also has a comprehensive waste management plan, called the Beyond
Waste and Toxics plan,22 spanning a 20-year horizon. As stated previously, Ecology is
responsible for developing the plan. Components of the plan include data management,
materials evaluations, market identification, strategies for incentives, and technical assistance
for local jurisdictions. Importantly, the plan also includes research and data to develop solid
waste recovery and recycling projects throughout the state (RCW 70.95.260 and RCW
70.95.263).
2.2.5 Waste Handling and Rates
The state defines solid waste handling as “the management, storage, collection, transportation,
treatment, utilization, processing, and final disposal of solid wastes, including the recovery
WASHINGTON STATE RECYCLING DEVELOPMENT CENTER |6|and recycling of materials from solid wastes, the recovery of energy resources from solid
wastes or the conversion of the energy in solid wastes to more useful forms or combinations
thereof” (RCW 70.95.030).
According to RCW 35.21.120, a municipality establishes the system(s) of solid waste handling
in its jurisdiction. The handling may be through the city itself or can be contracted out to
private firms. This section of the RCW also outlines fees a city must pay a private contractor.
State regulations allow several ways for waste collection to be handled in municipalities.23
Municipalities may provide all collection and billing services, or work with private haulers to
delegate some or all of the collection and billing services. If a municipality does not provide
collection service or contract for such service, the Washington Utilities and Transportation
Commission (WUTC) sets the service area and rates (RCW 35.02.160). Unincorporated areas
in counties (RCW 36.58 RCW; RCW 81.77) must use the WUTC Franchise service providers.
In 2005, an amendment to RCW 70.95 passed that required transporter registration and
recycling facilities notification with penalties for noncompliance. This amendment ensures
that recyclable materials from commercial and industrial facilities are transported to MRFs or
companies that reuse recyclable materials, and not to disposal facilities or landfills.
2.2.6 Recyclable Materials
RCW 70.95.030 defines recyclable materials as “those solid wastes that are separated for
recycling or reuse, such as papers, metals, and glass, that are identified as recyclable material
pursuant to a local comprehensive solid waste plan.” Conversely, solid waste(s) is defined in
the chapter as “putrescible and non-putrescible solid and semi-solid wastes including, but not
limited to, garbage, rubbish, ashes, industrial wastes, swill, sewage sludge, demolition and
construction wastes, abandoned vehicles or parts thereof, and recyclable materials.”24
Per the required county and city comprehensive waste management plans, jurisdictions are
required to include waste reduction and recycling plans that “reduce the amount of waste
generated, provide incentives and mechanisms for source separation, and establish recycling
opportunities for the source separated waste.”25 The recycling program should be supported by
data, such as existing recyclable markets, waste generation trends, and waste composition; a
description of existing programs and program needs; and an implementation schedule for
designated recyclable materials.
2.3 Materials
An assessment of recovered materials is crucial in answering what commodities the Center
should focus on. Such an assessment depends on factors, including market demand and the
economic and environmental benefits and costs. We analyzed relevant materials literature on the
four major categories of recycled materials: paper products, plastics, glass, and metals. Figures 1,
WASHINGTON STATE RECYCLING DEVELOPMENT CENTER |7|2, and 3 provide information on the environmental benefits of recycling materials including the
energy reduction from recycling—pulled from the U.S. EPA Waste Reduction Model (WARM)
analysis—as well as environmental concerns with landfilling, an overview of the market elements
of each material, and larger industry trends.
● Paper products – Corrugated cardboard, mixed paper, and newspaper are the most
widely accepted recycled materials and are easily processed. Paper products face
significant issues with contamination, however, and were the markets hardest hit by
China’s National Sword policies.
● Plastics – Plastics are organized into seven major categories, and recycling varies widely
between them. Plastics pose the most health risks when landfilled but can be difficult to
process, and some types require secondary processing to be marketable. There are strong
export markets for some types of plastics, but those markets can be volatile.
● Glass – Glass is widely accepted and does produce some environmental benefit from
recycling. It breaks frequently during the process and poses unique recycling challenges
because of this. Of all the materials, glass has the most localized markets and does not
currently have an export market.
● Metals – Metals are a small but healthy portion of the recycling market and pose minimal
challenges.
WASHINGTON STATE RECYCLING DEVELOPMENT CENTER |8|Figure 1: Detailed Overview of Recycling Paper Products (Corrugated Cardboard, Mixed Paper, and Newspaper)
Energy Recycling Markets Elements
Reduction Environmental End Markets
Secondary from Concerns with
Material Use Recycling1 Landfilling Recycling Processing Domestic Export
Easily and
effectively sorted in
MRFs
Less ideal for
sorting if wet or
food contaminated
Liner, Smaller pieces of
boxboard, Collected in cardboard Local markets in
Corrugated and paper ALL programs miss-sorted into Longview, WA and in Significant effect from
Cardboard bags. 53% none (100%) other paper streams Oregon National Sword
Shredded paper is
Collected in too small to be
ALL programs sorted by MRFs and
(100%) contaminates other
commodities
Liner, Quality of No local mills accept
corrugated materials Less ideal for mixed paper from Pacific
Mixed cardboard, collected is fair sorting if wet or Region MRFs because of Significant effect from
Paper kraft pulp n/a none but decreasing food contaminated high contamination National Sword
Paper,
hardback Collected in
books, ALL programs Challenge to keep
newspaper, (100%) the newspaper
phone uncontaminated
books, Quality of during processing, No local mills accept
Paper advertising materials is fair, increasing newspaper from Pacific
Products inserts, dependent on contamination over Region MRFs because of Significant effect from
(14.9%2) Newspaper paper bags 46% none dry time high contamination National SwordFigure 2: Detailed Overview of Recycling Plastics (#1-7)
Energy Recycling Markets Elements
Reduction End Markets
from Environmental
Material End Use Recycling Concerns Recycling Processing Domestic Export
Textiles, The quality of plastics Major established domestic
carpets, collected in markets
pillow commingled recycling
stuffing, systems is fair Market can be volatile
boat sails, Major established domestic
auto parts, Separation uses a markets
shoes, combination of hand
#1 luggage, and machine sorting Market can be volatile Strong export markets
PET/PETE winter coats 50%
Often baled materials Barrier is that there is not
are shipped to a enough price advantage over
secondary processor virgin resin7
(PRF) for further
sorting Manufacturers stated that the
Plastic most common piece of
crates, Collected in Plastic bags and film equipment they needed was a Strong export
lumber, ALL programs tangle in machine gears vented or vacuum-degassing
#2 HDPE fencing 71% (100%) and are often too extruder8 Markets can be volatile
contaminated or low
High - Plastics Collected in quality to recycle
that escape SOME
#3 - #7 landfilling are a programs (7% High contamination
PVC, persistent - 49%) from food Only non-bottle rigid film Only plastic resins and
LDPE, PP, marine and expanded polystyrene PP have strong export
PS, and pollutant4 and Many are not Yield loss due to caps have established US markets markets
Plastics Other pose a toxic collected in and labels of plastic
(10.2%3) Plastics n/a health risk5. programs bottles6 Volatile Markets can be volatileFigure 3: An Overview of Recycling Glass and Metals
Energy Recycling Markets Elements
Reduction End Markets
Secondary from Environmental
Material Use Recycling Concerns Recycling Processing Domestic Export
Few - glass is an
inert and
nontoxic material
that does not
Jars, contribute to Collected in Glass breaks and
bottles, and pollution in MOST programs poses a safety risk Exclusively local markets No current export markets
Glass (2.3%) culet 34% landfills.9 (98%) to workers.10 for recycled glass exist
Aluminum foil,
trays, and pans are
often food
contaminated and About half of the market
Aluminum 96% None are difficult to sort.11 for aluminum is domestic High export demand
Cans, foil
food trays,
Metals mixed Collected in ALL Nearly all of the market is
(5.8%) Steel metals 56% None programs (100%) domestic Slowing export demand2.4 Recycling Market Trends
Since China’s National Sword, most local and state governments have focused their recycling
efforts on trying to reduce contamination by restricting certain material categories through
educational campaigns on what types of materials to recycle, switching back from a single stream
to a dual stream, or fining citizens or municipalities that have recycled products with high
contamination levels.26 Other municipalities have invested in updating MRF technology to
improve processing capabilities27; major recyclers, including Recology28 and Waste
Management,29 have invested millions of dollars into technological improvements, such as
installing optical sorters and sorting robots. While reducing contamination should always be a
goal of recycling programs, these efforts will most likely not reopen the Chinese market to U.S.
haulers, as the 0.5 percent contamination restriction has been noted to be “all but unachievable,”
especially when factoring in the price of reaching that level.30
Looking beyond contamination, haulers have shifted the countries where they send their
processed materials; instead of sending these exports to China, they are being shipped to other
Southeast Asian countries and India.31 While these shifts in markets provide temporary relief to
the stressed recycling system, Vietnam32, Malaysia33, and Thailand34 have plans to limit or ban
certain categories of waste imports. Therefore, other market solutions will need to be developed
for the long-term benefit of U.S. recycling.
To address this issue, manufacturers are increasing the capacity for domestic recycled paper.
Late in 2018, the Northeast Recycling Council (NERC) announced a list of 17 U.S. paper mills,
which will increase the facilities’ ability to utilize recycled paper as a feedstock; these facilities
will specifically target the use of old corrugated containers and residential mixed paper.35
2.5 Recycling Processing Facilities in Washington State
All materials collected for recycling from residents in the State of Washington go to a MRF. The
MRF accepts, sorts, processes, and bales different types of recyclables. The MRF bales recyclables
for shipment and sale to a secondary processor or end-user.36 Ecology’s most recent report of
recycling processing facilities indicated 264 MRFs and 681 recycling facilities currently operate in
Washington State. As seen in Figure 4, many of these are located in Western Washington, and are
located near densely populated areas. There are currently no recovery facilities that specialize in
only plastics or containers in Washington State. Additionally, mixed paper makes up a large
percentage of the residential waste stream. Although mixed paper is routinely processed in MRFs
throughout the state and previously had strong export markets, the majority of bales produced by
MRFs as feedstock for end-use manufacturers were exported to China before its recent policy
changes. It has environmental benefits when used as a feedstock for making fiber products.
WASHINGTON STATE RECYCLING DEVELOPMENT CENTER | 12 |Figure 4. Washington State Recycling and Material Recovery Facilities37
2.5.1 Plastic Recovery Facilities
Most MRFs are able to process plastics #1 and #2, but #3 through #7 pose additional
difficulty for such facilities. As a result, approximately 40 percent of communities across the
United States do not collect and recycle #3 through #7 plastics due to the lack of accessible
processing technology. According to EPA's 2018 Report "Advancing Sustainable Materials
Management," the amount of post-use, recoverable plastics landfilled in the United States in
2015 was estimated at 26.0 million tons.
Plastic bales from MRFs that include all polymer grades must be further sorted for optimal
post-consumer end use. Traditionally, mixed plastics must be separated for optimal end use
due to their different melting temperatures. When plastics of all grades are melted together,
separation occurs and reduces the strength of the recycled material, limiting its use.
Moreover, fillers and dyes used to create virgin plastics further complicate the recovery
process. A Plastic Recovery Facility (PRFs) is a technology that uses an optical scanner to sort
mixed plastics according to their polymer grade (1-7). Depending on the facility, sorted
polymers can be processed into bales or converted into flakes, pellets, preforms, extruded
sheets, or other secondary products.
PRFs help create a secondary market for mixed-polymer bales produced by MRFs. They also
reduce the cost and time required of MRFs to process post-consumer plastic waste. Finally,
PRFs create direct societal benefits through job creation, waste diversion, and carbon
emission reduction.
WASHINGTON STATE RECYCLING DEVELOPMENT CENTER | 13 |2.6 Financial Assistance Opportunities in Washington State
While the Washington State constitution places restrictions on the money that can be given or
loaned to an individual, company or corporation, the state’s Department of Commerce offers
financing opportunities that could apply to the Center’s work. Depending on the projects
prioritized by the Center’s staff, these could help fund new types of recycling facilities, innovative
manufacturing processes, and processing facilities in more rural parts of the state. These
opportunities include:
● Public Works Board – Authorized by RCW 43.155, this entity can loan money to local
municipalities in Washington State for the purpose of developing or repairing public work
projects, such as solid waste and recycling facilities under the current statute.38 These
loans can amount to up to $1 million in pre-construction costs and up to $10 million
construction costs. These loans should be researched to determine their appropriateness
for improving recycling processing, such as the creation of a plastics recovery facility in
Washington.
● Community Economic Revitalization Board (CERB) – Local municipalities can apply for
both loans and grants from the CERB. Projects must provide an economic development
outcome, which includes private business investment or job creation.39 While recycling or
solid waste facilities do not meet the criteria for the main list of eligible projects, the state
authorized the development of incubation facilities within certain Innovation Partnership
Zones (IPZs). These zones foster partnerships between the government and targeted
private companies to increase certain forms of development. Currently, one such zone,
Grays Harbor, focuses on sustainable industry, encouraging the growth of business
practices that increase the use of renewable, recycled, and sustainable products.40 The
funding schemes of the CERB vary by project type, but the CERB could potentially offer
funding for an innovative recycling facility or manufacturing process using recycled
feedstock.
● Clean Energy Fund – As discussed in Section 4.2.2, CalRecycle—California’s state
recycling agency—has supplied loans through its Greenhouse Gas Reduction Loan
Program to local recycling projects that can demonstrate a greenhouse gas reduction tied
to their operations. Following this approach, the Washington state Clean Energy Fund
could provide an opportunity to reduce greenhouse gas emissions through recycling
projects and developing infrastructure to improve recycling rates for environmentally
beneficial materials.41
There are numerous additional grant programs administered by Washington State agencies
intended to create public benefit, including several in Ecology. While these grant programs are
likely not applicable to recycling today, they might serve as a model for future programs to
support infrastructure for recycling markets in the state. In addition, Washington State offers tax
incentives for certain green or renewable energy activities, such as the sales tax exemption
already in place for anaerobic digesters and biogas processing equipment.42 These types of tax
WASHINGTON STATE RECYCLING DEVELOPMENT CENTER | 14 |incentives create a model that could provide a sales and operations tax exemption for recycling
processing equipment from the Department of Revenue, if the Legislature pursued such a policy.
2.7 Other Relevant Resources and Reports
There are numerous other relevant reports that discuss what we have brought up here, both
specific to the Washington context and more general to the West Coast:
● 2015–2016 Washington Statewide Waste Characterization Study – The Washington
Department of Ecology worked with Cascadia Consulting Group to compile a municipal
solid waste characterization study. Initially conducted and updated in 2018, the study in
an exhaustive look at the materials and resources that are currently disposed of in
Washington. The complete report can be found here:
https://fortress.wa.gov/ecy/publications/documents/1607032.pdf
● Northwest Region Report – The Washington Department of Ecology’s Northwest Region
compiled a regional report that provides an overview of all recyclable materials, which we
relied on heavily for this report. The complete report can be found here:
https://fortress.wa.gov/ecy/publications/documents/1607028.pdf
● Recycling Market Development in the United States – The Oregon Department of
Environmental Quality (Oregon DEQ) commissioned RSE USA, a consulting firm, to
compile all of the relevant information about recycling market development in the United
States. The complete report can be found here:
https://www.oregon.gov/deq/FilterDocs/recMarketDevReport.pdf
WASHINGTON STATE RECYCLING DEVELOPMENT CENTER | 15 |Chapter Three: Research Methods
───
Our research methods, chosen with input from Ecology and the University of Washington Evans
School faculty, consist of three approaches—review of the relevant literature, case studies, and
semi-structured interviews with industry professionals.
3.1 Research Questions
Our research was guided by the following question: What are the most effective approaches that
the Washington Recycling Development Center can take to reduce overall waste and increase
recycling rates in response to changing markets and the recent China’s National Sword policy? In
order to answer this question, we focused on the following four sub-questions:
1. What are the staffing needs, organizational objectives, and tasks for the proposed
Recycling Development Center?
2. What recoverable materials do current markets demand?
3. What recoverable materials and recycling processes are the most environmentally and
economically beneficial?
4. What are potential regional partnership and public-private partnership models that the
Recycling Development Center can implement around secondary recycling market
development?
To answer the research questions, we focused on reviewing relevant literature—academic
literature, policy briefs, and other reports. We also conducted exploratory case studies of 11 other
approaches and semi-structured interviews of 31 industry professionals.
3.2 Qualitative Analysis of Data Collected
We chose to seek answers through qualitative, rather than quantitative, analysis because the
stories and insights can provide a more comprehensive understanding and context through
which to understand a future Recycling Development Center.43 We also decided to forego a
robust quantitative analysis because this research field lacks strong data, resulting in an inability
to be statistically significant in our conclusions.
We used exploratory case studies to analyze other approaches including regional partnerships,
public private partnerships, and other recycling development centers—both past and present.44
WASHINGTON STATE RECYCLING DEVELOPMENT CENTER | 16 |Our goal was to understand successes, failures, and how this information might be applied to a
new Recycling Development Center in Washington.
We also conducted semi-structured interviews with 31 government representatives, recycling and
waste industry professionals, recyclable materials manufacturers, and recycling coalition and
non-profit industry experts. We began with a list of stakeholders provided by our project partners
at Ecology and snowball-sampled45 outward until data saturation occurred.46 Interviews were
guided by a central interview protocol with sub-questions for different sectors.
3.3 Criteria for Evaluating Recommendations
After collecting and analyzing the data, we established the following criteria for evaluating
recommendations:
1) Effectiveness – How well does the recommendation advance the mission of the Center?
a) Environmental Effectiveness – What are the environmental impacts of
implementing this recommendation?
b) Market Impacts – How well does this recommendation solve the market impacts
of China’s National Sword policy?
2) Cost – How much will the recommendation cost to implement?
3) Institutional Feasibility – Is the recommendation feasible under both existing law and
staffing levels?
4) Distributional Equity – What are the distributional outcomes of implementing the
recommendations? Will it affect certain populations in Washington more than others?
We used these criteria to evaluate the recommendations that we discovered through interviews or
case studies. Political feasibility is typically an important criterion for evaluating
recommendations in a policy analysis framework. We chose not to include this in our list,
however, because we felt that the Ecology staff who are implementing the Recycling Development
Center would be better equipped to judge the delicate political feasibility and would have a more
nuanced understanding of the current Washington State political landscape.
3.4 Methods for Creating Work Plan
The work plans break down the recommendations from Section 5.1 into tasks by staff member. It
also outlines which tasks should be overseen by consultants. We have incorporated functions
WASHINGTON STATE RECYCLING DEVELOPMENT CENTER | 17 |required of the Center by HB 1543; the Center’s staff roles and general duties were adopted from
its fiscal note, and expanded or shifted slightly when aligned with other responsibilities or
projects. The work plans’ activities, assigned tasks, and workloads were also informed by the
organizational structure section of the case studies in Chapter Four and by interviews with
industry leaders.
WASHINGTON STATE RECYCLING DEVELOPMENT CENTER | 18 |Chapter Four: Findings
───
This chapter outlines our findings from two major sources: case studies and industry interviews.
In Section 4.1, we include findings from 11 case studies—three on government programs, three on
recycling development councils, and five on recycling partnerships. In Section 4.2, we provide
initial findings from our interviews with nonprofit, private, and public industry experts focusing
on key market materials and the potential role of the Recycling Development Center. For an
expanded case study overview, please refer to Appendix 2.
4.1 Case Studies
For a deeper understanding of market development models, we conducted case studies of the
Clean Washington Center—the former Washington-based organization that sought to develop
secondary markets for recycling—as well as recycling development councils and public-private
partnerships. The following case studies inform our recommendations for Washington’s new
Recycling Development Center. Moreover, an organizational management study, embedded in
the study of recycling development councils and recycling partnerships, will provide examples of
staffing, funding structures, and programs that the Center could replicate.
4.1.1 Government Program: Washington - The Clean Washington Center (Defunct)
Background: When the Washington State Legislature passed a law requiring municipalities to
provide curbside recycling to residents, it also tasked the former Washington State
Department of Trade and Economic Development to conduct a study on recycling markets.
The resulting study led to the creation of the Committee for Recycling Markets, which
recommended that the Legislature create an entity focused on establishing markets for
recycling.47 The Legislature passed SB 5591 in 1990, which established the Clean Washington
Center (CWC) that same year.48
The original bill appropriated $2 million from the Solid Waste Account for the CWC’s first
year; the Solid Waste Account and the Litter Account each provided half of the second year’s
funding of $2.1 million. For the following four years, the funding was a mix of state and
federal sources.49 The federal matching grants came from a cooperative venture with the
National Recycling Coalition, called the Recycling Technology Assistance Partnership or
ReTAP.
The primary goal of the CWC was to make the use of recycled materials cost-competitive with
the use of virgin materials and to encourage the substitution of these recycled materials for
WASHINGTON STATE RECYCLING DEVELOPMENT CENTER | 19 |their virgin counterparts.50 The CWC worked with private businesses, the public, all levels of
governments, and members of academia to identify the issues facing a recycled material
category and work with these parties to mitigate any barriers and improve the likelihood that
recycled materials get reused as feedstock.51 During its initial research phase, the CWC
conducted key informant interviews to identify barriers to using recycled feedstock and to
guide informal strategic planning sessions. These sessions were facilitated by CWC’s
commodity specialists and were meant to uncover the overlap between the supply of a
recycled material and the potential demand for that material. From these meetings,
commodity specialists put together a plan that outlined the strategies, barriers, and
opportunities that could maximize the markets for their material.
The CWC researched the economic forecasts for distinct recycled materials and recycling
systems across Washington State, finding that when municipalities collect low-density
materials, it lowers the cost effectiveness of the overall system.52 When researching cost
differences between the recycled and virgin materials, it researched five categories of
materials: old newspapers, glass containers, high density polyethylene (HDPE) milk jugs,
polyethylene terephthalate (PET), and yard waste. This analysis found that the price
differences between virgin and recycled materials to be minimal across these categories:
● Newspaper – Old newspapers generally led in cost savings for manufacturers, but
other factors, such as distance, could dramatically shift these results.
● Glass – Due to material loss during transporting, processing, and melting stages,
virgin and recycled glass maintained similar costs.
● HDPE – Recycled HDPE had a slightly higher cost than virgin HDPE.
● PET – The price of recycled PET was substantially cheaper than the price of virgin
PET for manufacturing carpet fiber, but was more expensive for manufacturing
two-liter pop bottles.
● Yard Waste – Yard waste made for a significantly less expensive product, but this
product also sold for less than virgin alternatives.53
The study explained that virgin materials establish limits to how much a manufacturer would
pay for the recycled materials, and it showed that including an accounting method for
disposal costs, either by weight or by volume in the overall analysis could improve the
economic benefits of using recycling materials.54 While this strengthens the argument for
using recycled materials, it does not further encourage manufacturers to utilize these
materials, due to the country’s current product stewardship laws, which place waste
management costs onto residents and municipalities instead of the manufacturers of
products.
An analysis of the CWC showed that it had a positive effect on market demand for recycled
commodity markets, and clients overall valued the services that CWC provided, including the
WASHINGTON STATE RECYCLING DEVELOPMENT CENTER | 20 |distribution of information about ideas, networking opportunities, technical services, and
mediation services, which brought disparate groups together to work through problems.55
Despite an overall positive perception of the CWC, a number of industry leaders had major
concerns around the operations and achievements of the CWC, including that it could not
clearly quantify its achievements; that it favored large or highly visible products; that it
focused too much on the private sector and neglected the public sector; that it did not attack
the problem enough at the policy level; and that it was too bureaucratic.56
The original bill called for the CWC to sunset on June 30, 1997. Many expected the funding
for the CWC to be extended, but shortly before the sunset date, the Legislature decided not to
continue funding the program. Potential contributing factors to the decision to sunset
include: a shift in political power within Washington’s Legislature, the growing exports of
recycled material to countries like China, opposition from competing industries, and the
notion that CWC had already accomplished its mission.
Therefore, in 1997, after six years of being a state-run program, the CWC had to scramble to
find a new home. Due to a connection through CWC’s leadership, it became a program of a
small nonprofit, called the Pacific Northwest Economic Region (PNWER), which supports
economic partnerships among Montana, Oregon, Washington, British Columbia, and
Alberta.57
The wages for the large staff of the CWC financially strained PNWER, and without the State’s
grants, the CWC struggled to secure matching funds for the federal ReTAP grants. After a loss
of both PNWER and CWC leadership, the remaining staff of PNWER was able to negotiate
more time with the federal government to finish out the work on CWC’s grant; once this
period concluded, the CWC stopped operations. From its inception to the time it came under
PNWER, CWC worked with 500 companies to facilitate the use of recycled materials in the
manufacturer process and is credited with creating 14,000 jobs. 58
Lessons and Recommendations:
● Keep the mission targeted and focus on high-priority materials.
● When working with industries to find the barriers and opportunities, speak with staff
that oversee day-to-day operations and understand the company’s manufacturing
process on an operational level (i.e. general managers).
● Develop strong relationships with businesses. When working with this private
companies on market development, encourage them to consider industry-level
solutions and opportunities as well as their own business interests.
● Create a place for stakeholders to share knowledge and uncover processes or
technologies to improve recyclability rates.
WASHINGTON STATE RECYCLING DEVELOPMENT CENTER | 21 |Organizational Structure: The CWC was broken down into functional areas, each with a
specific set of objectives to improve recycling:
● Business Assistance program – Provided technical assistance to businesses through
an in-house expert for each material category.
● Technology ReTAP program – Offered engineering services and technical
information to incorporate new technologies that would improve recycling rates of
specific materials. The program tested products with recycled content, evaluated
equipment and recovered materials, and analyzed the recycling process.59
● Policy and Research program – Informed policymakers on the barriers and
infrastructure needs of recycling markets.
● Marketing program – Introduced and promoted new products to the marketplace to
increase the use of recycled materials in the manufacturing sector.
● Management Support program – Supported CWC through administrative services.60
The CWC had 24 full-time employees: three employees in the Office of the Director, five in
Business Assistance, eight in Technology ReTAP, one in Policy and Research, four in
Marketing, and three in Management Support.61 Before moving to PNWER, the CWC was a
part of the Department of Trade and Economic Development. Since it did not work closely
with Ecology, it often duplicated Ecology’s recycling efforts and studies.62
4.1.2 Government Program: California - CalRecycle
Background: Known as CalRecycle, California's Department of Resources Recycling and
Recovery leads the state toward its goal of a 75 percent recycling rate by 2020. CalRecycle’s
Materials Management and Local Assistance Division offers financial and technical assistance
to businesses and manufacturers, which advance the use of recycled content materials as
feedstock. It offers targeted grants for the recycling of specific products, such as tires, and
loans for businesses and manufacturers that meet certain criteria or targets. Using funds
from the state’s Cap-and-Trade program through California Climate Investments,
CalRecycle’s Recycled Fiber, Plastic, and Glass Grant Program awarded more than $11 million
to five private companies that developed projects focused on boosting the recycling rates of
#2, 4, and 5 plastics in the state, as well as one project to recycle windshield glass.63
To further encourage secondary market development in California, CalRecycle offers a
number of other financial assistance opportunities targeted toward companies which process
recycled materials or manufacture products with recycled content. For the 2018 to 2019 year,
the Recycling Market Development Revolving Loan Program has had $3,565,000 of available
funds with a four percent interest rate; these funds are available to companies in designated
recycling zones. As of mid-January 2019, its Greenhouse Gas Reduction Loan Program had
WASHINGTON STATE RECYCLING DEVELOPMENT CENTER | 22 |$3,250,000, also with a four percent interest rate. To qualify for this loan, an applicant must
prove that it can reduce greenhouse gas emissions through its operations. The loan program
partners with Governor’s Office of Business and Economic Development (GO-Biz) to provide
facility siting, permitting assistance, and technical support.64
Lessons and Recommendations:
● Build and maintain a database of private companies, packaging manufacturers, and
trade councils. Solicit their feedback through workshops and presentations.
● Align the recycling market development programs with other environmental and
financial programs and initiatives of the state to reduce internal competition for
resources.
● Permitting facilities can take a long time, so allow time for this process when
developing goals and targets for the Recycling Development Center.
Organizational Structure: CalRecycle’s Materials Management and Local Assistance Division
has staff teams with differing focus areas, including business assistance programs, financial
loans, grants, and technical assistance. It also partners with the Governor’s Office of Business
and Economic Development (GO-Biz) to assist in business development.
4.1.3 Government Program: Colorado - NextCycle
Background: For many years, Colorado has offered grants to companies for market
development through funds directed from tipping fees. As a response to the China National
Sword, Colorado Department of Public Health & Environment expanded its market
development efforts and, in collaboration with consultant RRS, developed a virtual business
incubator program for companies looking to establish or expand the use of any recycled
material in Colorado.
The first cohort of nine companies was chosen in the beginning of 2019. The cohort included
local startup companies and firms from outside of Colorado interested in establishing a
location within the state. The program offers a grant of $5,000 per company to be used as
seed funding, as well as technical assistance, business development mentoring, and data
sharing. The participating cohort members give feedback to each other’s business plans and
projects at a one-day, in-person accelerator. Additionally, each cohort member has the
opportunity to pitch its idea and gain additional support from other companies or investors at
the Summit for Recycling, the state’s annual recycling conference. After the conference,
WASHINGTON STATE RECYCLING DEVELOPMENT CENTER | 23 |cohort members receive final feedback from NextCycle, and the cycle of the program
concludes; participants can then apply for the established recycling grants.65
Lessons and Recommendations:
● Provide a platform for companies to share business and technical knowledge
regarding recycling.
● Many individuals starting companies to improve recycling outcomes are motivated to
solve an environmental problem; for many of these individuals, the business model is
not what drove them to start the company. Offer guidance in the development of a
business model for participating companies.
● A business incubator model allows time for a company to better develop a business
plan and solicit feedback from stakeholders and advisors before seeking a larger
grant from the program.
Organizational Structure: The Department of Public Health & Environment has a Recycling
Grants Administrator that acts as a liaison to the consultant company that works on the
operations of the program. Three primary consultants from RRS work on NextCycle, while
other subject matter experts from within the company support the projects.
4.1.4 Recycling Development Council: Southeast Recycling Development Council
Background: The Southeast Recycling Development Council (SERDC) is an 11-state
organization established in 2006. The SERDC’s mission is to: 1) increase collection and
recovery of quality recyclable material; 2) foster economic development via the recycling
industry; and 3) create a greater awareness of the recycling industry’s impact in the
southeast. SERDC fosters partnerships through direct participation, events, and grants;
conducts outreach and public education; and recommends best practices by offering
frameworks, such as the Pay As You Throw (PAYT) strategy.66
Lessons and Recommendations:
● Provide financial assistance through grant programs, sponsored by partnerships
between different sectors. SERDC offers a recycling infrastructure grant program,
supported by the Recycling Partnership and the Coca Cola Foundation, to help fund
recycling infrastructure, such as recycling carts and material recovery facility upgrades.
WASHINGTON STATE RECYCLING DEVELOPMENT CENTER | 24 |● Partner with and create regional recycling partnerships. SERDC partnered with
Alabama Recycling Partnership to provide economic and policy analysis on recycling
practices in Alabama. SERDC and its partners convened to create SERDC 120, a
120-day and a 120-member workgroup. This group established the Recycling
Partnership, a public-private partnership, with a goal to increase the recovery of
recyclables in the region (See Section 4.2.8 for more information on the Recycling
Partnership).
● Publish monthly newsletters to share current news and information on upcoming
events to members.
● Host summits, special focus events, forums, workshops, and webinars. SERDC hosts a
biennial summit in different cities throughout the Southeast.
● Offer educational resources, such as maps, economic reports, market directories, and
waste exchange information.
Organizational Structure: SERDC, a 501(c)3 non-profit organization consists of a board
comprised of an executive committee, a general board, an ex officio committee, and two staff
members. The executive committee includes a Chair, First Vice Chair, Second Vice Chair,
Treasurer, and Secretary. The general board consists of 12 members from the private and
nonprofit sectors, and the ex officio committee consists of a member each from the Alabama
Department of Environmental Management, the EPA Region 4, Waste Management, and KW
Plastics Recycle. The general staff includes an Executive Director and Director of Outreach
and Member Services. SERDC is supported by membership and sponsor support, state
agency partnerships and grants, and EPA grants.
4.1.5 Recycling Development Council: Northeast Recycling Council
Background: The Northeast Recycling Council (NERC) is a 30-year-old organization that
serves 11 states in the Northeast region of the United States. NERC’s main services are:
research, technical assistance, demonstration projects, and education.68 NERC works on
projects focusing on toxics in packaging, electronics recycling, glass, and organics
management. In addition to the aforementioned priorities, NERC’s board listed plastics #3
through #7 and recycling market development support as its priorities for the fiscal year of
2019.69 Notably, from its most recent annual report, NERC implemented a joint strategic
action plan with the Northeast Waste Management Officials Association. The plan included
joint webinars, a new regional Recycling Markets Development Workgroup, and projects with
the West Coast Climate Forum. Through its website, NERC provides resources including
individual member state information, a search feature for research purposes, and a blog that
WASHINGTON STATE RECYCLING DEVELOPMENT CENTER | 25 |You can also read