Developing the use of visual representations in the primary classroom - Patrick Barmby, David Bolden, Stephanie Raine & Lynn Thompson
←
→
Page content transcription
If your browser does not render page correctly, please read the page content below
Developing the use of visual
  representations in the
    primary classroom

Patrick Barmby, David Bolden, Stephanie Raine &
                Lynn Thompson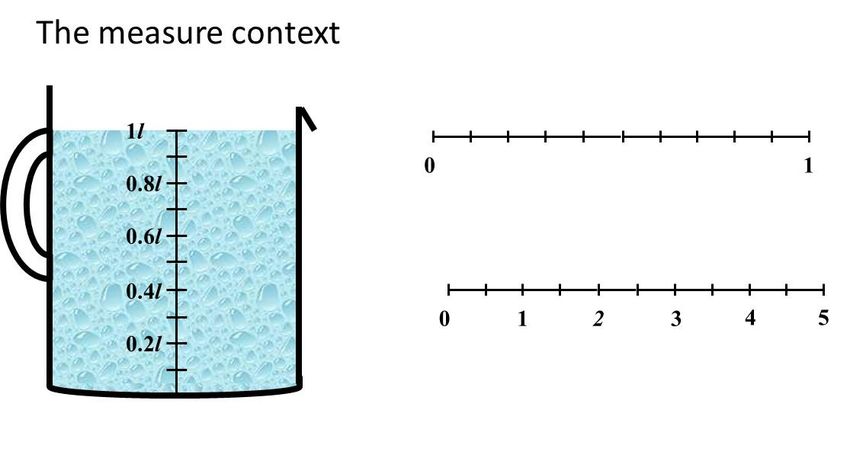
Developing the use of visual representations in the primary school

                                1
Developing the use of visual representations in the primary school

Contents

Acknowledgements ........................................................................................... 3

1. Introduction ................................................................................................. 4

2. The research on visual representations ....................................................... 6
  (a) The importance of visual representations ................................................. 6
  (b) The possible drawbacks to visual representations ..................................... 7
  (c) The empirical evidence for using visual representations............................ 7
  (d) A focus on multiplication and fractions ..................................................... 8
  (e) A professional development programme for teachers ............................ 13

3. Methods used in the study ........................................................................ 16
  (a) The experimental design ......................................................................... 16
  (b) Qualitative methods ................................................................................ 18

4. Results of the study ................................................................................... 20

5. Conclusions drawn from the study ............................................................ 27
  (a) Impact on pupils ...................................................................................... 27
  (b) Impact on teachers .................................................................................. 29
  (c) Barriers for teachers ................................................................................ 30

6. Evaluation of the study and recommendations for developments ............ 31
  (a) Benefits of the project ............................................................................. 31
  (b) Drawbacks to the project ........................................................................ 33
  (c) Improvements to the project ................................................................... 34

7. Next steps .................................................................................................. 36

References ....................................................................................................... 41

Appendix A: Multiplication test used ............................................................... 45
Appendix B: Fractions test used ....................................................................... 49

                                                         2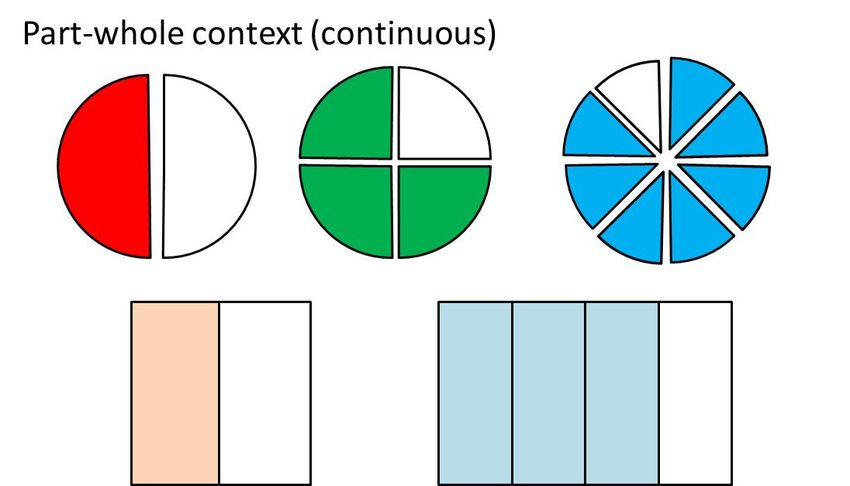
Developing the use of visual representations in the primary school

Acknowledgements

The authors of the report would like to thank the Nuffield Foundation for their
funding of this project. The Nuffield Foundation is an endowed charitable trust
that aims to improve social well-being in the widest sense. It funds research
and innovation in education and social policy and also works to build capacity
in education, science and social science research. The Nuffield Foundation has
funded this project, but the views expressed are those of the authors and not
necessarily those of the Foundation. More information is available at
www.nuffieldfoundation.org

Also many thanks to the schools who participated in the project and the
mathematics coordinators involved for their enthusiasm and dedication.

                                             3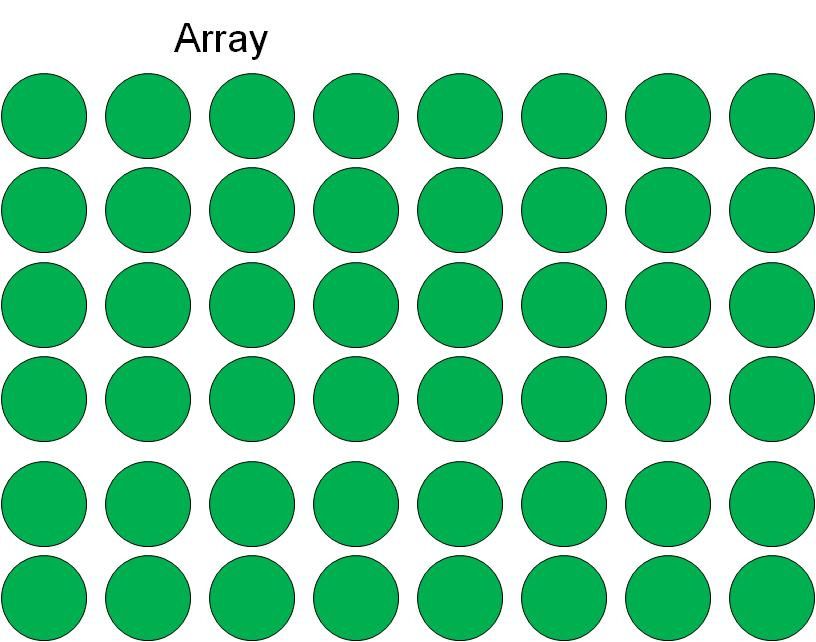
Developing the use of visual representations in the primary school

1. Introduction

The Nuffield Foundation funded a research project that ran from September
2011 to July 2012. The aim of this project was to involve 8 maths coordinators
from the Durham region in professional development sessions looking at
developing teachers’ use of visual representations for mathematics in the
primary classroom. The sessions drew on the research on how we can use
visual representations in the classroom, specifically looking at representations
of multiplication and fractions.

Coordinators taking part in the project attended three one-day sessions,
looking at how the research ideas on representations could be applied in the
primary classroom. Coordinators were then asked to work with Year 3 and Year
5 teachers in their schools in order to try and incorporate these ideas into
practice. The impact of the project was assessed through pre- and post-tests
for pupils on multiplication and fractions, observations of Year 3 and Year 5
lessons, interviews with the Year 3 and Year 5 teachers, and interviews with
the maths coordinators involved. In carrying out this project, there was an
observed impact on the pedagogy of teachers involved and the mathematical

                                              4
Developing the use of visual representations in the primary school

understanding of pupils. The project provided an example for taking the
research on representations and applying these ideas in schools, and therefore
highlights improvements that we could make in the future.

The findings of the project were disseminated at a one-day conference held at
Durham University in July 2012. Coordinators involved in the project were
invited to present their experiences of being part of this project at this
conference. In addition to the dissemination conference, an outcome of this
project is this report detailing the project and its findings. The National Centre
for Excellence in Teaching Mathematics (NCETM) has agreed to make this
report available through their website and so disseminate the project’s
findings to teachers throughout the UK.

In this report, we begin by outlining the research on using visual
representations of mathematical ideas in the classroom. We then provide the
design of the project in terms of the training for teachers and also in terms of
measuring the outcomes of the project. The results of the project are then
presented, and then the conclusions that are drawn from the project. The final
section of this report looks at the results of the external evaluation carried out
for the project.

                                              5
Developing the use of visual representations in the primary school
2. The research on visual representations
(a) The importance of visual representations
Research has highlighted the importance of visual representations both for
teachers and pupils in their teaching and learning of mathematics. The use of
multiple representations in general is an important part of teachers’
knowledge of mathematics and they can play an important role in the
explanation of mathematical ideas (Leinhardt et al., 1991).
“Skilled teachers have a repertoire of such representations available
for use when needed to elaborate their instruction in response to
student comments or questions or to provide alternative
explanations for students who were unable to follow the initial
instruction” (Brophy, 1991, p. 352)
Also, external representations can highlight specific aspects of a mathematical
concept (e.g. the array representation illustrating the commutative and
distributive nature of multiplication – see below), therefore supporting this
process of explanation (Kaput, 1991; Ainsworth, 1999). In addition, the ability
6Developing the use of visual representations in the primary school
to draw on multiple representations is an important aspect of pupils’
mathematical understanding (Hiebert & Carpenter, 1992; Greeno & Hall,
1997). Visual representations enable pupils to make connections between their
own experience and mathematical concepts (Post & Cramer, 1989), and
therefore gain insight into these abstract mathematical ideas (Duval, 1999;
Flevares & Perry, 2001).
(b) The possible drawbacks to visual representations
In addition to recognising the benefits of using visual representations, the
possible difficulties involved in using these in the classroom must also be
acknowledged. In particular, teachers cannot assume that students recognise
these representations in the manner expected (Hall, 1998); the meaning that
particular representations have for the teacher may be quite different to the
meaning they have for the student (Cobb et al., 1992). Therefore, if particular
representations are to be used in the classroom, then teachers need to
support students in learning to interpret representations (Flevares & Perry,
2001), through providing “effective transitional experiences” (Boulton-Lewis,
1998, p. 222) to support students’ progression onto using these different
representations.
(c) The empirical evidence for using visual representations
Perhaps due to these possible drawbacks, despite the theoretical importance
of visual representations in the teaching and learning of mathematics, the
empirical evidence to support the use of these representations in the
7Developing the use of visual representations in the primary school
classroom is mixed and somewhat lacking. Sowell (1989) carried out a study
looking at the effectiveness of external representations in mathematics
classrooms and concluded that there were no significant benefits associated
with using visual representations in comparison to more abstract
representations. A more recent meta-analysis by Gersten et al. (2009) found
more positive results. This study looked specifically at mathematics instruction
for students with learning disabilities and found that the use of visual
representations significantly benefitted students. Due to the mixed nature of
these results and the lack of empirical studies specifically looking at the use of
visual representations in the primary school context, the present study
therefore contributes to the research on this pedagogical approach to teaching
mathematics.
(d) A focus on multiplication and fractions
In trying to exemplify the theoretical issues highlighted above, we chose two
areas of primary school mathematics to focus upon in the study, namely
multiplication and fractions. In coming to understand multiplication, Greer
(1992) highlighted the importance of a range of different ‘classes of situations’.
These included equal groups, equal measures, rate, multiplicative comparison,
multiplicative change and Cartesian product situations. These different
situations are exemplified below:
4 packs of oranges, each with 3 oranges (equal groups)
3 children each have 4.2 litres of orange juice (equal measures)
8Developing the use of visual representations in the primary school
Peter walks at 2 miles per hour. In 1½ hours, he walks 3 miles (rate)
Anne has 3 times more sweets than her younger brother Robert. If
Robert has 5 sweets, how many sweets does Anne have?
(multiplicative comparison)
The apple tree in our garden has grown to 2.2 times its height that it
was five years ago. If the tree was 1.5m tall five years ago, how tall is
it now? (multiplicative change)
A crisp manufacturer produces crisps with three different
flavourings, and sold in two different sizes of bags. How many types
of bags of crisps does the manufacturer produce? (Cartesian
product)
The range of situations illustrates the range of possible representations that
can constitute our understanding of multiplication (Hiebert & Carpenter,
1992). Closely linked to these different situations, Greer (1992) also highlighted
the range of different external diagrammatic representations associated with
different contexts of multiplication. For example, equal groups can be
represented by diagrams of equal groups of objects and/or arrays respectively.
Cartesian product situations can also be represented by arrays. The number
line can be used to represent multiplication, particularly in relation to
multiplication as repeated addition. Alongside the representations highlighted
above, Outhred and Mitchelmore (2004) stated that the rectangular array
model (or area representation) is an important model for multiplication. Also,
Lampert (1986) highlighted the importance of ‘computational knowledge’,
manipulating numerical symbols often according to procedural rules. This can
be done through traditional methods of multiplication or through methods
9Developing the use of visual representations in the primary school
such as the grid method. These different visual representations of
multiplication are shown in Figure 1 below.
Figure 1: Visual representations of multiplication
10Developing the use of visual representations in the primary school
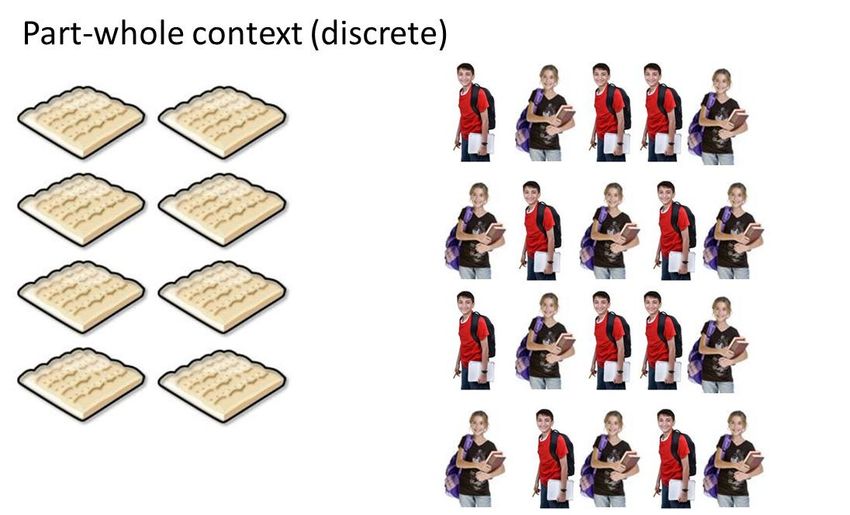
Moving on to fractions, Behr et al. (1983) stated that the topic of fractions, or
more broadly rational numbers, “involves a rich set of integrated subconstructs
and processes” (p.92). Behr et al. (1983) detailed five sub-constructs for the
rational number concept: the part-whole construct (both for continuous and
discrete quantities) and the closely-associated measure construct; the ratio
construct; rational numbers as indicated division or quotient; and rational
number as an operator (e.g. as a transforming function). Related to these sub-
constructs are the ways in which these constructs can be represented. For
example, diagrammatically, the part-whole construct can be represented by a
part of a continuous whole (e.g. a part of a shape) or by a group of discrete
objects. The measure construct can be represented by the number line. Figure
2 illustrates some of the possible diagrammatic representations for fractions.
11Developing the use of visual representations in the primary school
Figure 2: Visual representations of fractions
12Developing the use of visual representations in the primary school
(e) A professional development programme for teachers
Based on the above literature on the use of diagrammatic representations, the
research project aimed to develop the use of these representations by primary
teachers. This was carried out through a professional development programme
for teachers, the design of which was informed by the research literature of
teacher professional development, particularly with a focus on mathematics.
This literature suggested a number of key characteristics for successful
professional development programmes. Firstly, a programme should specify
and highlight subject matter and knowledge required by the teachers (Garet et
al., 2001; Borko, 2004; Hill & Ball, 2004). Secondly, a programme should
highlight how children learn that subject matter (Wilson & Berne, 1999; Franke
et al., 2001; Garet et al., 2001; Borko, 2004). Thirdly, during the programme,
teachers should be actively engaged in their learning (Desimone et al., 2002),
providing opportunities for teachers to work together (Hill & Ball, 2004) with
meaningful discussion and planning (Garet et al., 2001), with a “privileging of
teachers’ interaction with one another” (Wilson & Berne, 1999, p.195).
Fourthly, the programme should try and develop a ‘community of practice’
through professional development that is sustained over time (Garet et al.,
2001) and teacher collaborations (Franke et al., 2001).
Therefore, based on the above literature, the professional development
programme for the teachers involved in the project was structured as follows:
• Attendance at the first training day at the start of the autumn term,
looking at the general research ideas on using diagrammatic
13Developing the use of visual representations in the primary school
representations, and also focussing these ideas on multiplication, with
consideration of implications for practice.
• Attendance at the second training day at the start of the spring term,
reflecting on the results and teachers’ experiences from the first term,
and subsequently focussing the research ideas on fractions, with
consideration of implications for practice.
• Attendance at the third and final training day at the start of the summer
term, reflecting on the results and teachers’ experiences from the
project in general, and looking at the overall implications for classroom
practice and also for future research.
In addition to introducing the teachers to the research on the use of
diagrammatic representations, an emphasis during the training days was to
encourage discussions between teachers by providing necessary opportunities.
This included pairing up teachers as partners for discussion during the training
days themselves, and also requesting teachers to meet and discuss their
progress in the project outside of the training sessions. In providing the
training over three days in three different terms, the project tried to achieve
the balance between providing sustained opportunities for professional
development, and minimising the impact of taking the teachers out of schools.
Also, the design of the training was wary of ‘feed-forward’ issues (Korthagen &
Kessels, 1999), where barriers for teachers in implementing ideas may occur
due to a lack of personal concerns from the teachers about the issues at hand.
Therefore, the professional development was provided to the mathematics
coordinators from the schools involved (not directly to the class teachers),
building on their remit to improve the teaching of the subject in their
14Developing the use of visual representations in the primary school
establishments. This did have the drawback that the ‘indirect’ approach to the
transfer of the research ideas may have led to difficulties, however,
advantages were also identified through the hoped-for discussions and
reflections taking place between coordinators and class teachers.
Having described the relevant research literature associated with the project,
the next section will describe the methods used to measure the impact of the
project on teachers and pupils.
15Developing the use of visual representations in the primary school
3. Methods used in the study
The study sought to answer the following research questions:
• Did the programme of professional development for teachers result in
greater understanding of multiplication and fractions amongst pupils?
• How did the professional development programme impact on teachers’
practice in terms of using diagrammatic representations?
In answering the first research question, an experimental design was employed
in order to observe the impact of the professional development programme on
pupils. In answering the second research question, a qualitative approach was
to be taken.
(a) The experimental design
The quantitative part of the research involved an experimental design using
pre- and post-tests with children in Year 3 and Year 5 in the 8 schools of the
maths coordinators involved in the project. Year 3 was chosen because of
previous research (Barmby et al., 2009) which indicated these pupils’ lack of
16Developing the use of visual representations in the primary school
understanding of multiplication representations. Year 5 children were chosen
for fractions so that there were no constraints due to End of Key Stage 2 tests.
Initially, Year 3 pupils were given a pre-test on multiplication involving
multiplication questions requiring explanations for working out. Half of the
maths coordinators were then be asked to implement in their Year 3 classes,
over a period of up to one term (but determined by the teachers), a teaching
programme developed in the first professional development session utilising
visual representations of multiplication. At the end of the term, a post-test was
carried out in all 8 schools with the Year 3 children. This process was repeated
in the second term, with Year 5 pupils and the topic of fractions, with the other
half of the maths coordinators implementing a teaching programme in their
Year 5 classes. The experimental design can be summarised follows:
Table 1: A summary of the experimental design
Schools Group Autumn Term (focus on multiplication/Year 3s)
A, B, C, D Treatment 1 Pre-test Implementation Post-test
E, F, G, H Treatment 2 Pre-test No implementation Post-test
I, J Control Pre-test Post-test
Schools Group Spring Term (focus on fractions/Year 5s)
A, B, C, D Treatment 1 Pre-test No implementation Post-test
E, F, G, H Treatment 2 Pre-test Implementation Post-test
I, J Control Pre-test Post-test
17Developing the use of visual representations in the primary school
The methodological design provided a quantitative measure of the impact of
the teaching programmes on pupils, with a comparison at each stage of the
project between the schools receiving the training, and also with the schools
not receiving the training.
The study involved 10 volunteer schools (A to J) in the North East of England,
with schools being randomly allocated to the different groups. The sample
sizes of children were 109 and 106 for treatment group 1, 121 and 106 for
treatment group 2, and 44 both terms for the control group in each of the
autumn and spring terms respectively.
The tests used in each term were constructed specifically for the study, with a
focus on children’s understanding of multiplication and fractions. In each term,
the same test was used for the pre- and post-test. In the autumn term, a 19
item multiplication test was constructed and used, based on the research on
multiplication previously highlighted. In the spring term, a 39 item fractions
test was constructed and used, based on the research on fractions. Both these
tests are included in the Appendices to this report
(b) Qualitative methods
In addition to the quantitative approaches used above, semi-structured
interviews with coordinators and class teachers were carried out at the start,
the middle and end of each implementation to assess their views on their
practice, the teaching programmes and their impact on children’s learning of
18Developing the use of visual representations in the primary school
mathematics. We incorporated three visits to schools over the duration of
each term in order to gain insight into how teachers’ practices developed over
time. Carrying out three interviews with teachers provided opportunities to
track teachers’ practice over time. Prior to each interview, an unstructured
observation of a Year 3 or Year 5 maths lesson was also carried out to observe
how visual representations were being used in the classroom.
19Developing the use of visual representations in the primary school
4. Results of the study
In order to find out whether the programme of professional development for
teachers resulted in greater understanding of multiplication and fractions
amongst pupils, the pre- and post-test results in each term was compared
across the different groups of schools. Figures 3 and 4 compare the average
test score achieved by each group of schools (treatment schools who attended
the training and the other two control schools) at the beginning and end of
each term. Figure 3 shows the multiplication test scores. Figure 4 shows the
fractions test scores.
20Developing the use of visual representations in the primary school
Figure 3: The average pre- and post-test scores for the multiplication test
In Figure 3, we can see that the two groups of schools who attended the
training made the same progress in terms of multiplication test scores over the
course of the term (shown by the steepness of each graph), even though
treatment group 1 were the group of schools who were asked to implement
the ideas. However, both treatment groups made greater progress than the
control group schools, showing that the training programme had an impact in
21Developing the use of visual representations in the primary school
some way. The differences between the treatment groups and the control
group were statistically significant.
Figure 4: The average pre- and post-test scores for the fractions test
Figure 4 shows that this time, there was a difference in the progress made by
the schools asked to implement the fractions ideas, compared to the other
treatment group schools who attended the training but were asked not to
implement the ideas, and the control group schools. This difference was
statistically significant.
22Developing the use of visual representations in the primary school
Moving on to look at the qualitative data obtained from the interviews with
teachers and the lesson observations, the following issues emerged from this
data:
• Impact on the pupils;
• Impact on the class teachers;
• Impact on the maths coordinators;
• Difficulties faced by teachers in the project.
Looking first of all at the impact of the project on the pupils, the quantitative
data given above showed that there was an impact. This was confirmed by the
teachers, who identified children’s ability to explain and understand the
mathematical ideas, and their increased confidence as a result of the project.
They've got a better understanding of what a fraction actually is. If
we ask them what a fraction is they’ll get the vocabulary and they’ll
say it has to be equal, its starts with a whole ... And they know the
different ways of how to explain the numerator and the denominator
and things like that.
They could explain things. Some were still struggling but they could
explain things and they could draw pictures for me and they were
wanting to draw little diagrams for me.
I think it’s given them more confidence if I'm honest. I mean there’s
one little girl, I don’t know if you saw her ... She's a lower ability child
who came with no maths confidence at all, and I've tried to do
everything very visually for her. Even addition, subtraction, not just
23Developing the use of visual representations in the primary school
multiplication. And because she sees it visually, it’s easier for me to
talk it through where she’s gone wrong and correct it.
With regards to the class teachers, some of the teachers particularly in the first
term did identify changes to their practice.
I mean the way I've taught it has been definitely different. I’ve not
taught it using arrays before so I think that's had an impact on the
children but also on me.
I'm more aware of the misconceptions children have of multiplication
through doing it this way. Because you’re not just saying to them
“how have you got the answer?” They’re actually showing you, “well,
this is how I got the answer”.
In the second term however, teachers were more likely to state that “they
were doing it anyway” in terms of using visual representations. However,
teachers in both terms identified that the project had provided the opportunity
to reflect on their practice.
It has made me think more about how I would teach it and the
different ways to teach it.
Seeing the simplest visual method because sometimes it’s easy to
maybe kind of jump a step and you won’t perform the next step. So I
suppose it’s having to think “right, what’s the first stage”, and then
working through in kind of relevant and logical steps, and progress
the steps.
Likewise for the maths coordinators, they identified that the project had
developed their knowledge and practice. This was also enhanced through the
24Developing the use of visual representations in the primary school
discussions they were able to have with other teachers during the training
days.
For me, yeah, knowledge about the teaching of multiplication … I
think we’ve thought about it in a bit of a deeper kind of way, that
perhaps some children do understand but they can’t tell you what
they’re doing.
To talk about what works and it was good to get ideas and hear
about the research and some of the academic research side of it. But
then there was plenty of chance for us to talk about how it’s really
going to work in the classroom, what’s going to fit together ... It’s
always a nice chance to get together with another group of teachers
and have a talk about how things work.
Therefore, the qualitative data did highlight the impact of the project on pupils
and teachers. However, difficulties faced by the teachers were highlighted as
well. This included external pressures such as OfSTED, whether the coordinator
had time to discuss the project with the class teacher, and the timing of the
project in the second term.
So she's going to use some arrays and some visualisations to help
them with the division side of that. The only thing she said is
sometimes the work is a bit messy in the books and thinking about
the school side of it, especially because we’re due OFSTED this year,
it’s kind of make sure we’ve got lots of evidence in books and putting
it in. Sometimes it’s not the neatest work …
Not sitting down and discussing it all, just in little bits ... But that's
just the reality as it was. You know (the coordinator) went to the
thing, came back and said this is what we’re going to do. Gave us the
power point and information, the different resources that we got.
Some of the online stuff and then get on with it ... I mean to be fair it
was probably the timing that its happened as well in that he's just
25Developing the use of visual representations in the primary school
had his first baby and everything that's happened with that, and it’s
just in a primary school it’s a timing issue. When do you have time to
get together and sit down and talk when you're not running off to
football matches and various different things?
I mean part of the problem that I've had would be really that this
would have been better if we’d had this in the autumn, because it
was in the autumn term that Year 5 did this kind of fractions work.
26Developing the use of visual representations in the primary school
5. Conclusions drawn from the study
Based on the results of the study highlighted in the previous section, we drew
the following conclusions with regards the impact of the project on pupils and
teachers, and also the implications for teaching and research that it provided.
(a) Impact on pupils
It was concluded that the training programme for the mathematics
coordinators, introducing them to the research on using diagrammatic
representations, did have a positive impact on both pupils in the respective
schools. Although the nature of the impact was complex (which will be
discussed below), we found that the in general, the pupils in the schools taking
part in the project progressed significantly in their learning of multiplication
and fractions as measured by the quantitative tests. Qualitatively as well,
teachers highlighted that diagrammatic representations benefited pupils’
understanding, and also the confidence of pupils in mathematics.
In reporting the quantitative findings of the study so far, we
acknowledged that the pupils in both the treatment groups of the study in
27Developing the use of visual representations in the primary school
term 1 made the same average test gains. However, in term 2, only treatment
group 2 made the greater gains. Therefore, although the study has claimed
that the training programme did have a significant impact on pupils’ test
scores, this further complexity in the impact needs to be explained. The study
identified two possible reasons for this complexity. Firstly, in reflecting on the
results with the maths coordinators during the second and third training days
of the programme, the coordinators identified that after the first training day,
some teachers in treatment group 2 returned to school and talked to
colleagues about the training and the research project. Furthermore, it would
be unusual for a teacher to return to school after any professional
development training and not talk to colleagues about the training. Therefore,
the design of the research and asking the half of the treatment group teachers
to not do anything in the first term was unrealistic, and it was difficult for the
treatment group 2 teachers to adhere to their role as control group schools.
This problem was not reported by the treatment group 1 schools in the second
term which may explain some of the difference.
A second possible reason for this, but also related to the first
explanation, was a possible Hawthorne effect which was identified during
discussions with the mathematics coordinators. This is a problem that can arise
in field experiments and occurs when “… subjects’ knowledge that they are in
an experiment modifies their behaviour from what it would have been without
the knowledge” (Adair 1984, cited in Diaper 1990, 261-262). As has been
identified, mathematics coordinators in the non-implementing group in the
autumn term acknowledged that they returned to school and talked to
colleagues about the research project and the training they had received
28Developing the use of visual representations in the primary school
because it was a ‘new’ project. This did not seem to occur in the second term
because the project was no longer ‘new’ for the teachers involved.
(b) Impact on teachers
In addition to the impact of the use of diagrammatic representations on pupils,
the project also identified the impact of the project on teachers’ knowledge
and practice. Although not all of the teachers identified changes in their actual
classroom practice, there was some evidence both from interviews and the
lesson observations that a greater range of diagrammatic representations were
being used by teachers. More importantly, most of the classroom teachers
interviewed identified a development in awareness and knowledge about
using diagrammatic representations in their mathematics teaching. Looking at
this issue of awareness and knowledge further, both the interviews with
teachers and the observations of lessons identified a degree of progression in
the sophistication of this knowledge of use of diagrammatic representations:
Little or no use of diagrammatic representations Using a variety of
diagrammatic representations Consideration of the progression for pupils
between different representations
The qualitative findings of the project suggest that in order to maximise the
benefits for pupils, it is not a simple matter of using ‘more’ representations,
but also to consider how the teachers and the pupils themselves can make the
connections between different representations.
29Developing the use of visual representations in the primary school
(c) Barriers for teachers
The aspects where the training programme was less successful, as identified by
the interviews with coordinators, were that that little or no discussion with
one another took place outside the training days, and also highlighted the
short-term nature of the project. In terms of encouraging collaborative
working between the coordinators and the class teachers as well, the results of
the project were rather mixed. In some cases, the context of the school and
the class teachers (e.g. NQTs) positively supported collaborative working. In
other cases however, the influence of external pressures, time and unforeseen
circumstance impacted negatively on these collaborations. These factors can
be drawn upon to make future improvements to the design of the project, and
will be further highlighted in the next section.
30Developing the use of visual representations in the primary school
6. Evaluation of the study and recommendations for developments
In addition to drawing on the results of the study, an external evaluation of the
project was carried out by Dr Stephen Atherton from Aberystwyth University.
This external evaluation involved separate interviews with the mathematics
coordinators involved in the project, looking specifically at the benefits and
drawbacks of the project and ways of improving the design of the project in
the future. The sections below summarise the main themes emerging from the
evaluation interviews.
(a) Benefits of the project
The benefits of the project highlighted in the evaluation were in line with the
findings from the project presented previously. There was a clear consensus
from the interviews that the mathematics coordinators had enjoyed being part
of the research project.
Actually when I first came along I was a bit daunted by being
involved with something at the university … I thought it would be all, I
31Developing the use of visual representations in the primary school
know this sounds terrible, but “highbrow” and this kind of thing, but
the people that have been working with us have been really nice.
I sort of had the letter put on my desk and told “you're doing this”. So
it wasn’t a choice thing, so it was a bit daunting at first. And then
when we came to the first day, I’d sort of had a different remit from
the head as to what it was about; and so when I came I thought “ooh
I don't think I really understand this”, but after that day and then
putting it into practice it’s been really enjoyable. And then coming to
days like this where you get a chance to share ideas and discuss
things is really valuable to your future teaching. I think it’s been really
good.
One of the main benefits identified with the project was the opportunity to
reflect on the teaching of mathematics.
Personally speaking I’ve enjoyed taking part in something where for
the first time in quite a long time. I've had to focus on some aspect of
the curriculum, and completely rethink the way it’s taught. As I said
before there isn’t a lot of time for reflection in the profession at all, I
don't think. And just the opportunity to be out of school at all, as
school is inevitable busy, just to come here, it’s nice to have time.
I think it’s definitely made me be more reflective on my practice.
In addition, another positive aspect of the project has been the opportunity for
teachers to discuss and share ideas with other colleagues.
Sort of sharing with other schools as well all the different sorts of
visual representations that you can use that we maybe might not
have thought about in the past, so that has been really worthwhile
and does have a big impact on the whole school.
I think it’s been really valuable to reflect on your practice and we all
bring very different things, we’re from different schools and we’re a
32Developing the use of visual representations in the primary school
very different group, but it’s been really interesting listening to
everyone else, beginning to share ideas from their schools and you
put them into practice.
As a result of the project, the teachers identified that there had been an
impact on their knowledge of teaching mathematics and actual changes to
their teaching.
It’s highlighted quite a lot of issues or things we need to improve on
in maths even though we’ve only focused on two areas of it.
We’ve thought a lot about the different areas. I mean my school was
in on the fractions and with fractions being a notoriously poorly
taught area, it’s made us think how we do it, how we progress the
children and it has had a big impact on their learning so it’s been
really worthwhile.
There was a particular member of staff … who quite surprisingly had
never used arrays to teach multiplication. She's taught that year
group for a very long time, she just didn’t like (arrays), but because of
this she had to and she found she loved them and it really worked
surprisingly enough. That's a teacher who had been teaching for
twenty/thirty years who has then changed their practice, so it
definitely benefits the school. It’s just like I say, the opportunity to
think is so invaluable.
(b) Drawbacks to the project
Despite the positive impact of the project, there were of course some
drawbacks identified by the teachers. These were again in line with the
findings of the project. The main issue identified by the coordinators was the
issue of time.
33Developing the use of visual representations in the primary school
But then finding the time to go back and sit with someone for an
hour is very difficult in schools, so you say it in passing in the hope
that that person will think yeah I’ll do that. But there's so many other
things going on all the time.
I think it’s always good practice to share but I think that time is
always an issue too you know, unless you’ve got staff meetings set
aside or you’re linking up with other schools. Your ideas you share
with your link group partner but unless there's a whole staff meeting
set aside for it, it’s always a timing issue.
The issue of allocating time to the particular maths topics focused upon in the
project was also identified as a possible issue.
The one major issue that we found was that the time that was spent
extra on one area was then taken away from another area of maths,
so it’s then trying to find time slots to fit in so we’re not leaving
another area sort of as a weakness. So that's one of our areas that
we struggled with but not a great deal.
(c) Improvements to the project
Following on from the possible drawbacks, the coordinators suggested
improvements to the project. The main suggestion was including the class
teachers in the training days for the project.
Some greater involvement of the teachers who are actually going to
be teaching, somehow. How that would happen I'm not really sure,
some more direct input for them would be useful.
34Developing the use of visual representations in the primary school
I think it would have been beneficial if the actual teacher who was
implementing it was here as well.
In addition, putting into place further opportunities to enhance the discussion
between the coordinators was suggested.
And I think maybe one of the other issues was speaking to other
schools as well, because once you get back to school it’s just so
difficult to do that, other things take precedent, you can’t help that.
So sometimes until you come back for the next training day it’s in the
back of your mind a little bit so we would like to be able to go to
other schools to see their practice.
I know there was a lot of keep in touch with your partner, you know
see what they’re doing in their schools. And there's no time set aside
for that. I would have liked sort of a midterm sort of meeting. Out of
school again, rather than just saying ‘oh give them a ring, email
them’, what have you.
All these suggestions will be incorporated into further work that we carry out
in the future.
35Developing the use of visual representations in the primary school
7. Next steps
To conclude this report, we highlight particular implications that can be taken
from this study in order to inform the pedagogical use of visual representations
by teachers (an in turn the professional development of teachers), and perhaps
more generally the primary mathematics curriculum.
Firstly, as has been highlighted, the study has identified the benefits that visual
representations can bring to the learning of mathematics for primary children.
The quantitative findings suggested that children progressed significantly in
their learning of multiplication and fractions through the use of visual
representations by their teachers. Qualitatively as well, teachers highlighted
the fact that diagrammatic representations benefit pupils’ understanding and
also their confidence in mathematics. It is important that we emphasise these
benefits to teachers in their training and professional development. Within the
profession, OfSTED in their report and Mathematics: understanding the score
(OfSTED, 2008) emphasised the importance of developing pupils’
understanding in the subject:
36Developing the use of visual representations in the primary school
The fundamental issue for teachers is how better to develop pupils’
mathematical understanding. Too often, pupils are expected to
remember methods, rules and facts without grasping the
underpinning concepts, making connections with earlier learning and
other topics, and making sense of the mathematics so that they can
use it independently. (p.5)
In another more recent report, Good practice in primary mathematics:
evidence from 20 successful schools (OfSTED, 2011), OfSTED highlighted the
beneficial use of visual images, drawing on an example where “One school has
recently adopted the Singapore curriculum, which emphasises the consistent
use of visual representation to aid conceptual understanding” (p.29).
Therefore, the awareness of the beneficial nature of using visual
representations is there, but this report provides additional detail on why and
how those benefits may arise. The next step for the authors of this study, in
their roles of working with trainee teachers and on professional development
programmes, is to emphasise on these courses the potential of visual
representations in primary mathematics.
The study stresses however that it is not just a straightforward matter of using
more visual representations in our teaching of mathematics. The study
identified the progression in teachers’ use of representations from little or no
use of representations, to using a variety of representations, and then
importantly on to the next step of considering the progression for pupils in
using different representations for mathematical concepts. This is an additional
aspect that needs to be stressed in the training and professional development
of teachers, and once again, we have incorporated these ideas in the work that
we do with trainee and more experienced teachers. Also in our research work,
37Developing the use of visual representations in the primary school
we have identified possible examples of progression in the use of visual
representations. For example, from Barmby et al. (2009), we have this
suggestion for progressing through different visual representations for
multiplication:
Figure 5: A suggested progression in using visual representations for
multiplication.
The progression begins with a ‘groups of’ representation for multiplication but
then moves to the array because of its usefulness in showing different
properties of multiplication. However, by linking back to the ‘groups of’
representation, we can try and avoid any difficulty for pupils in identifying the
array as representation for multiplication. In turn, modifying the array can help
explain the grid representation for multiplication calculations, which in turn
38Developing the use of visual representations in the primary school
can be linked to formal column multiplication approaches. The important issue
here is considering how we progress pupils to representations that we want
them to use whilst at the same time supporting their understanding of the
representations. In terms of next steps, this is another area which the authors
will be examining, considering possible progression pathways for
representations of different mathematical concepts (e.g. addition involving
number lines, place value etc.) and we hope to develop materials for teachers
based on these considerations.
A final ‘next step’ that we would highlight from this study is with respect to the
proposed new curriculum for primary mathematics that will be introduced in
2014. The programme of study for Key Stages 1 to 2 (Department for
Education, 2013) stress as one of its aims that pupils “become fluent in the
fundamentals of mathematics” (p.3). In relation to this, the idea of developing
conceptual understanding is highlighted by the programmes of study, although
the aim of developing this understanding is stated as “pupils are able to recall
and apply their knowledge rapidly and accurately to problems” (p.3). The
concern is that this emphasis on fluency and speed could in fact detract from
teachers aiming for conceptual understanding. Looking further at the
programme of study, although some visual representations are highlighted
(e.g. number line, array), their use in developing understanding is not
emphasised and no sense of progression involving these representations is
made clear. Therefore, the findings of this study have implications for how
teachers enact the new programme of study. Once again, through awareness
of why and how to use visual representations in the teaching and learning of
39Developing the use of visual representations in the primary school
primary mathematics, it is hoped that any possible drawback to the new
primary mathematics curriculum can be avoided.
40Developing the use of visual representations in the primary school
References
Ainsworth, S. (1999). The functions of multiple representations. Computers &
Education, 33, 131-152.
Barmby, P., Harries, T., Higgins, S., & Suggate, J. (2009). The array
representation and primary children’s understanding and reasoning in
multiplication. Educational Studies in Mathematics, 70, 217–241.
Behr, M. J., Lesh, R., Post, T. P., & Silver, E. A. (1983). Rational-number
concepts. In R. Lesh, & M. Landau (Eds.), Acquisition of mathematics
concepts and processes (pp. 91-126). New York: Academic Press.
Borko, H. (2004). Professional development and teacher learning: Mapping the
terrain. Educational Researcher, 33(8), 3-15.
Boulton-Lewis, G. M. (1998). Children’s strategy use and interpretations of
mathematical representations. Journal of Mathematical Behavior, 17(2),
219-237.
Brophy, J. (1991). Conclusion. In J. Brophy (Ed.), Advances in research on
teaching (Vol. 2, pp. 349-364). Greenwich, CT: JAI Press.
Cobb, P., Yackel, E., & Wood, T. (1992). A constructivist alternative to the
representational view of mind in mathematics education. Journal for
Research in Mathematics Education, 23(1), 2-33.
41Developing the use of visual representations in the primary school
Desimone, L. M., Porter, A. C., Garet, M. S., Yoon, K. S., & Birman, B. F. (2002).
Effects of Professional Development on Teachers' Instruction: Results
from a Three-Year Longitudinal Study. Educational Evaluation and Policy
Analysis, 24(2), 81-112.
Diaper, G. (1990). The Hawthorne effect: A fresh examination. Educational
Studies, 16(3), 261-267.
Duval, R. (1999). Representation, vision and visualization: Cognitive functions
in mathematical thinking. In F. Hitt, & M. Santos (Eds.), Proceedings of
the Twenty-first Annual Meeting of the North American Chapter of the
International Group for the Psychology of Mathematics Education (pp. 3-
26). Columbus, Ohio: ERIC Clearinghouse for Science, Mathematics, and
Environmental Education.
Flevares, L. M., & Perry, M. (2001). How many do you see? The use of
nonspoken representations in first-grade mathematics lessons. Journal
of Educational Psychology, 93(2), 330-345.
Franke, M. L., Carpenter, T. P., Levi, L., & Fennema, E. (2001). Capturing
Teachers' Generative Change: A Follow-up Study of Professional
Development in Mathematics. American Educational Research Journal,
38(3), 653-689.
Garet, M. S., Porter, A. C., Desimone, L., Birman, B. F., & Yoon, K. S. (2001).
What Makes Professional Development Effective? Results from a
National Sample of Teachers. American Educational Research Journal,
38(4), 915-945.
Gersten, R., Chard, D. J., Jayanthi, M., Baker, S. K., Morphy, P. & Flojo, J. (2009).
Mathematics instruction for students with learning disabilities: A meta-
42Developing the use of visual representations in the primary school
analysis of instructional components. Review of Educational Research,
79(3), 1202–1242.
Greeno, J. G., & Hall, R. P. (1997). Practicing representation: Learning with and
about representational forms. The Phi Delta Kappan, 78(5), 361-367.
Greer, B. (1992). Multiplication and division as models of situations. In D. A.
Grouws (Ed.), Handbook of research on mathematics teaching and
learning (pp. 276-295). New York: Macmillan.
Hall, N. (1998). Concrete representations and procedural analogy theory.
Journal of Mathematical Behavior, 17(1), 33-51.
Hiebert, J., & Carpenter, T. P. (1992). Learning and teaching with
understanding. In D. A. Grouws (Ed.), Handbook of research on
mathematics teaching and learning (pp. 65–97). New York: Macmillan.
Hill, H. C., & Ball, D. L. (2004). Learning mathematics for teaching: Results from
California's mathematics professional development institutes. Journal
for Research in Mathematics Education, 35(5), 330-351.
Kaput, J. J. (1991). Notations and representations as mediators of constructive
processes. In E. von Glasersfeld (Ed.), Radical constructivism in
mathematics education (pp. 53-74). Dordrecht: Kluwer.
Korthagen, F. A. J., & Kessels, J. P. A. M. (1999). Linking Theory and Practice:
Changing the Pedagogy of Teacher Education. Educational Researcher,
28(4), 4-17.
Lampert, M. (1986). Knowing, doing, and teaching multiplication. Cognition
and Instruction, 3, 305-342.
Leinhardt, G., Putnam, R. T., Stein, M. K., & Baxter, J. (1991). Where subject
knowledge matters. In J. Brophy (Ed.), Advances in research on teaching:
43Developing the use of visual representations in the primary school
Vol. 2. Teachers’ knowledge of subject matter as it relates to their
teaching practice (pp. 87-113). Greenwich, CT: JAI Press.
OfSTED (2009). Mathematics: understanding the score. London: OfSTED.
OfSTED (2011). Good practice in primary mathematics: evidence from 20
successful schools. London: OfSTED.
Outhred, L., & Mitchelmore. M. (2004). Student’s structuring of rectangular
arrays. In M. J. Høines, & A. Fuglestad (Eds.), Proceedings 28th Annual
Conference of the International Group for the Psychology of
Mathematics Education (Vol. 3, 465-472). Bergen, Norway: PME.
Post, T. R., & Cramer, K. A. (1989). Knowledge, representation, and
quantitative thinking. In M. C. Reynolds (Ed.), Knowledge base for the
beginning teacher (pp. 221-232). New York: Pergamon.
Sowell, E. J. (1989). Effects of manipulative materials in mathematics
education. Journal for Research in Mathematics Education, 20(5), 498-
505.
Wilson, S. M., & Berne, J. (1999). Learning and the Acquisition of Professional
Knowledge: An Examination of Research on Contemporary Professional
Development. Review of Research in Education, 24, 173-209.
44Developing the use of visual representations in the primary school
Appendix A: Multiplication test used
45MATHS TEST
NAME: …………………...
CLASS: ………………….
1For the first part of the test, the teacher will read out the question, and you will need to tick
the correct box to show which calculation is being shown in the question.
Question 1
George has 15 sweets but he gives 4 sweets to his sister. How do you work out how many
sweets George has left? (Tick one box)
15 + 4 15 ÷ 4
15 - 4 15 × 4
Question 2
Six children are holding two books each. How do you work out how many books they have
altogether? (Tick one box)
6+2 6-2
6×2 6÷2
Question 3
Eight sweets are shared between four children? How do you work out how many sweets
each child gets? (Tick one box)
8+4 8-4
8×4 8÷4
Question 4
It takes Chris 4 minutes to wash a window. He wants to know how many minutes it will take
him to wash 8 windows at this rate. Which of these should he do? (Tick one box)
4×8 8÷4
8-4 8+4
1For the second part of the test, the teacher will read out all the questions. Sometimes you
will need to tick the correct box, and sometimes you will need to work out and write down
your answer.
Question 5
What is 5 times 2?
7 3
10 52
Question 6
Work out what 8 times 5 is. (Write down your answer)
Question 7
A class full of children lined up in four rows. There were seven children in each row. How
many children were there in the class? (Tick one box)
28 18 12 11
Question 8
What is 3 times 23? (Tick one box)
323 233 69 26
Question 9
Maurice the monkey eats one bunch of bananas every day. If there are six bananas in a
bunch, how many bananas does Maurice eat in a week? (Tick one box)
7 30 36 42
2Question 10
25 × 18 is more that 24 × 18. How much more? (Tick one box)
1 18 24 25
Question 11
A boat moves at 2 metres every second. How far does it move in 7 seconds?
9 14 5 7
Question 12
If you know that 18 × 4 = 72, how would you work out 18 × 3? (Tick one box)
18 + 3 72 + 18
72 - 18 72 - 3
Question 13
Emily swims four times further than James. If James swims four lengths of the pool, how
many lengths does Emily swim? (Tick one box)
16 8 2 12
Question 14
When Sarah’s guinea pig was born, it was only six centimetres long. It grew up to be three
times this size. How big did it grow to?
9 12 36 18
3You can also read


