Developing the Valentine Gold Project in Newfoundland & Labrador
←
→
Page content transcription
If your browser does not render page correctly, please read the page content below
CORPORATE UPDATE JULY 2021

Developing the Valentine Gold Project
in Newfoundland & Labrador
Matt Manson President & CEO
Hannes Portmann CFO & Business Development
Amanda Mallough Senior Associate, IR

@MarathonGoldMOZ
                                                   TSX: MOZ www.marathon-gold.com1
Cautionary Statement Regarding Forward Looking Information
Certain information contained in this presentation constitutes forward-looking information within the meaning of Canadian securities laws ("forward-looking statements"). All statements in this
presentation, other than statements of historical fact, which address events, results, outcomes or developments that Marathon expects to occur are forward-looking statements. More particularly and
without restriction, this presentation contains forward-looking statements and information about economic analyses for the Valentine Gold Project, capital and operating costs, processing and recovery
estimates and strategies, future exploration plans, objectives and expectations of Marathon, future mineral resource and mineral reserve estimates and updates and the expected impact of exploration
drilling on mineral resource estimates, future feasibility studies and environmental impact statements and the timetable for completion and content thereof and statements as to management's
expectations with respect to, among other things, the matters and activities contemplated in this presentation. A mineral resource that is classified as "inferred" or "indicated" has a great amount of
uncertainty as to its existence and economic and legal feasibility. It cannot be assumed that any or part of an "indicated mineral resource" or "inferred mineral resource" will ever be upgraded to a higher
category of mineral resource. Investors are cautioned not to assume that all or any part of mineral deposits in these categories will ever be converted into proven and probable mineral reserves.

For a more detailed list of specific forward-looking statements and information applicable to Marathon, the underlying assumptions and factors that could cause future results or events to differ materially
from current expectations expressed or implied by the forward-looking statements, refer to Marathon’s Annual Information Form for the year ended December 31, 2020 and other filings made with
Canadian securities regulatory authorities and available at www.sedar.com. Other than as specifically required by law, Marathon undertakes no obligation to update any forward-looking statement to
reflect events or circumstances after the date on which such statement is made, or to reflect the occurrence of unanticipated events, whether as a result of new information, future events or results
otherwise.

Disclosure of a scientific or technical nature in this presentation has been approved by Mr. Tim Williams, FAusIMM, Chief Operating Officer of Marathon, Mr. Paolo Toscano, P.Eng. (Ont.), Vice President,
Projects for Marathon, and Mr. James Powell, P.Eng. (NL), Vice President, Regulatory and Government Affairs for Marathon. Ms. Jessica Borysenko, P.Geo. (NL), is responsible for data quality assurance
and control for Marathon. Mr. Williams and Ms. Borysenko have verified the data disclosed, including sampling, analytical and test data underlying the information contained in this presentation. This
included a site inspection, drill database verification, and independent analytical testwork.

The Qualified Person responsible for the preparation of the November 2020 Valentine Gold Project Mineral Resource Estimate is Robert Farmer, P.Eng. of John T Boyd Company. The Qualified Person
responsible for the preparation of the Mineral Reserves and mine planning is Marc Schulte, P.Eng., of Moose Mountain Technical Services. Roy Eccles, P.Geo., of APEX Geoscience Ltd. is the Qualified
Person responsible for geological technical information including a QA/QC review of drilling and sampling data used in the Mineral Resource Estimate. Paul Staples P.Eng., of Ausenco Engineering Canada
Inc. is the Qualified Person responsible for the design of the process plant and infrastructure, and financial modelling. Peter Merry, P.Eng., of Golder Associates Ltd. is the Qualified Person responsible for
design of the TMF and its water management infrastructure. Sheldon Smith, P.Geo., of Stantec Consulting Ltd. is the Qualified Person responsible for site water balance and surface water management.
Shawn Russell. P.Eng. and Carolyn Anstey-Moore, P.Geo of GEMTEC Consulting Engineers and Scientists Limited are the Qualified Persons responsible for site wide geotechnical and hydrogeological
considerations. Each of Mr. Farmer, Mr. Eccles, Mr. Staples, Mr. Schulte, Mr. Merry, Mr. Smith, Mr. Russell and Mrs. Anstey-Moore are considered to be “independent” of Marathon and the Valentine
Gold Project for purposes of NI 43-101.

                                                                                                                                                                                                          2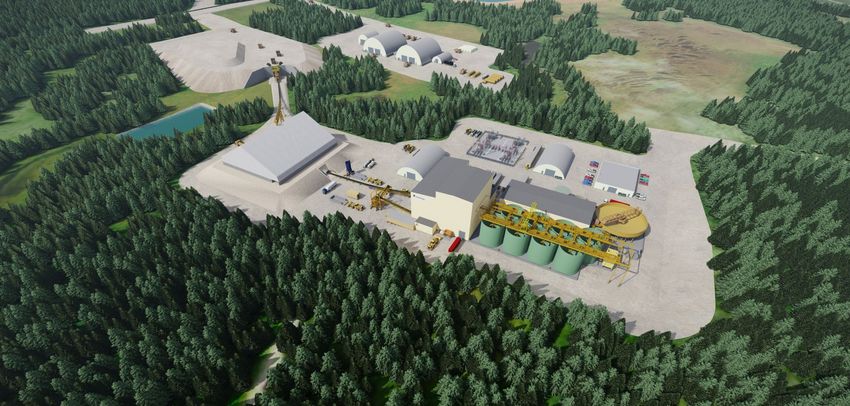
One of Canada’s
Leading Gold
Why Marathon? Development Projects
Valentine Gold Project Moving Forward on Three Fronts
100% Ownership; Central Newfoundland Feasibility Study completed
Largest Gold Resource in Atlantic Canada Detailed Engineering
Engineering
3.14 Moz. M&I (56.7 Mt at 1.72 g/t Au) Mine Procurement
1.64 Moz. Inferred (29.6 Mt at 1.72 g/t)
Building the Team
March 2021 FS: Low Initial Capital-High ROR
Ongoing EA Process
13 Year Mine Life; 2.05 Moz. Mineral
Reserve; 173 koz/a run rate 2024-2033 Permitting EIS Review
C$305M Initial Capex & AISC US$833/oz
Stakeholder Engagement
After-tax 31.5% IRR & C$600M NPV5% at
US$1,500 Gold
Doubled Exploration Program
Well Financed Exploration
C$107M in cash and cash equivalentsnote 7 First Berry Mineral Resource
Notes:
1. Mineral Resources are inclusive of the Mineral Reserves
2. Inferred Mineral Resources that are within the open pits are treated as waste and excluded from the FS economic analysis.
3. Mineral Resources that are not Mineral Reserves do not have economic viability
4. See “Notes to the Mineral Resources”, slide 21 and “Notes to the Mineral Reserves”, slide 23
3
5. See “Notes on non-IFRS Measures”, slide 48
6. Treasury estimate unaudited, and following the close of the May 2021 C$50 million private placement financing.
7. Cash balance at July, 2021. In-the-money warrants due September 2021 could provide an additional C$12 million of liquidity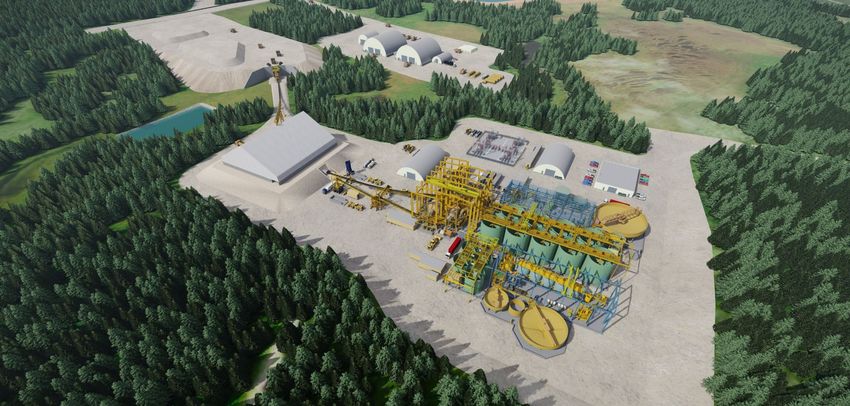
One of Canada’s
                                                                                                                                                              Leading Gold
                                                                                                                                       Leadership: Management Development Projects

                            Over 25 years in mining
                                                                                              Mining executive with financial                                        Professional engineer with over 25
                            exploration, project
                                                                                              management and capital                                                 years of experience in mine
                            development, construction and
                                                                                              markets experience. Previously                                         construction and operation. From
                            operation. Previously President
                                                                                              employed by New Gold in a                                              2011 and 2016 he was VP
                            & CEO of Stornoway Diamond
                                                                                              series of senior roles including                                       Operations for Rio Alto Mining Inc.
                            Corp. 2015 Viola Macmillan
                                                                                              EVP, Business Development
                            Award. 2017 Northern Miner
                                                                                              and, President & CEO
                            Mining Person of the Year
      Matt Manson                                                                                                                          Tim Williams
                                                                   Hannes Portmann
President, CEO & Director                                                                                                             Chief Operating Officer
                                                              CFO & Business Development

                            Professional engineer with                                        Mining professional with                                               A lawyer with over 30 years
                            over 25 years of experience in                                    over 20 years of technical                                             experience in the area of
                            project management, process                                       and project management                                                 stakeholder and Indigenous
                            engineering, and mine design                                      experience in mining, civil,                                           relations both in public and
                            and operations. Previously at                                     geotechnical, and                                                      private sectors. Previously
                            Alamos as Director of Projects                                    environmental                                                          worked as a sustainability advisor
                                                                                              engineering/sciences                                                   to Equinor Canada
     Paolo Toscano
                                                                     James Powell                                                         Mary Hatherly
      VP, Projects
                                                              VP, Regulatory & Gov. Affairs                                      Manager, Stakeholder Engagement
                            Over 20 years experience as
                                                                                              Accomplished mining                                                    Over 5 years experience in
                            an environmental and
                                                                                              geologist with over 10                                                 Investor Relations and
                            regulatory specialist with the
                                                                                              years experience in the                                                corporate communications.
                            federal government and
                                                                                              gold exploration industry in                                           Previously employed at
                            private sector. Previously
                                                                                              Newfoundland                                                           New Gold Inc.
                            worked with the Canadian
                            Environmental Assessment
                            Agency as a Project Manager
       Tara Oak                                                         Nic Capps                                                       Amanda Mallough
      Manager, EA                                                  Exploration Manager                                            Sr Associate, Investor Relations

                                                                                                                                                                                                           4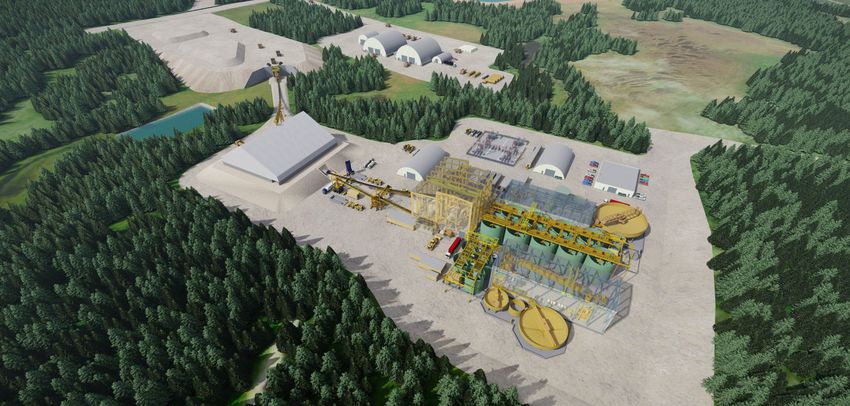
One of Canada’s
                                                                                                   Leading Gold
                                                                          Location and Logistics   Development Projects

                                                  Exploits
                                                Exploits   River
                                                         River   Bridge
                                                               Bridge                        Star Lake
                                                                                             Generating Station

• Central Region of Newfoundland and Labrador
• Road Accessible and ~80km SW of mining
  communities of Millertown and Buchans
• NL Hydro Star Lake substation within 30km
                                                 Valentine Lake Camp

                                                                                                                    5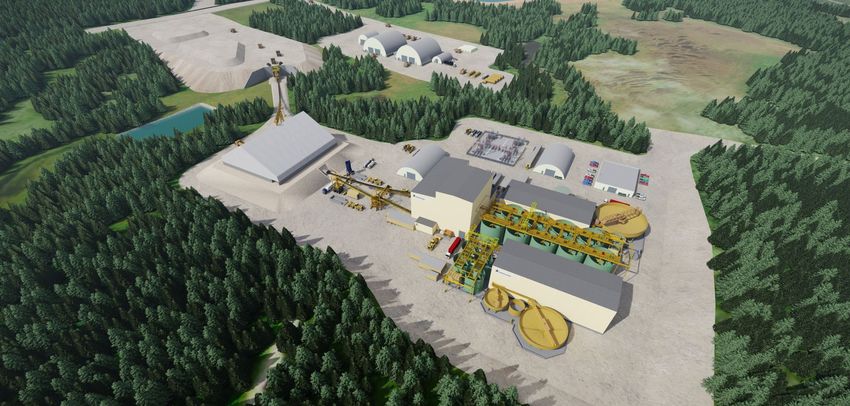
One of Canada’s
Leading Gold
Project Geology Development Projects
Victory
M&I 0.05 Moz (1.1 Mt at 1.46 g/t)
Inf. 0.1 Moz (2.3 Mt at 1.26 g/t)
Marathon
M&I 2.0 Moz (37.8 Mt at 1.62 g/t)
Inf. 0.7 Moz (11.7 Mt at 1.86 g/t)
QTP-VG extension veining with tourmaline QTP-Au veining exposed at Leprechaun Pond,
bleeding along shear fractures. Marathon Deposit 2011
discovery outcrop
Leprechaun
Shear Zone hosted gold deposit on 20km trend M&I 1.1 Moz (17.1 Mt at 1.98 g/t)
Inf. 0.2 Moz (3.0 Mt at 1.63 g/t)
System of extensional Quartz-Tourmaline-Pyrite-Gold (“QTP-Au”)
Berry
veins adjacent to the Valentine Lake Shear Zone
Inf. 0.64 Moz (11.3 Mt at 1.75 g/t)
Mineralization in hanging wall Quartz Eye Porphyry and
Trondhjemite in contact with footwall Rogerson Lake Conglomerates
Initial QTP-Au showings discovered around Leprechaun Pond Sprite
Five deposits with Mineral Resources now identified M&I 0.04 Moz (0.7 Mt at 1.74 g/t)
Inf. 0.05 Moz (1.2 Mt at 1.26 g/t)
Berry Deposit continues to be focus of exploration
Notes
1. Mineral Resources are inclusive of the Mineral Reserves
2. Mineral Resources that are not Mineral Reserves do not have economic viability 6
3. See “Notes to the Mineral Resources”, slide 21 and “Notes to the Mineral Reserves”, slide 23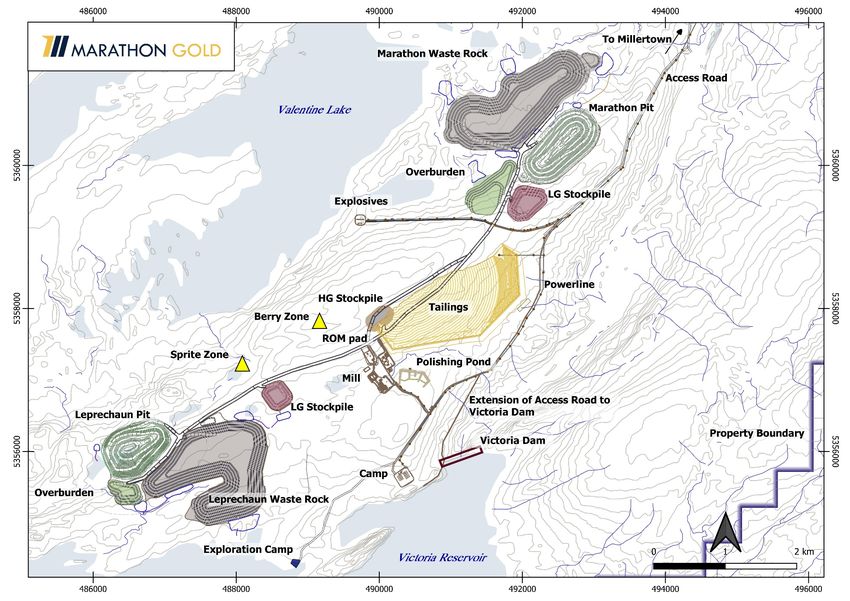
One of Canada’s
                                                                                                                                                                                    Leading Gold
                                                                                                                                                           Site Setting             Development Projects

                                                                                                                  Berry Deposit
                                                                                                                  Inf. 0.64 Moz (11.3 Mt at 1.75 g/t)
                                                                                          Valentine Lake

         Leprechaun Deposit                                                                                                                                                       Marathon Deposit
         M&I 1.1 Moz (17.1 Mt at 1.98 g/t)                                                                                                                                        M&I 2.0 Moz (37.8 Mt at 1.62 g/t)
         Inf. 0.2 Moz (3.0 Mt at 1.63 g/t)                                                                                                                                        Inf. 0.7 Moz (11.7 Mt at 1.86 g/t)

Notes
1. Mineral Resources are inclusive of the Mineral Reserves                                                 Exploration Camp
2. Mineral Resources that are not Mineral Reserves do not have economic viability                                                                            Victoria Reservoir
3. See “Notes to the Mineral Resources”, slide 21 and “Notes to the Mineral Reserves”, slide 23

    Notes
    1. Mineral Resources are inclusive of the Mineral Reserves
                                                                                                                                                                                                            7
    2. Mineral Resources that are not Mineral Reserves do not have economic viability
Valentine
    3. SeeGold Project
           “Notes to the Exploration   Camp
                         Mineral Reserves”,  slide 31 and “Notes to the Mineral Resources”, slide 33   Set 1 Quartz-Tourmaline-Pyrite-Au Veining        Victoria Reservoir Dam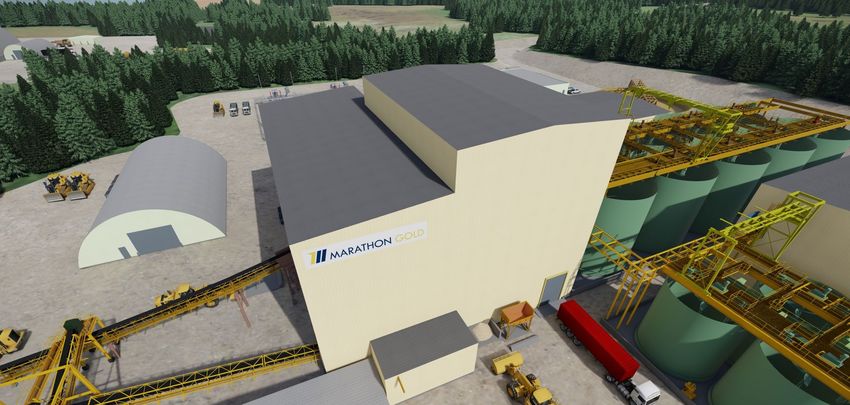
Valentine Gold Project
Feasibility Study
Headline Results of the Valentine Feasibility Study March 29, 2021
Mineral Reserves and Resourcesnotes1-3 Capital and Operating Costsnote5
2.05 Moz. P&P Reserves (47.1 Mt at 1.36 g/t Au) C$305M Initial Capex, C$44M Expansion Capital,
C$662M LOM Total Capitalnote6
3.14 Moz. M&I Resources (56.7 Mt at 1.72 g/t Au)
LOM Total Cash Cost US$704/oz
1.64 Moz. Inf. Resources (29.6 Mt at 1.72 g/t Au)
LOM Project AISC US$833/oznote7
Mining and Processing Valuation and Cash Flownote5
Two open pits. Conventional drill & blast/truck & Leprechaun Pit Inputs of US$1,500/oz Gold Price at US$:C$ 0.75
shovel mining. Conventional mill. Thickened tails. M&I Resources
Post-Tax NPV5% C$600M, 31.5% IRR, 1.9 yr Payback
6,800 tpd (2.5 Mtpa) Gravity-Leach expanded to
11,000 tpd (4.0 Mtpa) Gravity-Flotation-Leach NPV5%/Initial Capex of 2.0x
13 Year Mine Life 2023-2036 EBITDA of C$2,048M at 53% margin
Run-rate 2024-2033: 173 koz/year (high grade) note4 Post-Tax unlevered free cash flow of C$973M
Run-rate 2034-2036: 56 koz/year (stockpile) Direct Provincial and Federal taxes of C$413M
Notes:
1. Mineral Resources are inclusive of the Mineral Reserves 4. Measured in full years, excluding 2023 stub-year covering mill commissioning and
2. Inferred Mineral Resources that are within the open pits are treated as waste and excluded from the FS economic analysis. ramp-up.
3. Mineral resources which are not mineral reserves do not have demonstrated economic viability. The estimate of mineral 5. See “Notes on non-IFRS Measures”, slide 48 8
resources may be materially affected by environmental, permitting, legal, title, socio-political, marketing, or other relevant 6. LOM Total Capital is Inclusive of Initial, Expansion Capital, closure costs and salvage
issues including risks set forth in in Marathon’s Annual Information Form for the year ended December 31, 2020 and other 7. AISC definition includes Sustaining Capital estimated without salvage
filings made with Canadian securities regulatory authorities and available at www.sedar.com.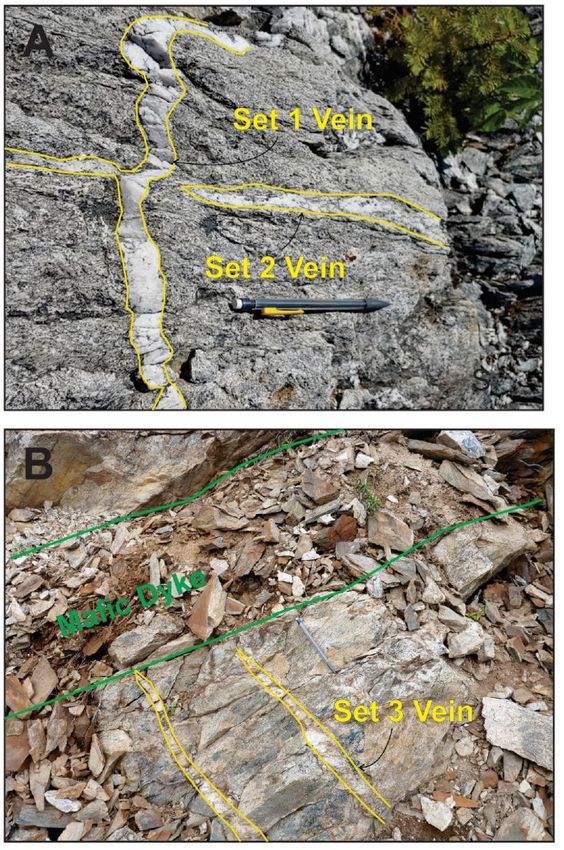
Valentine Gold Project
                                                                                                                                                                                                      Feasibility Study
                                                                                                                      What’s Changed from the April 2020 PFS?                                         March 29, 2021

   Mineral Resources and Mineral Reservesnotes1-3                                                                                                                       Capex and Opexnote4
         No New Drilling. Berry Excluded.                                                                                                                  Re-estimated Costs, 88% from Quoted Scopes
           US$1,500 (from US$1,300) for                                                                                                                            70% of costs from NL Suppliers
                Resources/Reserves                                                                                                                         Effective Date of February 2021 Direct Costs,
               Pit Shapes Optimised                                                                                                                                  Indirects and Labour Rates

           +10% P&P Ounces (1.87 to 2.05 Moz)                                                                                                               +12% Initial Capex (C$272M to C$305M)
           +1% M&I Ounces (3.09 to 3.14 Moz)                                                                                                              +18% LOM Total Capital (C$560M to C$662M)
         +71% Inferred Ounces (0.96 to 1.64 Moz)                                                                                                         +13% LOM Project AISC (US$739 to US$833/oz)
                                                                                      Marathon Pit
                                                                                                                                                         Longer Construction Schedule (18 to 22 months)
                  Mining and Processing                                               M&I Resources
                       Same Mine Plan                                                                                                                                    Valuationnote4
                 Same Mill and Flow Sheet                                                                                                                Same C$0.75 F/X Rate. Same 5% Discount Rate.
             Same Tailings Location and Strategy                                                                                                             Gold Price US$1,500 (from US$1,350)

        Increased Mine Life (12 Years to 13 Years)                                                                                                            Reduced After-Tax IRR (36.2% to 31.5%)
       Increased LOM Recoveries (93.0% to 94.2%)                                                                                                            +27% After-Tax NPV5% (C$472M to C$600M)
       +11% Recovered Ounces (1.74 to 1.93 Moz)                                                                                                              +37% After-Tax FCF (C$710M to C$973M)

Notes:
1. Mineral Resources are inclusive of the Mineral Reserves
2. Inferred Mineral Resources that are within the open pits are treated as waste and excluded from the FS economic analysis.
3. Mineral resources which are not mineral reserves do not have demonstrated economic viability. The estimate of mineral resources may be materially affected by environmental, permitting, legal, title, socio-political,   9
    marketing, or other relevant issues including risks set forth in in Marathon’s Annual Information Form for the year ended December 31, 2020 and other filings made with Canadian securities regulatory authorities and
    available at www.sedar.com.
4. See “Notes on non-IFRS Measures”, slide 48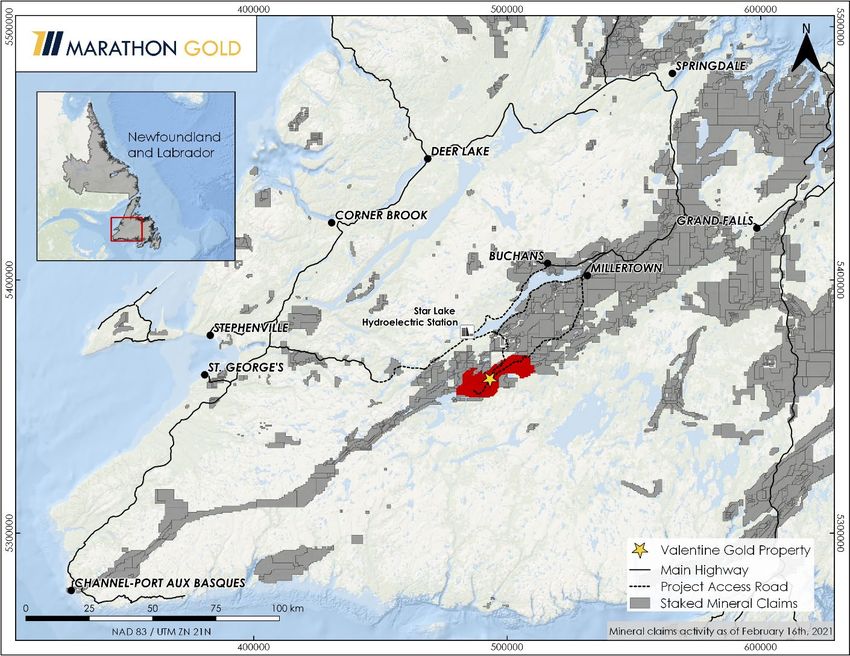
Valentine Gold Project
Feasibility Study
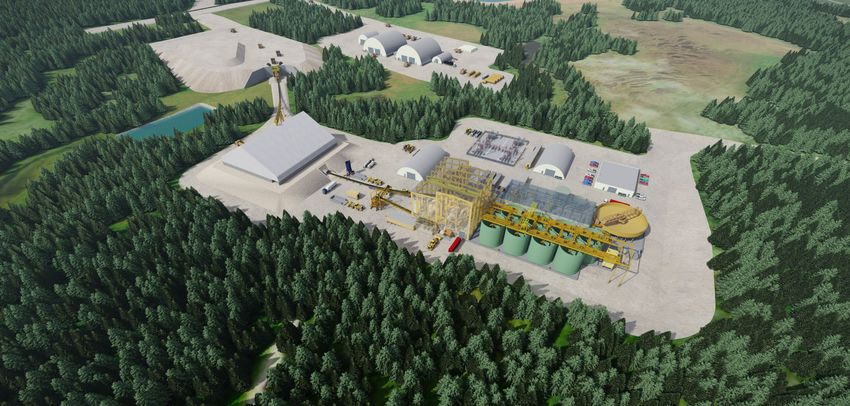
Mill and Mine Facilities March 29, 2021
Maintenance and Wash Bays
Fuel Station
Primary Crusher
Electrical Sub-Station
Covered Crushed
Ore Stockpile Mine Admin
Grinding and Gravity
1 Mill Layout (4Mtpa)
Phase 2 (2.5Mtpa)
CIL Circuit
• Mill pre-engineered site erected buildings
• Minimized footprint
• Fabric utility buildings and modular admin buildings
• Covered conveyors and winterized design Phase 2 Flotation Circuit
• 300 person modular camp (not shown) 10One of Canada’s
Leading Gold
Environmental Assessment and Permitting Development Projects
The Valentine Gold Project is subject to 2019 2020 2021 2022
MOZ Files Project Description with
regulation under the environmental protection IAA and NLDMAE April 2019
regimes of the Canadian Environmental NL EA Committee
Assessment Act and the Newfoundland and Established July 2019
Labrador (“NL”) Environmental Protection Act EIS Guidelines issued by IAA
July 2019
Marathon filed a project description with both EIS Guidelines issued by NL
the Impact Assessment Agency (“IAA”) and the EA Committee Jan 2020
NL Department of Municipal Affairs and EIS Submitted by MOZ
Environment (“NLDMAE”) on April 5, 2019. An September 2020
NL EA Committee was struck on July 2019. EIS Accepted as Conformable
by IAA Oct 2020
Filed the Environmental Impact Statement MOZ receives first IAA and NL EIS
(“EIS”) on September 30, 2020 Information Requests Feb 2021
Targeting Release from EA
Entered into Cooperation Agreements with the late Q3/Early Q4 2021
six surrounding communities 2019 2020 2021 2022
EIS
Signed Social Economic Agreement with Qalipu
First Nation on May 4, 2021 PFS
FS
Signed Memorandum of Understanding with Environmental Assessment
Miawpukek on May 12, 2021
Sectoral Permitting
Construction
11One of Canada’s
Leading Gold
Committed to ESG Through Development and Operation Development Projects
Social Capital Environment
Supporting local communities through priority Multiple site plans and engineering options
hiring and procurement, sponsorships, and evaluated with objective of minimizing
investments in health and infrastructure environmental impact
Socio-Economic Agreement with the Qalipu Mitigation strategy under development for
Mi’kmaq First Nation and MOU with the minimizing impacts on NL caribou migrations
Miawpukek First Nation
Thickened tailings deposition strategy,
Six Community Cooperation Agreements maximizing water recycling and maximizing
tailings stability
NL Benefits Agreement under development
Governance Human Capital
Strengthened control environment under board Prioritizing safe working and community health
mandates
Team, community and stakeholder communication
7 of 8 Board Directors independent
Commitment to NL hiring and purchasing
Board Technical Committee with broad oversight
Respect, Accountability, Strengthening board and management gender diversity –
Share Ownership Policy for board and
management – Up to 3x base salary for senior
Transparency, Inclusion and over 40% of team members female
executives Prosperity Development of NL Gender, Diversity and Inclusivity
Agreement
12One of Canada’s
Exploration Ongoing for Leading Gold
Discovery and Growth Development Projects
Initial 2021 Exploration Program: Drilling for Ounces
C$10.5M Program
2021 Drilling Priorities
30,000m at Berry Zone;
Victory Deposit Up to 8,000m at both the Sprite and Victory Deposits
Up to 6,000m for grassroots projects and new discovery
April 2021: Maiden Berry Resource Estimate
Inferred Mineral Resources: 0.64 Moz (11.33Mt at 1.75 g/t Au)
Based on 42,000m of drilling completed to end Nov. 2020
May 2021: Doubling Down on Exploration
Sprite Deposit Berry Deposit
Additional 50,000m at Berry Zone
Targeting 120,000m along full 1.5 km Berry length by
summer 2022
Additional drilling based on 2021 results
Notes:
1. Mineral Resources are inclusive of the Mineral Reserves
2. Mineral Resources that are not Mineral Reserves do not have economic viability
3. See “Notes to the Mineral Resources”, slide 21 and “Notes to the Mineral Reserves”, slide 23 13One of Canada’s
Leading Gold
Berry Deposit Development Projects
April 2021: Maiden Berry Resource Estimate
Inferred Mineral Resources: 0.64 Moz (11.33 Mt at 1.75 g/t
Au), of which:
Open Pit: 0.57 Moz (10.71 Mt at 1.65 g/t Au)
“High grade” Open Pit: (>0.7 g/t Au cut-off): 0.49 Moz
(5.82 Mt at 2.64 g/t Au) 200m
Recent Published Drill Intercepts from Berry Assays >0.3 g/t Au in 42,000m Drilling to Nov 2020, as utilized in Berry MRE
2.71 g/t Au over 122m and 1.69 g/t Au over 156m and 1.70
g/t Au over 87m (VL-21-984, VL-21-987 and VL-21-981, release dated April 26, 2021)
1.96 g/t Au over 101m and 5.19 g/t Au over 21m and 5.07
g/t Au over 19m (VL-21-991, VL-21-1000 and VL-21-995 release dated May 18, 2021)
6.57 g/t Au over 22m (VL-20-956, release dated March 11, 2021)
1.84 g/t Au over 45m (VL-20-973, release dated April 6, 2021)
200m
5.59 g/t Au over 21m (VL-20-956, release dated July 22, 2021)
All intercepts above were received following the cut-off for the
April 15, 2021 Berry Resource Assays >0.3 g/t Au in c.58,000m Drilling to May 2021
Notes
1. The reader is reminded that mineral resources which are not mineral reserves do not have demonstrated economic viability. The estimate of mineral resources may be materially affected by environmental,
permitting, legal, title, socio-political, marketing, or other relevant issues including risks set forth in in Marathon’s Annual Information Form for the year ended December 31, 2020 and other filings made with
Canadian securities regulatory authorities and available at www.sedar.com. 14
2. All quoted intersections comprise uncut gold assays in core lengths. Please refer to the cited news releases for details on quality control and assurance procedures, estimated true thicknesses and the application of
cut-offs.One of Canada’s
Leading Gold
Project Development Strategy Development Projects
1. Expanding Exploration and Resource Drilling. Targeting 120,000m May 6 2021: Project Development Guidance
at Berry by mid-2022
“By the time we commence major site works in 2022, we intend to
better understand the full scale of the property’s mineral resource
2. Testing the Mineral Resource. RC drill program of c.8,000 metres for potential, to have validated the quality of our mineral resource
resource reconciliation and grade distribution over Leprechaun and estimate, and to have significantly de-risked the Project for
Marathon Deposits. Results by Q3 2021. successful construction.” news release dated May 6, 2021
3. EA Proceeding with No Change to Project Scope. Marathon will RC Grade Control Holes,
Marathon Deposit
seek to complete the current EA process expeditiously, with no
changes to the project scope or the mine plan described in the FS
Mineral Reserve
and the Project’s Environmental Impact Statement. Block Model
4. De-risking and Re-ordering Mine Construction. Marathon will
assess an execution strategy of commencing construction in early
2022 on the Project’s essential infrastructure elements (NL Hydro
powerline, site communications, camp, upgrades to roads and Phase 1 Pit,
bridges etc). Site-based construction would commence later in
2022. Final (Phase 3) Pit
15One of Canada’s
Leading Gold
Marathon Milestones Development Projects
Vigorous 2021 Exploration Program
Valentine FS Study – April 2021
Maiden Berry Mineral Resource Estimate – April 2021
2021
Resource RC Reconciliation Program – Q3 2021
Release from EA and Mine Permitting
Project Financing
Commencement of Mine Construction, Infrastructure – Jan 2022
Ongoing Exploration Program
2022
Updated Mineral Resource Estimate – Mid 2022
Commencement of Mine Construction, Site Works – Q3 2022
2023 First Gold Pournote 1
Notes
1. The April 2021 FS contemplates first gold pour in October 2023. A development budget and schedule for a de-risked and re-ordered mine development execution strategy (see Marathon news release dated
May 6, 2021), including a revised date of first gold production, will be prepared by the Company in the fourth quarter of this year in support of a construction decision by the Company’s Board of Directors. 16One of Canada’s
Leading Gold
Balance Sheet and Project Valuation Metrics Development Projects
Financings in Past 12 Months Project Financial Metrics Sensitivity to Gold Price (March, 2021 FSnote 3)
December 2020 May 2021 July 2021 $1,500 $1,550 $1,750
C$8.7M C$50M Credit Facility Gold Price (US$/oz)
Base Case ↗ Consensus ↗ Spot
3M flow-through common 14.3M common shares at Indicative Term Sheet for
shares at C$2.85 C$2.45 US$185M Term Loan 0% $973 $1,052 $1,351
(Pierre Lassonde C$7.5M) 4.8M flow-through common 3% $727 $792 $1,033
shares 5% $600 $657 $868
at C$3.10 After-Tax NPV (C$M)
8% $450 $497 $672
Balance Sheet and Share Capitalization 10% $370 $412 $568
15% $223 $255 $375
Share Price (July 26, 2021) C$3.09/share After-Tax IRR 31.5% 33.9% 42.2%
NPV5%/Capex 2.0x 2.2x 2.8x
52 Week High / Low C$3.61/ C$2.04
After-Tax Payback Years 1.9 1.7 1.4
Shares Outstanding (May, 2021) note 4
242.2 million EBITDA (C$M) $2,048 $2,175 $2,682
EBITDA Margin 53% 54% 60%
Options (average price $1.37) 12.1 million Total After-Tax FCFnote4 (C$M) $973 $1,052 $1,351
Average Annual FCFnote5 (C$M) $119 $126 $152
Warrants ($1.60) 8.4 million
Top Shareholders
Fully Diluted (May, 2021) note 4 262.7 million
BCI Ventures Merk Investments
Market Capitalization (basic) C$748 million Van Eck Associates Konwave AG
Treasury (Juy, 2021) note 5 C$107 million 1832 Asset Management Franklin Advisers
12 Buys. Targets between RBC Global Asset Management Earth Resource Investment AG
11 Sell Side Analysts
C$3.50 and C$5.70 JP Morgan Asset Management Pierre Lassonde
Notes
1. See “Notes on non-IFRS Measures”, slide 48 and in the Marathon AIF for the year ending December 31, 2020
2. Payback is defined as achieving cumulative positive free cashflow after all cash costs and capital costs, including sustaining and expansion.
3. Valuation Assumptions : US$1500/oz for Base Case Financial Model and Valuation, US$:C$ exchange of 0.75, 5% discount rate, discounted to Dec 31, 2021, January 1, 2022 construction start; October 17
2023 first gold pour
4. Estimated at close of May 2021 private placement financing and May 2021 in the money warrants
5. Cash balance at July 2021. In-the-money warrants due September 2021 could provide an additional C$12 million of liquidityMore Information
Resources, Reserves, Mining
18One of Canada’s
Leading Gold
“Main Zones” at the Marathon and Leprechaun Deposits Development Projects
Leprechaun QTP Main Zone
Marathon
Hanging Wall QTP
PFS Pit Shell
Hanging Wall QTP
PFS Pit Shell
Mafic Dykes
QTP Main Zone
Mafic Dykes 350m
Hanging Wall Footwall
Trondhjemite Sediments
Hanging Wall
Quartz-Eye Footwall 1km
Porphyry Sediments
19One of Canada’s
Understanding Structural Controls on Gold Leading Gold
Mineralization at Valentine Development Projects
Three sets of Quartz-Tourmaline-Pyrite-Au Veins Sheeted S1 Extensional QTP-Au Vein Array,
Marathon Deposit
S1: Extensional, SW dipping
S2: Shear Parallel
S3: Orthogonal to shear and Mafic Dykes
S1 set is dominant. S2 set minor. S3 set rare
S1 veins stacked en-echelon, forming steeply plunging “Main Zones”
Free gold. Minor telluride association
VL-20-835 7.55 g/t Au over 14m, 166-180m
within 2.96 g/t over 47m, 166-213m (uncut, core length)
Notes
Stefan Kruse, Terrane Geoscience, 2020 for Marathon Gold Corporation
20Valentine Gold Project
Feasibility Study
Mineral Resources March 29, 2021
Measured and Indicated Mineral Resources by Deposit Inferred Mineral Resources by Deposit
(Mineral Resources Inclusive of the Mineral Reserves)
Category Tonnes (Mt) Grade (g/t Au) Oz (Moz Au)
Category Tonnes (Mt) Grade (g/t Au) Oz (Moz Au)
Marathon Measured 23.99 +4% 1.69 -2% 1.31 +2% Marathon Inferred 11.68 +10% 1.86 -5% 0.70 +5%
Indicated 13.81 +6% 1.48 -3% 0.66 +3% Leprechaun Inferred 2.99 +5% 1.63 -2% 0.16 +3%
Total M&I 37.80 +4% 1.62 -2% 1.96 +2% Victory Inferred 2.33 +9% 1.26 -4% 0.09 +5%
Sprite Inferred 1.25 +5% 1.26 -2% 0.05 +3%
Leprechaun Measured 8.60 +1% 2.22 +0% 0.61 +0%
Berry Inferred 11.33 n/a 1.72 n/a 0.64 n/a
Indicated 8.48 +1% 1.72 -1% 0.47 +1%
Total M&I 17.07 +1% 1.98 0% 1.08 +1% All Deposits Total Inferred 29.59 +76% 1.72 -3% 1.64 +71%
Changes from the January 2020 Estimate shown in italics.
Victory Measured - - - Moz
Indicated 1.09 +1% 1.46 -1% 0.05 +0% 3.5
Total M&I 1.09 +1% 1.46 -1% 0.05 +0% 2010-2021 Growth in
3.0
Mineral Resources
Sprite Measured - - -
Over this same ten-year period, the quantity of 2.5
Indicated 0.70 +3% 1.74 -1% 0.04 +1%
Total M&I 0.70 +3% 1.74 -1% 0.04 +1% Inferred Mineral Resources in addition to the M&I 2.0
has grown from 0.28 Moz to 1.64 Moz of gold. 3.09 3.14 3.14
Berry Measured - - - 1.5
2.69
Indicated - - - 2.14 1.0
Total M&I - - - 1.85
1.39
1.06 0.5
All Deposits Measured 32.59 +3% 1.83 -2% 1.92 +1% 0.68 0.82
0.28 0.0
Indicated 24.07 +4% 1.57 -2% 1.22 +2%
Total M&I 56.66 +3% 1.72 -2% 3.14 +1%
Changes from the January 2020 Estimate shown in italics.
Notes to the Mineral Resources: 5. The reader is reminded that mineral resources which are not mineral reserves do not have
1. The Mineral Resource has an effective date of Nov 20, 2020 (Marathon/Leprechaun/Sprite/Victory) and Apr 15, 2021 (Berry). demonstrated economic viability. The estimate of mineral resources may be materially affected by
2. Mineral Resources are based on $1,500/oz gold with a US$:C$ exchange rate of 0.75 environmental, permitting, legal, title, socio-political, marketing, or other relevant issues including risks
3. In-pit Mineral Resources have been determined by the Whittle method based on an estimate of their reasonable prospects for set forth in in Marathon’s Annual Information Form for the year ended December 31, 2020 and other
filings made with Canadian securities regulatory authorities and available at www.sedar.com.
21
economic extraction, using certain assumptions for gold recovery, costs for mining, processing and sale.
4. The Mineral Resources were estimated using a block model with a block size of 6 m by 6 m by 6 m sub-blocked to a minimum 6. Mineral Resources are inclusive of the Mineral Reserves
block size of 2 m by 2 m by 2 m using ID3 methods for grade estimation. All Mineral Resources are reported using an open pit 7. Columns may not sum exactly due to rounding.
gold cut-off of 0.300 g/t Au and an underground gold cut-off of 1.4 g/t Au. 8. See “Note on Historical Disclosure of Mineral Resources at the Valentine Gold Project” on slide 47Valentine Gold Project
Feasibility Study
2021 Mineral Resources by Type March 29, 2021
Open Pit Underground Total
Category Tonnes (Mt) Grade (g/t Au) Oz (Moz Au) Tonnes (Mt) Grade (g/t Au) Oz (Moz Au) Tonnes (Mt) Grade (g/t Au) Oz (Moz Au)
High Grade
Measured 18.51 +3% 2.77 -1% 1.65 +2% 0.51 -13% 4.05 -8% 0.07 -20% 19.02 +2% 2.81 -1% 1.72 +1%
Indicated 13.04 +4% 2.37 0% 0.99 +3% 0.66 -7% 3.27 -12% 0.07 -18% 13.70 +3% 2.41 -1% 1.06 +2%
Total M&I 31.55 +3% 2.61 -1% 2.64 +2% 1.17 -10% 3.61 -10% 0.14 -19% 32.72 +2% 2.64 -1% 2.78 +1%
Low Grade
Measured 13.56 +4% 0.47 0% 0.20 +4% - - - 13.56 +4% 0.47 0% 0.20 +4%
Indicated 10.37 +5% 0.46 0% 0.15 +5% - - - 10.37 +5% 0.46 0% 0.15 +5%
Total M&I 23.93 +4% 0.47 0% 0.36 +4% - - - 23.93 +4% 0.47 0% 0.36 +4%
Total M&I
Measured 32.08 +3% 1.80 -1% 1.85 +2% 0.51 -13% 4.05 -8% 0.07 -20% 32.59 +3% 1.83 -2% 1.92 +1%
Indicated 23.41 +4% 1.53 -1% 1.15 +3% 0.66 -7% 3.27 -12% 0.07 -18% 24.07 +4% 1.57 -2% 1.22 +2%
Total M&I 55.49 +4% 1.68 -1% 3.00 +3% 1.17 -10% 3.61 -10% 0.14 -19% 56.66 +3% 1.72 -2% 3.14 +1%
Open Pit Underground Total
Category Tonnes (Mt) Grade (g/t Au) Oz (Moz Au) Tonnes (Mt) Grade (g/t Au) Oz (Moz Au) Tonnes (Mt) Grade (g/t Au) Oz (Moz Au)
High Grade
Inferred 14.11 +84% 2.46 +6% 1.11 +95% 3.05 +34% 3.47 -11% 0.34 +19% 17.16 +72% 2.64 -2% 1.45 +70%
Low Grade
Inferred 12.43 +82% 0.46 0% 0.18 +82% - - - 12.43 +82% 0.46 0% 0.18 +82%
Total Inferred
Inferred 26.54 +83% 1.52 +6% 1.30 +93% 3.05 +34% 3.47 -11% 0.34 +19% 29.59 +76% 1.72 -3% 1.64 +71%
Changes from the January 2020 Estimate shown in italics.
Notes to the Mineral Resources: 5. The reader is reminded that mineral resources which are not mineral reserves do not have
1. The Mineral Resource has an effective date of Nov 20, 2020 (Marathon/Leprechaun/Sprite/Victory) and Apr 15, 2021 (Berry). demonstrated economic viability. The estimate of mineral resources may be materially affected by
2. Mineral Resources are based on $1,500/oz gold with a US$:C$ exchange rate of 0.75 environmental, permitting, legal, title, socio-political, marketing, or other relevant issues including risks
3. In-pit Mineral Resources have been determined by the Whittle method based on an estimate of their reasonable prospects for set forth in in Marathon’s Annual Information Form for the year ended December 31, 2020 and other
filings made with Canadian securities regulatory authorities and available at www.sedar.com.
22
economic extraction, using certain assumptions for gold recovery, costs for mining, processing and sale.
4. The Mineral Resources were estimated using a block model with a block size of 6 m by 6 m by 6 m sub-blocked to a minimum 6. Mineral Resources are inclusive of the Mineral Reserves
block size of 2 m by 2 m by 2 m using ID3 methods for grade estimation. All Mineral Resources are reported using an open pit 7. Columns may not sum exactly due to rounding.
gold cut-off of 0.300 g/t Au and an underground gold cut-off of 1.4 g/t Au.Valentine Gold Project
Feasibility Study
Mineral Reserves March 29, 2021
Mineral Reserves by Deposit
Marathon Pit
Category Tonnes (Mt) Diluted Grade (g/t Au) Insitu Gold (Moz Au)
Marathon Proven 20.56 +15% 1.36 -3% 0.90 +11%
Deposit Probable 9.11 +20% 1.15 -5% 0.34 +14%
Total 29.67 +17% 1.30 -4% 1.24 +12%
Leprechaun Proven 9.12 +9% 1.69 -3% 0.50 +5%
Deposit Probable 8.27 +15% 1.19 -5% 0.32 +10%
Proven (red) and Total 17.39 +11% 1.45 -4% 0.81 +7%
Probable (purple)
Mineral Reserves Total Mineral Reserves
1m Assays >0.3 g/t Au Changes from the April Total 47.06 +15% 1.36 -4% 2.05 +10%
2020 Estimate shown
Leprechaun Pit in italics. Mineral Reserves by Grade Category
Category Tonnes (Mt) Diluted Grade (g/t Au) Insitu Gold (Moz Au)
High Grade Proven 17.94 +8% 2.11 -0% 1.21 +8%
(+0.70 g/t) Probable 9.47 +9% 1.74 +0% 0.53 +9%
Total 27.41 +8% 1.98 -0% 1.75 +8%
Low Grade Proven 11.74 +22% 0.48 -4% 0.18 +17%
(+0.30/-0.70 g/t) Probable 7.91 +29% 0.48 -5% 0.12 +23%
Total 19.65 +25% 0.48 -4% 0.30 +19%
Total Mineral Reserves
Total 47.06 +15% 1.36 -4% 2.05 +10%
Notes to the Mineral Reserves: 4. Mineral Reserves are mined tonnes and grade, referenced to the mill feed at the crusher. This mill feed accounts for modifying factors such as estimated mining
1. The Mineral Reserve estimate has been prepared by an independent dilution and recovery.
Qualified Person, Marc Schulte, P.Eng., of Moose Mountain Technical 5. 5. Mineral Reserves are reported at a cut-off grade of 0.30 g/t Au, based on a US$1,500/oz gold price, 0.75 US$:C$ exchange rate, 99.8% payable gold, US$5/oz
Services, with an effective date of March 29, 2021.
6.
refining and transport costs, 0% royalties, 87% process recovery at cutoff, C$12.00/t process costs, C$3.00/t G&A costs, and C$1.50/t stockpile re-handle costs.
The estimate of mineral reserves may be materially affected by environmental, permitting, legal, title, socio-political, marketing, or other relevant issues including
23
2. The Mineral Reserves are based on the Mineral Resource Estimate effective
November 20, 2020. risks set forth in in Marathon’s Annual Information Form for the year ended December 31, 2020 and other filings made with Canadian securities regulatory
3. The Mineral Reserves are based on engineering and technical information authorities and available at www.sedar.com
developed at a Feasibility level for the Marathon and Leprechaun Deposits. 7. Columns may not sum exactly due to rounding.Valentine Gold Project
Feasibility Study
Mining March 29, 2021
Marathon Pit Leprechaun Pit
(1,350m x 700m x 328m, 6x6m Block Model, 6m Ore and 12m Waste Benches) (1,000m x 725m x 306m, 6x6m Block Model, 6m Ore and 12m Waste Benches)
Ore Diluted Grade Waste Strip Ratio Insitu Gold Efficiency Ore Diluted Grade Waste Strip Ratio Insitu Gold Efficiency
Pit Pit
(Mt) (g/t Au) (Mt) (w/o) (Moz Au) (t/oz) (Mt) (g/t Au) (Mt) (w/o) (Moz Au) (t/oz)
Phase 1 9.3 +27% 1.37 -7% 30.8 +25% 3.3 -3% 0.41 +17% 98 +8% Phase 1 5.4 +7% 1.47 -5% 24.8 -7% 4.6 -13% 0.26 +2% 118 -6%
Phase 2 7.7 -9% 1.23 -4% 39.2 -11% 5.1 -4% 0.31 -13% 154 +2% Phase 2 4.5 +49% 1.36 +5% 58.8 +73% 13.1 +16% 0.20 +51% 322 +13%
Phase 3 12.7 +31% 1.28 -3% 115.4 +14% 9.1 -13% 0.53 +28% 244 -10% Phase 3 7.5 -1% 1.49 -6% 70.7 -13% 9.4 -12% 0.36 -8% 218 -4%
Total 29.7 +17% 1.30 -4% 185.5 +9% 6.3 -7% 1.24 +13% 174 -2% Total 17.4 +11% 1.45 -5% 154.3 +9% 8.9 -2% 0.81 +7% 212 +2%
NW Marathon Pit SE NW Leprechaun Pit SE
Proven (red) and
Probable (purple)
Mineral Reserves
1m Assays >0.3 g/t Au
Notes to the Mineral Reserves: 4. Mineral Reserves are mined tonnes and grade, referenced to the mill feed at the crusher. This mill feed accounts for modifying factors such as estimated mining
1. The Mineral Reserve estimate has been prepared by an independent dilution and recovery.
Qualified Person, Marc Schulte, P.Eng., of Moose Mountain Technical 5. 5. Mineral Reserves are reported at a cut-off grade of 0.30 g/t Au, based on a US$1,500/oz gold price, 0.75 US$:C$ exchange rate, 99.8% payable gold, US$5/oz
Services, with an effective date of March 29, 2021.
6.
refining and transport costs, 0% royalties, 87% process recovery at cutoff, C$12.00/t process costs, C$3.00/t G&A costs, and C$1.50/t stockpile re-handle costs.
The estimate of mineral reserves may be materially affected by environmental, permitting, legal, title, socio-political, marketing, or other relevant issues including
24
2. The Mineral Reserves are based on the Mineral Resource Estimate effective
November 20, 2020. risks set forth in in Marathon’s Annual Information Form for the year ended December 31, 2020 and other filings made with Canadian securities regulatory
3. The Mineral Reserves are based on engineering and technical information authorities and available at www.sedar.com
developed at a Feasibility level for the Marathon and Leprechaun Deposits. 7. Columns may not sum exactly due to rounding.Valentine Gold Project
Resource-Reserve Reconciliation Feasibility Study
Marathon Deposit Illustrated March 29, 2021
Metal Marathon
Tonnage Grade Waste
Content Reconciliation Steps Resource Pit Shell
(Mt) (g/t Au) (Mt)
(Moz.)
Mineral Resource Estimate using 2mx2mx2m sub-
M&I Mineral Resources in Resource
Pit Shell Pit (0.30 g/t cutoff)
36.9 1.57 1.86 block resource model, Whittle pit method, and
Reasonable Prospects for Economic Extraction test
M&I Mineral Resources in Mining Mining pit design optimized on undiscounted
Pit (0.30 g/t cutoff)
24.4 1.63 1.28 190.2 cumulative cash flow to optimize rate of return.
Applying estimated mining dilution of 21% and ore
Diluted M&I Mineral Resources in
Mining Pit (0.30 g/t cutoff)
30.6 1.27 1.25 184.5 loss of 2% to 6mx6mx6m mining block model,
addition of overburden
Transfer isolated ore blocks from ore to waste
P&P Mineral Reserves 29.7 1.30 1.24 185.5 categories. Loss of 5% of ore and 2% of metal.
Recovered Ounces 1.18 Applying 94% average process recovery Marathon
Mining Pit Shell
PFS Reserves for Comparison 25.4 1.35 1.10 170.3 Smaller Pit limits, 0.33 g/t cutoff grade
Tonnes Grade Insitu Gold
Inferred Mineral Resources within Mining Category
(Mt) (g/t Au) (Moz Au)
Pit (Undiluted, Classified as Waste) Marathon
Deposit
Inferred 3.9 1.56 0.19
Notes
1. Mineral Resources are inclusive of the Mineral Reserves
2. Mineral Resources that are not Mineral Reserves do not have economic viability
3. See “Notes to the Mineral Resources”, slide 21 and “Notes to the Mineral Reserves”, slide 23 25Valentine Gold Project
Resource-Reserve Reconciliation Feasibility Study
Leprechaun Deposit Illustrated March 29, 2021
Metal Leprechaun
Tonnage Grade Waste
Content Reconciliation Steps Resource Pit Shell
(Mt) (g/t Au) (Mt)
(Moz.)
Mineral Resource Estimate using 2mx2mx2m sub-
M&I Mineral Resources in Resource
Pit Shell Pit (0.30 g/t cutoff)
16.8 1.95 1.05 block resource model, Whittle pit method, and
Reasonable Prospects for Economic Extraction test
Mining pit design optimized on undiscounted
M&I Mineral Resources in Mining
Pit (0.30 g/t cutoff)
13.8 1.95 0.87 155.6 cumulative cash flow to optimize rate of return.
Revised slope inputs
Applying estimated mining dilution of 25% and ore
Diluted M&I Mineral Resources in
Mining Pit (0.30 g/t cutoff)
18.3 1.39 0.82 151.5 loss of 6% to 6mx6mx6m mining block model,
addition of overburden
Transfer isolated ore blocks from ore to waste
P&P Mineral Reserves 17.4 1.45 0.81 154.3 categories. Loss of 6% of ore and 2% of metal.
Leprechaun
Recovered Ounces 0.77 Applying 94% average process recovery Mining Pit Shell
PFS Reserves for Comparison 15.6 1.52 0.76 141.6 Smaller Pit limits, 0.33 g/t cutoff grade
Tonnes Grade Insitu Gold
Inferred Mineral Resources within Mining Category
(Mt) (g/t Au) (Moz Au)
Pit (Undiluted, Classified as Waste) Leprechaun
Deposit
Inferred 2.1 1.40 0.09
Notes
1. Mineral Resources are inclusive of the Mineral Reserves
2. Mineral Resources that are not Mineral Reserves do not have economic viability
3. See “Notes to the Mineral Resources”, slide 21 and “Notes to the Mineral Reserves”, slide 23 26More Information 27 Mine Plan, Processing, Facilities
Valentine Gold Project
Feasibility Study
Site Layout March 29, 2021
Two open pits: Marathon & Leprechaun
Waste piles adjacent to pits
Tailings Management Facility (“TMF”)
avoids area of known fish habitat and is
located downstream of the Victoria
Reservoir and Victoria Dam
Mill centrally located
300 person accommodation camp
What’s Changed Since the April 2020 PFS?
Primary Crusher, High Grade Stockpiles and
Mill relocated to SW to avoid fly-rock zone
from future potential Berry open pit.
TMF design adjusted for updated
geotechnical and water balance data. TMF
dam alignment optimized. Polishing pond
relocated closer to mill.
28Valentine Gold Project
Feasibility Study
Mine Plan March 29, 2021
Mining by Pit Phase Strip Ratio
70,000 70,000 20.0
18.0
60,000 60,000
16.0
50,000 50,000 14.0
Total Mined (kt)
Total Mined (kt)
12.0
40,000 40,000
Strip ratio
10.0
30,000 30,000
LOM Strip 8.0
20,000 20,000
Ratio 7.2 6.0
4.0
10,000 10,000
2.0
- - -
2022 2023 2024 2025 2026 2027 2028 2029 2030 2031 2032 2033 2034 2035 2036 2022 2023 2024 2025 2026 2027 2028 2029 2030 2031 2032 2033 2034 2035 2036
Period Period
Leprechaun Overburden Marathon Overburden Leprechaun Phase 1 Resource Mined Waste Mined Strip Ratio
Leprechaun Phase 2 Leprechaun Phase 3 Marathon Phase 1
Marathon Phase 2 Marathon Phase 3
29Valentine Gold Project
Feasibility Study
Mine Plan March 29, 2021
Mill Feed, Stockpiles, and Processing Gold Recovery and Grade
14,000 300 4.00
HG Mill Feed LG Stockpile Feed
12,000 2.5 Mt/a 4 Mt/a (+0.7g/t Au) (0.3-0.7g/t Au) 3.50
250
3.00
Ounces Gold Produced (koz)
10,000
Ore Tonnes Mined (kt)
200
2.50
8,000
g/t Au
150 2.00
6,000
1.50
100
4,000
1.00
2,000 50
0.50
-
- -
2022 2023 2024 2025 2026 2027 2028 2029 2030 2031 2032 2033 2034 2035 2036
2022 2023 2024 2025 2026 2027 2028 2029 2030 2031 2032 2033 2034 2035 2036
Period
Period
Low Grade Stockpile Balance High Grade Stockpile Balance
Recovered Gold Headfeed Grade (g/t Au)
TOTAL Resource Mined from Pit TOTAL Resource Milled
30Valentine Gold Project
Feasibility Study
Mine Plan Production Data March 29, 2021
Production Datanote 1 Values Units
Life of Mine 13 Years
Processing Years 2023-2026 (Phase 1) 6,800 (2.5) tpd (Mtpa)
Processing Years 2027-2036 (Phase 2) 11,000 (4.0) tpd (Mtpa)
Recovered Gold 1.93 Moz
Average Gold Recovery 94.2%
Total Mined Tonnes (including prestrip) 387 Mt
Total Milled Tonnes 47 Mt
Overall Strip Ratio 7.2 waste:ore
Average Annual Gold Production 173 koz
2024-2033: High Grade Mill
Average Mill Feed Grade 1.62 g/t
Feed Run Ratenote 2
Annual Average After-Tax Free Cash Flow $119 C$M
Average Annual Gold Production 56 koz
2034-2036: Low Grade
Average Mill Feed Grade 0.49 g/t
Stockpile Run Rate
Annual Average After-Tax Free Cash Flow $31 C$M
Average Annual Gold Production 146 koz
2024-2036: LOM Run
Average Mill Feed Grade 1.34 g/t
Ratenote 2
Annual Average After-Tax Free Cash Flow $98 C$M
Notes:
1. See “Notes on non-IFRS Measures”, slide 48
2. Measured in full years, excluding 2023 stub-year covering mill commissioning and ramp-up. 31Valentine Gold Project
Feasibility Study
Processing March 29, 2021
Two phase design with mill expansion Primary Crusher SAG Mill Ball Mill
2023-2026: 2.5 Mtpa, 75μm, Gravity-Leach CIL
2027-2036: 4 Mtpa, 150μm, Gravity-Flotation-
Leach CIL (and pebble re-crush)
Gravity
Phase 2 (Expansion) Additions
Circuit
What’s Changed Since the April 2020 PFS?
LOM recovery increase from 93.0% to 94.2%.
Lime decreased. Oxygen increased. Leach Absorption Circuit
Larger ROM bin. Recirculation conveyors and
transfer towers aligned to 2-phase design.
Smaller SAG mill. Larger Ball mill. 14% lower
total grinding power consumption Flotation Circuit
Tails
CIL tank circuit expanded and realigned
Thickener
32Valentine Gold Project
Feasibility Study
Tailings Management March 29, 2021
Tailings Storage Operational Dam Crest Elevation
TMF Year of
Availability Period (End of Maximum Minimum
Stage Construction
(Mt) Year) (masl) (masl)
1 2022 and 2023 373.5 373.5
3.125 2024
2 2023 390.1 376.3
3 2024 6.875 2025 393.3 380
4 2025 14.125 2027 399.6 385.5
5 2027 22.125 2029 404.4 390
6 2029 30.125 2032 408.7 393.5
Thickened tailings deposition. 30Mt capacity with mined Leprechaun pit
available thereafter for remaining 17Mt.
Stage 1 starter dam available July 2023 for mill wet commissioning and
first gold pour October 2023.
What’s Changed Since the April 2020 PFS?
Dam alignment optimized, with reduced height and fill requirements
Polishing pond relocated closer to mill for efficiency and integration
of water treatment plant
Site geotechnical surveys utilized for updated foundation stripping,
slope stability and seepage modeling. Geomembrane installed on
foundation 100m upstream of dam toe for seepage mitigation.
33More Information
Capex, Opex, Financial Analysis
34Valentine Gold Project
Feasibility Study
Capex March 29, 2021
Itemnote 1 Cost (C$M) What’s Changed Since the April 2020 PFS?
Pre-strip Mining Capex $ 32
Mining Capex $ 19
Process Plant $ 88 Initial Capital (C$M)
Infrastructure $ 54
Offsite Infrastructure $ 21
Contractor Indirects $ 16
Project Delivery $ 29
Owners Cost $ 15
Contingency $ 32
Total Initial Capital $ 305
Mill Expansion $ 40
Contingency $ 4
Mill Expansion Capital $ 44
Sustaining Capital, Mining $ 186
Sustaining Capital, Infrastructure $ 89
Closure $ 36
Salvage $ (20)
Contingency $ 21
Total Sustaining Capital $ 312
LOM Total $ 662
Notes
1. See “Notes on non-IFRS Measures”, slide 48
2. Columns may not sum exactly due to rounding 35Valentine Gold Project
Feasibility Study
Opex and AISC March 29, 2021
Itemnote 1 Value Units What’s Changed Since the April 2020 PFS?
Tonnes Mined, Years 1-14 376 Mt
Tonnes Milled, Years 1-14 47 Mt
Payable Ounces 1.93 Moz AISC (US$/oz)
$ 962 C$M
Mining Costs $ 2.55 C$/tonne mined
$ 20.44 C$/tonne milled
$ 589 C$M
Processing & Water Treatment
$ 12.51 C$/tonne milled
$ 215 C$M
G&A
$ 4.58 C$/tonne milled
$ 1,765 C$M
Total
$ 37.52 C$/tonne milled
Off-Site Costs, Refining and Transport $ 8 C$M
Silver Credit $ (18) C$M
Royaltiesnote 2 $ 58 C$M
Total Cash Costs $ 704 US$/oz
Sustaining Capital (excluding salvage) $ 332 C$M
Total AISCnote 3 $ 833 US$/oz
Notes
1. See “Notes on non-IFRS Measures”, slide 48.
2. A 1.5% Net Smelter Royalty (“NSR”) is applied to all gold production. In February 2019 the Company sold a 2% net smelter returns royalty on the Valentine Gold Project to Franco-Nevada Corp. The FS 36
assumes the exercise of a right in favour of the Company to repurchase 0.5% of the NSR for US$7M prior to December 31, 2022, the cost of which is excluded from the Project-level economic analysis.
3. AISC includes Cash Costs and Sustaining Capital, including expansion and closure costs. Excludes salvage and Corporate G&A.
4. Columns may not sum exactly due to rounding.Valentine Gold Project
Feasibility Study
Cash Flow March 29, 2021
Revenues, Capex, Opex Cash Flow
500 250 1,250
400 200
150 750
Cumulative Free Cash Flow (C$M)
300
100
Free Cash Flow (C$M)
200
50 250
C$M)
100 -
- -50 -250
-100
2026: Phase 2
-100 Mill Expansion
-150 -750
-200
-200
-300
-250 -1,250
2022 2023 2024 2025 2026 2027 2028 2029 2030 2031 2032 2033 2034 2035 2036 2037 2038
2022 2023 2024 2025 2026 2027 2028 2029 2030 2031 2032 2033 2034 2035 2036 2037 2038
Period
Period
Revenue Initial Capex
Total Sustaining and Expansion Capex Cash Operating Expenses Post-Tax Unlevered Free Cash Flow Post-Tax Cumulative Unlevered Free Cash Flow
Refining Charges Royalties
37Valentine Gold Project
Feasibility Study
Cash Flow March 29, 2021
EBITDA Tax
350 80% 120 600
300 70%
100 500
Cumulative Total Cash Taxes (C$M)
60%
250 80 400
Cash Taxes (C$M)
50%
EBITDA (C$M)
EBITDA Margin (%)
200 60 300
40%
150 40 200
30%
100 20 100
20%
50 10% - -
- 0% -20 -100
2022 2023 2024 2025 2026 2027 2028 2029 2030 2031 2032 2033 2034 2035 2036 2037 2038 2022 2023 2024 2025 2026 2027 2028 2029 2030 2031 2032 2033 2034 2035 2036 2037 2038
Period Period
EBITDA EBITDA Margin NL Mining Tax Income Tax Cumulative Total Taxes
38Valentine Gold Project
Feasibility Study
Financial Analysis March 29, 2021
Valuation Inputsnote 1 Project Financial Metrics Sensitivity to Gold Price
US$1500/oz for Mineral Resources
$1,250 $1,350 $1,500 $1,550 $1,750
US$1500/oz for Mineral Reserves Gold Price (US$/oz)
Downside ↖ PFS Case ↖ Base Case ↗ Consensus ↗ Spot
US$1500/oz for Financial Model and Valuation 0% $579 $739 $973 $1,052 $1,351
US$:C$ exchange of 0.75 3% $403 $537 $727 $792 $1,033
Effective tax rate of 30% 5% $313 $432 $600 $657 $868
1.5% Royaltynote 2 After-Tax NPV (C$M)
8% $208 $309 $450 $497 $672
5% discount rate, discounted to Dec 31, 2021 10% $153 $245 $370 $412 $568
January 1, 2022 construction start; October 2023 first gold pour 15% $52 $125 $223 $255 $375
Base Case Financial Results
After-Tax IRR 18.8% 24.4% 31.5% 33.9% 42.2%
Pre-Tax NPV5% of C$867M, IRR of 36.9%, Paybacknote3 of 1.8 years
Post-Tax NPV5% of C$600M, IRR of 31.5%, Paybacknote3 of 1.9 years NPV5%/Capex 1.0x 1.4x 2.0x 2.2x 2.8x
NPV5%/Initial Capex of 2.0x
After-Tax Payback Years 5.4 3.8 1.9 1.7 1.4
EBITDA of C$2,048M at 53% margin
Post-Tax unlevered free cash flow of C$973M EBIDTA (C$M) $1,414 $1,668 $2,048 $2,175 $2,682
EBITDA Margin 44% 48% 53% 54% 60%
The project achieves an IRR of 15% at US$1,185/oz
The project achieves a NPV5%/Initial Capex ratio of 1:1 at US$1,245/oz Total After-Tax FCFnote4 (C$M) $579 $739 $973 $1,052 $1,351
note5
Average Annual FCF (C$M) $84 $99 $119 $126 $152
The project achieves a NPV15%/Initial Capex ratio of 1:1 at US$1,630/oz
Notes
1. See “Notes on non-IFRS Measures”, slide 48.
2. Assumes re-purchase of 0.5% of Franco Nevada royalty prior to production startup. 39
3. Payback is defined as achieving cumulative positive free cashflow after all cash costs and capital costs, including sustaining and expansion.
4. Calculated LOM.
5. Calculated for the period 2024-2033 of sustained high grade mill feed.Valentine Gold Project
Feasibility Study
Valuation Sensitivities March 29, 2021
Key Takeaways (all metrics quoted after-tax)note 1 All metrics quoted after-tax in C$M -20% -10% 0% 10% 20%
Low Capital Intensity IRR 15.9% 24.4% 31.5% 38.1% 44.2%
Base Case (US$1,500/oz) NPV5%/Capex Ratio of 1.94x Head Grade
NPV $249 $432 $600 $765 $920
Spot (US$1,750/oz) NPV5%/Capex Ratio of 2.80x
IRR 37.5% 34.7% 31.5% 28.2% 24.9%
High-Grade, High-Margin Project on Startup for Fast Payback. For the Operating Cost
period 2024-2025 with high grade mill feed at US$1500/oz: NPV $752 $680 $600 $520 $442
After-Tax Payback: 1.9 years
IRR 38.5% 34.7% 31.5% 28.9% 26.6%
Head Grade 2.58 g/t, Gold production of 192 koz/year Initial Capital Cost
Average Annual EBITDA of C$228M and FCF of C$167M NPV $639 $620 $600 $581 $561
NSR rock value of C$156 /t note 2
IRR 35.6% 33.6% 31.5% 29.4% 27.3%
Ten Years of High Value Rock and High Margins. For the period 2024-2033 Mining Cost (C$/t Mined)
with high grade mill feed at US$1500/oz: NPV $690 $646 $600 $554 $510
Head Grades 1.62 g/t, Gold Production of 173 koz/year IRR 15.9% 24.4% 31.5% 38.1% 44.2%
Average Annual EBITDA of C$188M and FCF of C$119M Gold Price
NPV $250 $432 $600 $765 $920
NSR rock value of C$99 /t note 2
IRR 47.1% 38.8% 31.5% 25.0% 18.8%
$Cdn:$US F/X Rate
NPV $999 $783 $600 $447 $312
Notes
1. See “Notes on non-IFRS Measures”, slide 48
2. NSR rock value calculated as C$ Revenue per tonne milled, after process recovery, based on payable gold and silver credits 40Valentine Gold Project
Feasibility Study
Opportunities not Included in the FS March 29, 2021
Opportunity Description Scalenotes1-3 Benefit to Project
Opportunity to FS open pits are optimized for rate of Additional OP M&I Mineral Resources at Marathon and • Mine Life Extension
Enlarge Open Pits into return and not scale or NPV. Pit Leprechaun of 0.76 Moz (15.52 Mt at 1.53 g/t Au) are contained
additional M&I enlargement is possible with higher within the Whittle Mineral Resource Pit shells but excluded from
Mineral Resources strip ratio for lower IRR threshold. the FS Mining Pits.
Opportunity to Additional Inferred Mineral Resources Additional OP Inferred Mineral Resources at Marathon and • Mine Life Extension
convert Inferred exist both within the FS mining pits Leprechaun of 0.61 Moz (12.45 Mt at 1.51 g/t) including 0.29 Moz • Reduced Strip Ratio
Mineral Resources and in the Whittle Mineral Resource (5.92 Mt at 1.50 g/t Au) contained within the FS mining pit shells • Opportunity to increase mill
pit shells. (undiluted, and treated as waste). feed cut-off and head grade
Opportunity to bring On going exploration at the Berry Zone Ongoing exploration • Mine Life Extension
in additional open pit has the potential to provide another • Increased annual production via
ore sources (eg Berry) potential open pit source of ore feed. potential Phase 3 mill expansion
through exploration Additional 2021 exploration at Sprite (increased ore supply from 3 pits
and Victory Deposits operating in parallel)
Acceleration of Phase Bring forward mill expansion to 4Mtpa Highest grade mill feed of 2.6 g/t Au processed at higher rates • Higher up front gold production
2 Mill Expansion from 2026 to 2023/24. Immediate • Faster payback
expansion on start-up
Future Underground Both the Marathon and Leprechaun Additional UG M&I Mineral Resources at Marathon and • Mine Life Extension
Mining ore bodies are open at depth. Limited Leprechaun of 0.14 Moz (1.17 Mt at 3.61 g/t Au) and UG Inferred
exploration below Whittle pit shells Mineral Resources of 0.27 Moz (2.43 Mt at 3.43 g/t Au)
Notes
1. Mineral Resources are inclusive of the Mineral Reserves
2. Mineral Resources that are not Mineral Reserves do not have economic viability 41
3. See “Notes to the Mineral Resources”, slide 21 and “Notes to the Mineral Reserves”, slide 23More Information
ESG
42One of Canada’s
Leading Gold
Socio-Economic Impacts and Benefits Development Projects
Creation of over 19,000 person years of total employment in
Canada (direct, indirect and induced), including approximately
11,000 person years in NL
Average annual employment of nearly 1,300 person years of
employment in Canada, including an annual average of 725
person years within NL
Generation of approximately C$1.3 billion in income to workers
and businesses within Canada, including C$750 million to workers
and businesses located within NL
Contribution of C$3.6 billion to Canada’s gross domestic product
(GDP), which includes C$2.9 billion to NL’s GDP
Generation of approximately C$292 million in federal government
revenues
Generation of approximately C$400 million (C$27 million on an
average annual basis) in incremental revenues to the treasury of
NL
Notes
1. Based on the Valentine Gold Project Pre-Feasibility Study released in April 2020, and an independent assessment completed by Strategic Concepts Inc.
2. Estimates assume 15-years of construction, operation, and rehabilitation, and utilize a gold price assumption of US$1350/oz 43One of Canada’s
Leading Gold
Community Investment Development Projects
44One of Canada’s
Leading Gold
Board: Independent Directors Development Projects
Over 30 years experience in Over 30 years experience working
Over 35 years of senior with companies involved in the
management, corporate mineral exploration, technical
and economic project studies, resource sector. Since 2004, Janice
development and operational has held senior executive positions
experience in the natural and mine construction,
commissioning and operations. with various resource companies
resources, financial services and including Endeavour Mining
health services industries 2016-2018 served as President &
CEO of Arizona Mining Inc. Corporation, Etruscan Resources Inc.
and Namibia Critical Metals Inc.
Jim Gowans Janice Stairs
George Faught
Director Director
Chairman
Over 25 years of experience in
Finance professional with over 25
the mining industry in financial
years of corporate finance,
and management roles. His
commodity and capital markets,
experience has been focused on
business and corporate
restructuring and transforming
development experience in
exploration and development
mining, financial services, and IT
companies into producers
Doug Bache Julian Kemp
Director Director
Business executive with over 35 Over 35 years experience in
years of experience. Served as a advanced-stage exploration,
member of the Newfoundland feasibility, construction, operations
House of Assembly from 2014- and acquisitions. Member of the
2018 as Minister of Finance and Canadian Institute of Mining and
President of Treasury Board and the Association of Professional
Minister of the Status of Women Geoscientists of Ontario
Cathy Bennett Joe Spiteri
Director Director
45You can also read