DEVELOPMENT OF A DIGITAL 3D PARTICIPATION PLATFORM - CASE STUDY OF WEILIMDORF (STUTTGART, GERMANY) - The International Archives ...
←
→
Page content transcription
If your browser does not render page correctly, please read the page content below
The International Archives of the Photogrammetry, Remote Sensing and Spatial Information Sciences, XLVI-4/W1-2021
                6th International Conference on Smart Data and Smart Cities, 15–17 September 2021, Stuttgart, Germany

    DEVELOPMENT OF A DIGITAL 3D PARTICIPATION PLATFORM - CASE STUDY OF
                   WEILIMDORF (STUTTGART, GERMANY)

                                        P. Würstle ∗, T. Santhanavanich , R. Padsala , V. Coors

                                                University of Applied Sciences Stuttgart
                                                           Schellingstraße 24
                                                       70174 Stuttgart, Germany
                    (patrick.wuerstle, thunyathep.santhanavanich, rushikesh.padsala, volker.coors) @hft-stuttgart.de

KEY WORDS: Public Participation Platform, 3D City Models, CityGML, 3D Web Visualization, Open Geospatial Consortium

ABSTRACT:

This paper explains the development of a 3D city model-based Public Participation Platform as a prototype and its implementation
in a real-world public participation process to redevelop the Weilimdorf area of Stuttgart city. Alongside conducting Weilimdorf’s
public participation process, the goal of the mentioned public participation platform is to research citizens’ acceptance of such tools.
The usage of digital tools has become more critical for participation processes. The need for social distancing expedites this change,
particularly during the pandemic. Previous research frequently focuses on 2D platforms and smaller sample sizes but nevertheless
shows the importance of such tools. However, with current developments in geospatial and web streaming technologies, it has
become easier and faster to visualize large-scale 3D city models over the web. In this research, these technologies were used by
the citizens of the Weilimdorf area to evaluate the usability of the platform and collect their feedback. The result shows that such a
digital public participation platform is a valuable supplement to traditional in-person public participation methods.

                      1. INTRODUCTION                                 fully participate in the public meetings or prevent them from
                                                                      attending them (Kingston, 2007). This is now backed by the
Our world is urbanizing at an exceptional rate than ever before.      COVID-19 pandemic, which changed the traditional working
By 2050, a study from the United Nations predicts that 68% of         culture globally. Citizens are instructed by their government
the world population will be living in urban areas compared to        to work from home and only leave their houses in times of
53% in 2014 (UN, 2014). This itself gives an idea about the           desperate need. Information and communication technology
extra infrastructural load and demands citizens will ask from         (ICT) presents a realistic alternative, especially when face-to-
their governments. Today, in the time where every city aims           face meetings are taken over by online meeting applications
to become a ”Smart City”, it is very critical for local govern-       and mobile technologies with 4G/5G services transforming how
ments to understand that while delivering ”wow”, they do not          users use the internet for communication and interaction with
lose the vision on what citizen needs ”now”. Hence an essen-          others. Such innovation has also led different countries’ polit-
tial stakeholder for solving such a challenge are the citizens        ical systems to adapt and become more responsive, transparent,
themselves by making them involved in the decision-making             and oriented towards public-oriented policies for better gov-
process. (Marzouki et al., 2017) defined the citizen particip-        ernance and a sustainable urban environment. This led to coin-
ation process as a way in which citizens can effectively share        ing a new terminology, e-participation, which, together with e-
their life circumstances by communicating their problems and          democracy, forms e-Government.
demands to the government for their neighborhood, city, and
country. Such communications help in the decision-making              This paper presents a first insight into the 3D city model-based
process and help strengthen the democracy and confidence of           prototype of a digital public participation platform currently un-
citizens in government by providing the platform and opportun-        der development at the University of Applied Sciences, Stut-
ities to get involved in making a more intelligent, better world      tgart. As its first real-world use case, the prototype is tested
of tomorrow. A result that is valuable for citizens, city planners,   on around 500 Weilimdorf’s citizens to collect their views and
and the government made with the consent of the public will be        ideas on further redevelopment of their neighborhood by a local
more widely accepted by everyone and helps in validating both         city developer, STEG , in collaboration with the municipality of
top-down and bottom-up approaches in governance.                      Stuttgart. The participants came from the entire Weilimdorf dis-
                                                                      trict. This paper aims to explain the prototype’s technical devel-
Traditional public participation methods, like survey question-       opment process and the feedback received on the user interface
naires, public meetings, are generally no more favored by the         (UI), user experience (UX), and what, according to citizens, are
citizens. Such methods do help in knowing citizens’ mindsets,         essential components for a digital public participation platform.
but makes it tough for citizens to understand the complex in-
terdependency of multiple city development indicators due to
                                                                                          2. RELATED WORK
minimal use of city visualization methods. Additionally, such
participation methods are usually held during working days at
a fixed place and time when people are often at work or in            With innovations in ICT tools, using an e-participatory platform
the evening where other commitments either restrict them to           for citizen participation in urban planning is not new. Moreover,
                                                                      traditional planning methods have been immensely transformed
∗   Corresponding author.                                             using innovative ICT tools and techniques (Knapp and Coors,

                                                  This contribution has been peer-reviewed.
                 https://doi.org/10.5194/isprs-archives-XLVI-4-W1-2021-123-2021 | © Author(s) 2021. CC BY 4.0 License.              123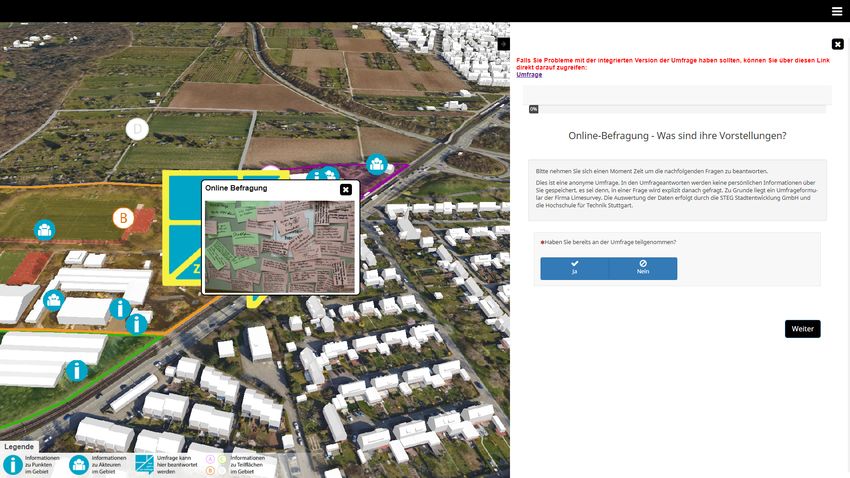
The International Archives of the Photogrammetry, Remote Sensing and Spatial Information Sciences, XLVI-4/W1-2021
               6th International Conference on Smart Data and Smart Cities, 15–17 September 2021, Stuttgart, Germany

2007), (Silva, 2010), and (Yigitcanlar and Velibeyoglu, 2008).       Although 3D geo-visualisation has been applied in citizen par-
Over the last decades, web-based technologies, especially web-       ticipatory processes before, and a list of functionalities that a
based geo-visualization tools, have been widely used and ac-         citizen participation platform should incorporate is well avail-
cepted to cater to citizen participation. Much research literature   able (Steiniger et al., 2016), there is still a lack of use cases in
has also validated the impact of using 2D web maps and applic-       using web 3D geo-visualisation to cater to the citizen particip-
ations to initiate cities’ public participation process (Ganapati,   ation process. Many public participatory applications use 2D
2010), (Rall et al., 2019), (Narooie, 2014), and (Hansson et al.,    web maps and only small modules or test cases in 3D - primary
2017). Even though 2D maps are good at sharing and visu-             reasons being time and skills required to program a 3D par-
alizing information, they still miss that cutting edge to under-     ticipatory platform. This comes as a surprise considering the
stand reality and visualize complex urban issues most effect-        amount of open data initiatives take from the governments, use
ively. Increasing development in 3D geo-visualization over past      cases demonstrated where 3D geo-visualization is successfully
years has allowed users to share and visualize geo-referenced        used, current advancement and available technologies that can
3D models of entire cities on the web. Over 2D maps, the rapid       be used for building dynamic web-based 3D applications than
development of web-based 3D geo-visualization tools has be-          before. A quick review of the literature shows further devel-
nefited the development of interactive 3D applications for the       opment and use cases of the participatory platform and shows
e-Participation platforms and has provided many advantages           how 3D GIS can play an essential role in public participatory
concerning communication, cooperation, and particularly par-         platforms. (Steiniger et al., 2016) and (Goetz, 2008), in their
ticipation (Knapp and Coors, 2007). Mutually, there has been         literature, pointed out the functionalities an e-planning platform
understanding and agreements between scholars that 3D geo-           should have.
visualization can effectively improve the understanding and visu-
alization of the current scenario and problem statement. Previ-      Additionally, they also emphasized user-centered design, which
ously, these web-based 3D visualization tools were based on          included 3D GIS as a critical module. Beaudreau in YouSay-
virtual globes like Google Earth which revolutionized 3D visu-       City (Beaudreau, 2011), a 3D online public participation plat-
alization worldwide. However, three significant issues emerged       form, demonstrated the integration of 3D city models in KML
1) a lack of high-resolution 3D content, 2) users’ necessity to      using Google Earth API. This development’s important out-
download a plugin for use in a web browser and 3) performance        come included 3D-oriented discussion forums, visualizing 3D
on the web.                                                          KML models on the web, and interactive surveys on a web plat-
                                                                     form. Hu et al. (Hu et al., 2013) demonstrated another such
Specifically, for Google Earth, with Trimble acquiring Google        participation platform wherein a standalone application was de-
Sketch-up with its 3D warehouse, it was no longer possible           ployed on each client machine with synchronization to server
that users could directly upload their 3D models on Google           machine where all the project-related data were hosted. Cli-
Earth. As an alternative, Cesium, a web globe built on JavaS-        ent machine hosted 3D viewer based on Skyline glove viewer,
cript API, allowed users to have complete control of their web       a group of simple analytical functions, a set of collaboration
application. Furthermore, in previous research by (Würstle et       tools, and a communication module. Taking a step forward,
al., 2019) Cesium1 was compared to other web globes such as          Khan et al. (Khan et al., 2014), under the UrbanAPI project,
NASA Web World Wind 2 and Google Earth3 . Cesium uses                demonstrated that different kinds of ICT applications for urban
WebGL to render 3D and without any need for an extra browser         planning could be developed and applied at different urban scales
plugin. Cesium is capable of delivering web-based 3D geo-            for collaborative decision-making and policy development. Two
visualization anytime, anywhere. Closest to the Cesium Web           essential applications demonstrated here were the introduction
Globe in terms of functionalities and support of different 3D        of Virtual Reality developed for the general public (bottom-
data formats are Esri’s web globe, which can be controlled by        up approach) due to its higher visualization appeal based on
the ArcGIS API for JavaScript4 , and the Mapbox webmap plat-         X3DOM and Urban Growth Simulation based on agent-based
form 5 , which the Mapbox GL JS can control. Mapbox GL               models (ABMs) for land-use change simulation. Based on the
JS is a JavaScript library used for rendering interactive 2D and     Urban API finding, Khan et al. (Khan et al., 2017) again de-
3D maps. Cesium supports a variety of vector formats like            veloped a citizen participation platform to support smart city
KML, GeoJSON, TopoJSON, glTF, and its own content deliv-             decision-making coined as Smarticipate. Smarticipate platform
ery format of 3D Tiles, which supports CityGML. CityGML              is based on a micro-services-based approach that allows the
is an open data model and XML-based data format from Open            development of individual features as a web service with less
Geospatial Consortium to store and exchange virtual 3D city          dependency on each other. It uses domain-specific language
models (Gröger and Plümer, 2012). Today more than 100 cit-         to analyze citizen proposals and generates automated feedback
ies worldwide have their 3D city models in CityGML models            based on open government data. Also, in a similar category
available free for the public uses (Delft University of Techno-      is the open-source DIPAS platform. DIPAS platform is a joint
logy, 2019). Additionally, similar to other web globes, Cesium       project of the Authority for Urban Development and Housing
allows integrating static/dynamic vector data, multiple web ser-     with the State Office of GeoInformation and Surveying and
vices, terrain profiles, and satellite imagery into a single vir-    the CityScienceLab of HafenCity University in Hamburg, Ger-
tual environment, making public participation much more in-          many. With DIPAS (Lieven, 2017), along with existing devel-
tuitive and exploratory. virtualcitysystems GmbH (VCS)6 has          opment, future developments can also be visualized both in 2D
developed a web-based client, VC Map on top of Cesium, ad-           and 3D. Additional elements such as automated report genera-
ministered by the VC Publisher.                                      tion, integration with open geodata of Hamburg and functional-
1
                                                                     ity to visualize future masterplans using Xplanung data stand-
    https://cesium.com/
2                                                                    ards makes DIPAS one of a kind public participation platform.
    https://worldwind.arc.nasa.gov/web/
3   https://www.google.com/earth/
4   https://developers.arcgis.com/javascript/latest/                 One future goal of the platform prototype presented in this pa-
5   https://www.mapbox.com/                                          per is to take a step forward by integrating an urban simulation
6   https://vc.systems/en                                            engine SimStadt. Having a connection to SimStadt in the back-

                                                This contribution has been peer-reviewed.
               https://doi.org/10.5194/isprs-archives-XLVI-4-W1-2021-123-2021 | © Author(s) 2021. CC BY 4.0 License.                 124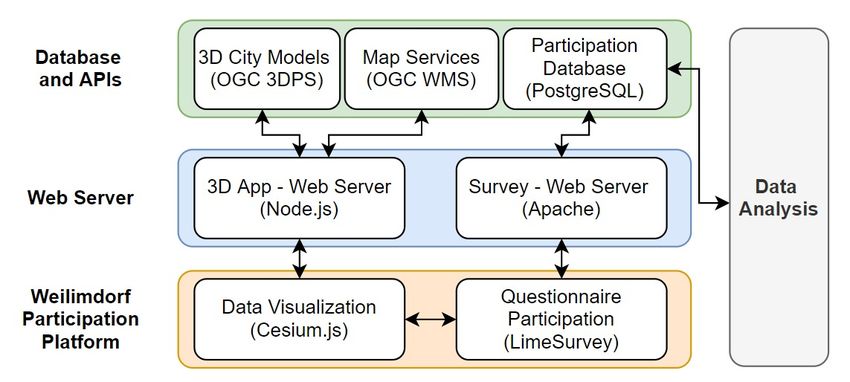
The International Archives of the Photogrammetry, Remote Sensing and Spatial Information Sciences, XLVI-4/W1-2021
              6th International Conference on Smart Data and Smart Cities, 15–17 September 2021, Stuttgart, Germany

end will allow both citizens and decision-makers to simulate
and visualize what-if scenarios for an even better and informed
decision making in particular for the building stock energy de-
mand and renewable energy potential present on site. However,
it being a future vision, the present paper focuses more on the
prototype’s technical development in its current state and docu-
ments citizens’ feedback on its overall UI and UX.

                   3. IMPLEMENTATION
                                                                                        Figure 2. System Architecture
3.1   Application
                                                                       3.2    System Architecture
The participation project is based around an area in Weilim-
dorf. Weilimdorf is a district in Stuttgart. The area belonged to      3.2.1 Database and APIs The main data that is used for
a former gardening company and has been bought by the city.            visualization purposes comes from the city and the STEG. The
It is of great importance for the residents, based on its position,    city provides a CityGML dataset of the buildings in the region
use, and size. It is planned to create a development concept           in LoD2 and an OGC Web Map Service (WMS) for the back-
that provides the framework for all future developments (Noller,       ground map. The CityGML model was converted to the 3D
2021). The application focuses on the four areas that are of in-       Tiles OGC Standard for visualization using the Feature Ma-
terest for the new development. Area A includes a youth cen-           nipulation Engine (FME)7 data integration platform from Safe
                                                                       software. Additionally, a terrain set was provided to visualize
                                                                       the surrounding area and give a better impression of it. The ter-
                                                                       rain was converted from GeoTIFF to the quantized mesh format
                                                                       in a similar fashion. The data conversion pipeline from GeoTIFF
                                                                       to the streaming formats is also developed using the FME soft-
                                                                       ware. Contrary to the terrain and the building model, which
                                                                       were only provided for the purpose of this project, the WMS is
                                                                       publicly available for non commercial use. It shows the areal
                                                                       photos from 2015 of the region and is provided over the Arc-
                                                                       GIS service of the city. It has a ground resolution of 20 cm at
                                                                       the highest scale of 1:500.

                                                                       These datasets build the basis for the visualization of the sur-
                                                                       rounding environment. The content data for the region was
                                                                       provided by the STEG and, in extension, the clubs and other
  Figure 1. Area Weilimdorf (Imagery provided by the city of           stakeholders in the area. The data includes pictures and text in-
                         Stuttgart)                                    troducing the area, the stakeholders, and certain specific interest
                                                                       points. For a better understanding of the region, a geojson data-
                                                                       set was created that describes the specific areas of interest.
ter, a daycare, and a refugee shelter. Because there are already       The HFT Stuttgart acquired additional data in the project de-
these facilities in this area and it has a central location and good   scribing the social structure in the area from Infas360. This
connection to public transport a community center is planned           gives the possibility to draw conclusions on the participation
here. Area B is already hosting different sports clubs. Area C         rate among the citizens living in the area.
contains the former gardening company and some free spaces.
These should be kept free of buildings to keep their significance      3.2.2 Web Server Two open-source servers were in use for
for the urban climate.                                                 the purpose of hosting the Cesium application and the survey
                                                                       tool. Node.js8 is an asynchronous JavaScript runtime used to
The platform shows the map with buildings and terrain. The             host the Cesium application. It utilizes the Express framework.
blue markers visible in figure 1 show the location of the points       In addition, an Apache HTTP Server is used to host the Limesur-
of interest in the area. By clicking on them, a context window         vey9 online survey tool. A Virtual Ubuntu 18.04 Machine is
opens up on the right side of the application. This is also where      used to run both of the Web servers.
the survey is opened. The Questionnaire in figure 3 was set up
in two parts. The first being the specific questions regarding         3.2.3 Data Visualization The visualization’s basic frame-
the participation process. The STEG has devised the questions          work is built on the Cesium WebGL library, which supports
for the first part. The second part of the questions gives the         several geospatial data formats such as glTF and GeoJSON.
participants the chance to evaluate the platform (Section 4) and       Cesium’s 3D Tiles format is a data format for optimized 3D data
give feedback on the process. The functionality of the platform        streaming through the web. It is used for the visualization of 3D
was capped at this point to keep the entry-level for participants      Buildings. Cesium can visualize different terrain formats, such
low. It is possible to let users create their own designs with 3D      as quantized-mesh, GeoTIFF, Floating Point Raster, USGS AS-
models with the tools available. Previous studies (Würstle et         CII DEM and CDED.
al., 2019) have shown that this is difficult for people who are        7   https://www.safe.com/
less adept with these kinds of tools and require an extensive          8   https://nodejs.org/en/
introduction in the process.                                           9   https://www.limesurvey.org/

                                                 This contribution has been peer-reviewed.
                https://doi.org/10.5194/isprs-archives-XLVI-4-W1-2021-123-2021 | © Author(s) 2021. CC BY 4.0 License.                 125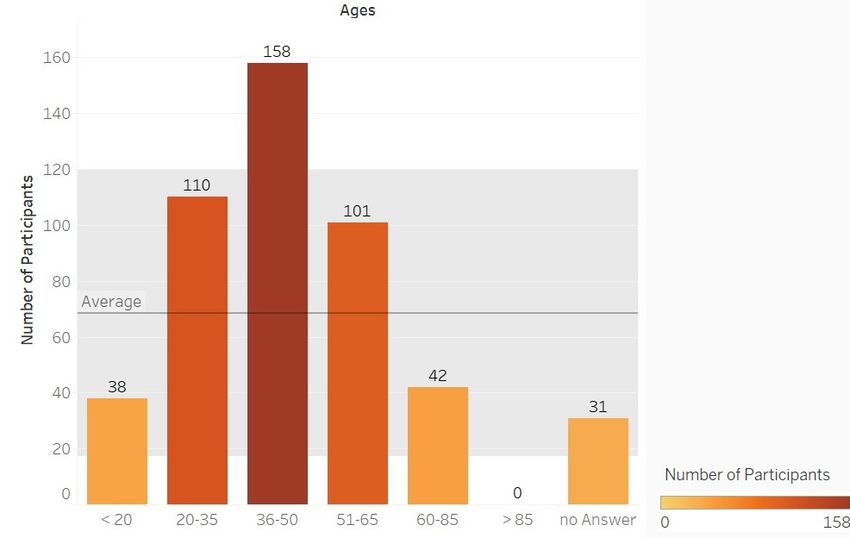
The International Archives of the Photogrammetry, Remote Sensing and Spatial Information Sciences, XLVI-4/W1-2021
6th International Conference on Smart Data and Smart Cities, 15–17 September 2021, Stuttgart, Germany
Figure 3. Layout Questionnaire
To deliver the 3D Tiles dataset in a standardized way, an API Limesurvey provides different possibilities of setting a survey
server was implemented, followed by the OGC 3D Portrayal up. Access to the questionnaire can be restricted over Tokens
Services10 (3DPS) as our 3D geospatial content delivery imple- or an IP or kept open. No validation method was selected to not
mentation specification. With the 3DPS, 3D contents can be re- limit the participants and have a barrier of entry that is as small
trieved as an HTTP/GET Key-Value Pair (KVP)-based request as possible. This also allowed for maximum anonymity.
as shown in the listing 1. It is an example request with import-
ant KVP encodings used to request the specified 3D contents on
our visualization platform. 4. USER EVALUATION OF THE PLATFORM
Listing 1. Example 3D Portrayal Service URL In some previous studies by (Lafrance et al., 2019) or (Mah-
moud and Takafumi, 2011), the focus is on qualitative feed-
http://[IP Address]:[Port]/service/v1?
back with a small number of participants. In this research,
service=3DPS
around 500 citizens have taken part in the participation process.
&acceptversions=1.0
The participation and the questionnaire were anonymous and
&request=GetScene
no data on the participants was saved only their answers. The
&boundingbox=9.40,49.05,9.51,49.10
Results of the first part that regard the project and the area were
&lods=2
evaluated by the STEG and will be presented to the city. In this
&layer=building
part the citizens were asked to comment on certain aspects of
&format=application/json+3dtiles
the Area and what future developments they would like to see.
The second part that relates to the platform and the digital pro-
Moreover, we also integrated the Web Map Service layer as our cess itself is evaluated in the following paragraphs. 480 of the
basemap in the 3D web application. participants that started the survey answered the second part.
3.2.4 Questionnaire To conduct the survey for the parti- 4.1 Participants
cipation process, the open-source tool Limesurvey was used.
Limesurvey provides two options for using the software. One is The gender distribution of the participants is balanced with 45%
to acquire a server instance from Limesurvey, the other to host female, 44,8% male, and 0,6% divers (9,6% did not answer).
the software by oneself. The self-hosting solution was used in This corresponds to the data on the area with 50,65% female
this project. Limesurvey is built with PHP and Javascript. It and 49.35% male.
uses TWIG to allow the creation of Templates that can be seen
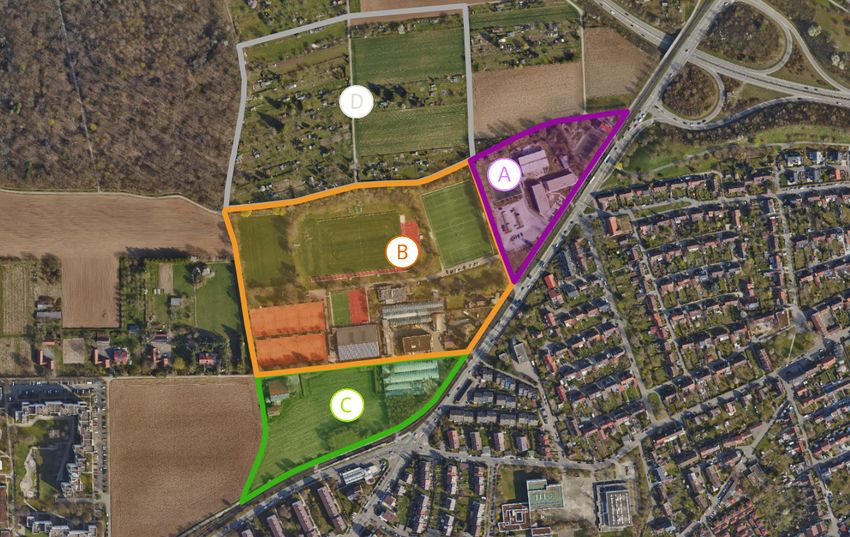
The age of the participants follows a normal distribution. Based
on the frontend. Limesurvey also provides a backend to evalu-
on the survey responses, 8.75% of the participants are over the
ate the survey and give a first visual impression of the participa-
age of 65. In the region, around 18.89% of the inhabitants fall
tion. To install the software on a server, a database, in this case,
in the age range of 65 and over. The participants below the age
Postgres 9, and PHP libraries are required.
of 20 make up 7.92% of the overall participants. The data of the
10 http://docs.opengeospatial.org/is/15-001r4/15-001r4. region only shows the inhabitants with an age of 18 and below.
html#_getscene_request This does not match the age ranges of the survey but still gives
This contribution has been peer-reviewed.
https://doi.org/10.5194/isprs-archives-XLVI-4-W1-2021-123-2021 | © Author(s) 2021. CC BY 4.0 License. 126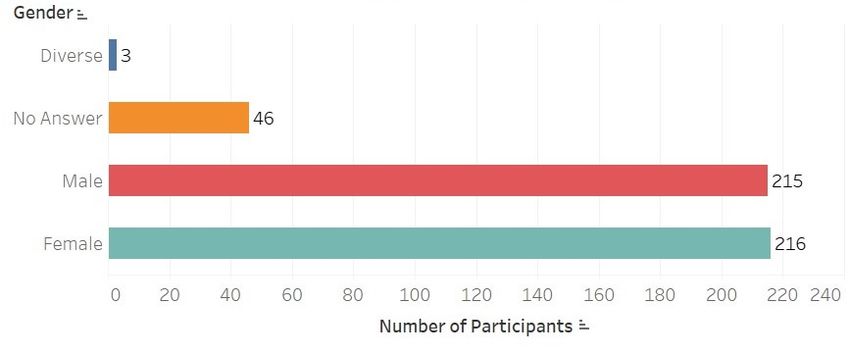
The International Archives of the Photogrammetry, Remote Sensing and Spatial Information Sciences, XLVI-4/W1-2021
              6th International Conference on Smart Data and Smart Cities, 15–17 September 2021, Stuttgart, Germany

                                                                      statement                                      µ       σ

                                                                      (1) ”I find the platform useful”               4.14    1.0

                                                                      (2) ”I find the platform easy to use”          3.93    1.21

                                                                      (3) ”I find the use of digital media in cit-   4.52    0.86
                                                                      izen participation processes helpful”

                                                                      (4) ”The 3D platform helps me better un-       4.01    1.09
                 Figure 4. Gender distribution                        derstand information spatially in the plan
                                                                      area”

                                                                      (5) ”I find the 3D platform an innovative      4.28    1.00
                                                                      form of citizen participation”

                                                                                  Table 1. Evaluation of the statements

                                                                    of participants in the 65 and above age group for the statement
                                                                    questions are overall in line with the overall numbers. However,
                                                                    the answers are consistently a few points lower than the aver-
                                                                    age. Nevertheless, the participants mostly agree on all state-
                                                                    ments. This suggests that people above the age of 65 are not
                                                                    necessarily hindered by an online participation tool.

                   Figure 5. Age distribution

a general idea of the composition in the area compared to the
survey participants. The citizens below the age of 18 make up
20.7% of the inhabitants in that region. Participants in the age
range between 20 and 65 make up 76.88% of all participants.
The inhabitants in the age range between 18 and 65 make up
60.42% of all inhabitants. This indicates that disproportion-
ately more people in the age range of 20 to 65 partook in the
participation process based on the region’s inhabitants. How-                  Figure 6. Comparison between age groups
ever, it doesn’t factor in participants who are not living in the
area (23.34%) and the people who didn’t give any information
on their age (6.46%).                                               The number of participants in the age range of 20 to 65 com-
                                                                    pared to the inhabitants suggests that comparatively more people
4.2   Evaluation Question                                           in this age range participated. Based on the project partner
                                                                    STEG’s experiences, offline participation processes often tend
The participants were given six questions to evaluate and rate      to an older demographic. This further indicates that online par-
their experience with the platform. The first question asked the    ticipation and the on-demand availability of it help citizens with
participants how content they were in general with the use of the   obligations that would usually prohibit them from participating
3D platform. The participants were given four options, very dis-    in taking part. The evaluation of the written feedback gives an
satisfied (7.27%), somewhat dissatisfied (16.96%), rather satis-    overview of some areas that would benefit from improvement.
fied (39.65%), and very satisfied (19.82%). 16.3% did not an-       The feedback can mainly be categorized into four major groups.
swer the question. This indicates that generally, the users were
satisfied. The following questions provided a statement to the        • Additional Functionality (20 participants)
participants and asked them if they agree on a scale of 1 (do not
agree at all) to 5 (agree completely).                                • Technical Improvements (38 participants)

The participants’ answers to the statements shown in table 1          • Visual Improvements (16 participants)
mostly agree with the statements. Only the ease of use is below
a rating of four. This shows that the participants are in favor       • Content Improvements (13 participants)
of digital complements to ordinary participation processes. The
Fourth Statement in the table focuses on the aspect of having a     These written suggestions give an excellent starting point to
map to answer the questions compared to not having one.             continue and further develop the platform. The feedback on the
A concern was raised in the written feedback part that older        additional functionalities requested by the participants is often
participants were excluded from digital participation processes     already included in the platform, suggesting that they were not
because of lacking digital competence. The data on the age          presented in a way that allows the participants to find them in-
ranges suggest that fewer people on both ends of the spectrum       tuitively. Two participants also directly ask for better explana-
have taken part, and most are between 20 and 65. The answers        tions of the functions. The demand to be able to rotate the area,

                                                This contribution has been peer-reviewed.
               https://doi.org/10.5194/isprs-archives-XLVI-4-W1-2021-123-2021 | © Author(s) 2021. CC BY 4.0 License.               127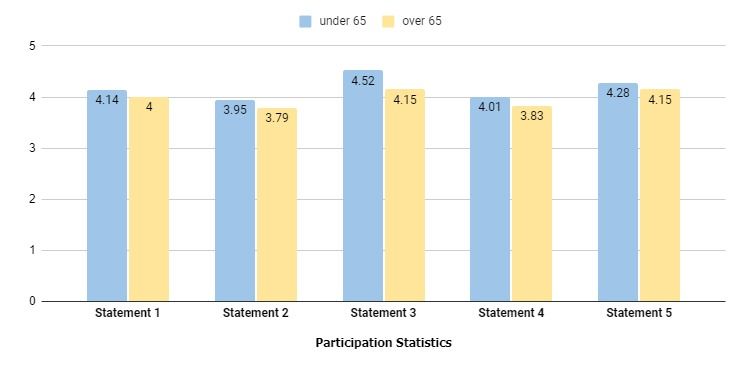
The International Archives of the Photogrammetry, Remote Sensing and Spatial Information Sciences, XLVI-4/W1-2021
              6th International Conference on Smart Data and Smart Cities, 15–17 September 2021, Stuttgart, Germany

for example, is an integral function of the Cesium web globe.         Ganapati, S., 2010. Using geographic information systems to
The request to be able to see the 3D map during the answering         increase citizen engagement.
of the questionnaire (8 participants) is also already possible on
the desktop version of the website but not on the mobile ver-         Goetz, N., 2008. Buergerbeteiligung 2.0, masters thesis, univer-
sion. This shows that it is essential to think about adding this      sity of applied sciences stuttgart.
functionality also to the mobile version. A good mobile version       Gröger, G., Plümer, L., 2012. CityGML – Interop-
appears to be important because ten participants also requested       erable semantic 3D city models. ISPRS Journal of
improvements on the mobile version directly. These have been          Photogrammetry and Remote Sensing, 71, 12–33. ht-
categorized as technical improvements.                                tps://doi.org/10.1016/j.isprsjprs.2012.04.004.

           5. CONCLUSION AND OUTLOOK                                  Hansson, K., Ekenberg, L., Cars, G., Danielson, M., 2017. An
                                                                      e-participatory map over process methods in urban planning.
The results of the user feedback show that online participation       13th International Conference for E-Democracy and Open
is a viable option to enhance offline processes. The statement        Government.
describing the digital media use in participation processes has       Hu, Y., Lv, Z., Wu, J., Janowicz, K., Zhao, X.and Yu, B., 2013.
the highest number of agree with the lowest standard deviation.       A Multi-Stage Collaborative 3D GIS to Support Public Parti-
This leads to the conclusion that digital tools should be part        cipation. International Journal of Digital Earth, 8, 212–234.
of participation processes. The statement regarding the ease
of use has the lowest rating, but still, favors agree. The higher     Khan, Z., Dambruch, J., Peters-Anders, J., Sackl, A., Strasser,
standard deviation indicates that the divide between participants     A., Fröhlich, P., Templer, S., Soomro, K., 2017. Develop-
is the highest here. This can be the result of different levels of    ing knowledge-based citizen participation platform to support
familiarity with technologies such as Google Maps.                    smart city decision making: The smarticipate case study. In-
Furthermore, the results show that digital participation’s target     formation (Switzerland), 8, 47.
audience differs from on-site participation based on experience.
The demographic for digital participation is mainly found in          Khan, Z., Ludlow, D., Loibl, W., Soomro, K., 2014. ICT en-
participants from 20 to 65 years. This can be traced back to the      abled participatory urban planning and policy development.
fact that online participation is not set to specific times of the    Transforming Government: People, Process and Policy, 8, 205–
day and does not require a considerable time commitment to            229.
allow people to participate with long work hours or otherwise         Kingston, R., 2007. Public Participation in Local Policy
less flexible schedules. Sadly because no in-person event was         Decision-Making: The Role of Web-Based Mapping. The Car-
possible, participation could not be compared between the two         tographic Journal, 44, 138–144.
processes. Therefore no clear statement can be made if the in-
person participation process would have seen the same, more or        Knapp, S., Coors, V., 2007. The use of eParticipation systems in
less participation.                                                   public participation: The VEPs example. Urban and Regional
To further develop the participation platform in a next step, an      Data Management – UDMS Annual, 93–104.
eye-tracking study will be set up. For this purpose, a small
group of citizens and experts in the field will be invited to join.   Lafrance, F., Daniel, S., Dragićević, S., 2019. Multidimensional
The setup will consist of a screen and a camera tracking the          Web GIS Approach for Citizen Participation on Urban Evol-
eye movements of the participant. This should result in precise       ution. ISPRS International Journal of Geo-Information, 8(6).
feedback on the User Interface of the platform. The platform          https://www.mdpi.com/2220-9964/8/6/253.
will also be used in another Project in the Nordbahnhof area of
                                                                      Lieven, C., 2017. DIPAS – Towards an integrated GIS-based
Stuttgart.
                                                                      system for civic participation. Procedia Computer Science, 112,
                                                                      2473–2485.
                 ACKNOWLEDGEMENTS
                                                                      Mahmoud, H., Takafumi, A., 2011. A Web-Based Public Par-
The authors would like to thank the Geoinformatics Depart-            ticipation System that Supports Decision Making. Journal of
ment of the State Office for Spatial Information and Land De-         Asian Architecture and Building Engineering, 10(2), 77-84.
velopment (LGL) Baden Württemberg for their fruitful long-           Marzouki, A., Lafrance, F., Danie, S., Mellouli, S., 2017.
term collaboration. Additionally, the authors want to thank the       The Relevance of Geovisualization in Citizen Participation Pro-
STEG for the collaboration on this project and virtualcitysys-        cesses. 397–406.
tems GmbH for providing Software components to the HFT.
The project on which this article is based was funded by the          Narooie, M., 2014. Boosting public participation in urban plan-
Federal Ministry of Education and Research under the number           ning through the use of web gis technology: A case study of
03IHS032A. The responsibility for the content of this publica-        stockholm county.
tion remains with the author
                                                                      Noller,   T.,     2021. Entwicklung des walz-areals.
                                                                      https://www.stuttgart-meine-stadt.de/stadtentwicklung/walz-
                        REFERENCES                                    areal/.
Beaudreau, P., 2011. Yousaycity: an online 3d public participa-       Rall, E., Hansen, R., Pauleit, S., 2019. The added value of
tion tool for urban planning, master thesis, mcgill university.       public participation GIS (PPGIS) for urban green infrastructure
                                                                      planning. Urban Forestry and Urban Greening, 40, 264–274.
Delft University of Technology,              2019. Cities/re-
gions around the world with open datasets. ht-                        Silva, C., 2010. Handbook of research on e-planning: Icts for
tps://3d.bk.tudelft.nl/opendata/opencities/.                          urban development and monitoring.

                                                This contribution has been peer-reviewed.
               https://doi.org/10.5194/isprs-archives-XLVI-4-W1-2021-123-2021 | © Author(s) 2021. CC BY 4.0 License.                128
The International Archives of the Photogrammetry, Remote Sensing and Spatial Information Sciences, XLVI-4/W1-2021
6th International Conference on Smart Data and Smart Cities, 15–17 September 2021, Stuttgart, Germany
Steiniger, S., Poorazizi, M. E., Hunter, A. J. S., 2016. Planning
with Citizens: Implementation of an e-Planning Platform and
Analysis of Research Needs. Urban Planning, 1.
UN, 2014. World Urbanization Prospects: The 2014 Revision.
1-4.
Würstle, P., Santhanavanich, T., Coors, V., 2019. The develop-
ment of an e-participation platform for rural areas in the study
area of niedernhall. REAL CORP 2019: IS THIS THE REAL
WORLD?, 731–737.
Yigitcanlar, T., Velibeyoglu, K.and Baum, S., 2008. Handbook
of research on e-planning: Icts for urban development and mon-
itoring.
APPENDIX
5.1 Privacy Policy
Original Version:
Bitte nehmen Sie sich einen Moment Zeit um die nachfolgenden
Fragen zu beantworten.
Dies ist eine anonyme Umfrage. In den Umfrageantworten wer-
den keine persönlichen Informationen über Sie gespeichert, es
sei denn, in einer Frage wird explizit danach gefragt. Zu Grunde
liegt ein Umfrageformular der Firma Limesurvey. Die Aus-
wertung der Daten erfolgt durch die STEG Stadtentwicklung
GmbH und die Hochschule für Technik Stuttgart.
Translated Version:
Please take a moment to answer the questions below.
This is an anonymous survey. No personal information about
you will be stored in the survey responses unless a question
explicitly asks for it. The survey is based on a survey form
from the company Limesurvey. The data is analyzed by STEG
Stadtentwicklung GmbH and the Stuttgart University of Ap-
plied Sciences.
This contribution has been peer-reviewed.
https://doi.org/10.5194/isprs-archives-XLVI-4-W1-2021-123-2021 | © Author(s) 2021. CC BY 4.0 License. 129You can also read