Dynamic Size and Speed Cursor for Large, High-Resolution Displays
←
→
Page content transcription
If your browser does not render page correctly, please read the page content below
Dynamic Size and Speed Cursor
for Large, High-Resolution Displays
Robert Ball, Michael Szwedo, and Chris North
Center for Human-Computer Interaction
Department of Computer Science
Virginia Polytechnic Institute and State University
Blacksburg, Virginia 24061, USA
north@cs.vt.edu
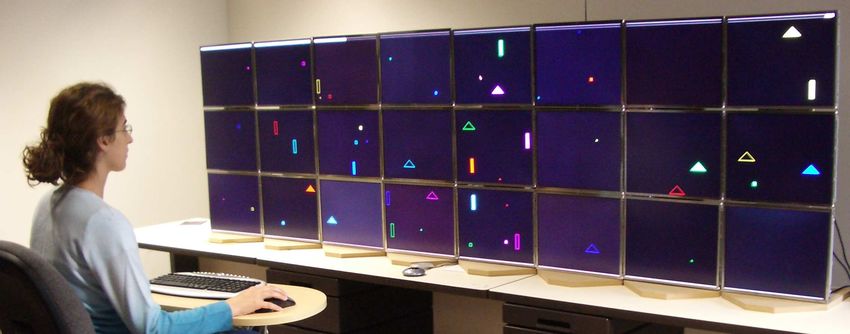
ABSTRACT amplified as people use more than two monitors. For exam-
As larger displays become more available their lack of ade- ple, see figure 1.
quate input techniques become apparent. In this paper we
show the scalability of the dynamic size and speed cursor
for large, high-resolution displays. We introduce the idea of
a dynamic paradigm for input devices, explain three imple-
mentations of the dynamic size and speed (DSS) cursor and
explain results of an experiment. In our experiment we com-
pared the three different implementations of the dynamic si-
ze and speed cursor to cursor warping and standard cursor
settings. In the experiment we found gender bias for two
different tasks (clicking and simple drag and drop), found
that one of the dynamic size and speed cursor implementati-
ons generally outperformed cursor warping and the standard Figure 1. A picture of a user interacting with the large
cursor setting, and explain how distance to and size of tar- display used in this paper.
gets effected results. We conclude by suggesting the use of
a dynamic size and speed cursor with large, high-resolution To overcome this problem, some researchers have sugge-
displays. sted cursor warping [7] or head tracking [7] [1] to non-
continuously reposition the cursor to a different area of the
display. For example, with head tracking, to reposition one’s
Author Keywords
cursor to another part of the display, one need only look at a
input techniques, dynamic, large displays
different part of the display and the cursor is automatically
repositioned to that area.
INTRODUCTION
Large, high-resolution displays are becoming increasingly The purpose of this paper is to introduce a new interactive
more common. With the ability to use off the shelf hardware paradigm of how an existing mouse cursor’s usability might
and free open-source software such as DMX [11] and Chro- be improved. In this paper we introduce the idea of a dyna-
mium [8] more and more people are able to build graphics mic size and speed cursor (DSS cursor). Following the idea
clusters as one large, unified display. of increased cursor visibility from [6], we have developed a
technique of both greater visibility on the display as well as
The standard mouse technique is problematic with large, overcoming the problem of mouse rowing.
high-resolution displays. As displays grow a problem known
as ’mouse rowing’ is introduced. Mouse rowing is the act of Fundamentally, how does one quickly and precisely point
trying to move one’s cursor from one side of the display to to one pixel among millions and millions on a large, high-
the other through a series of repeated physical movements of resolution display? Using Fitt’s law as a basis, the farther
moving the mouse rapidly on the desk. This problem can be away a target, the longer it takes to point to a target. At
the same time, the smaller the object the longer it takes to
point to it. Hence, time to point to targets across large, high-
resolution displays, where targets are significantly smaller
than display size, increases dramatically.
In this paper we suggest that cursor size and speed should
not be static, but dynamic for the purpose of using Fitt’s law
to one’s advantage, not disadvantage. It should be based not
on historical standards, but on what would be best suited to
1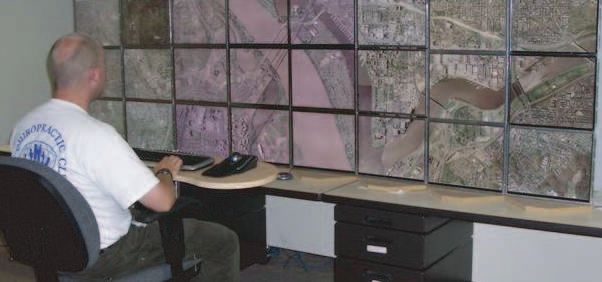
each display. We introduce the dynamic size and speed cur-              DYNAMIC CURSOR INTRODUCED
sor concept, explain our implementations, discuss an evalua-            Cursor speed is dependent on operating systems and user
tion of our implementations compared to other techniques,               preference. However, in general, most operating systems use
and discuss possible future input techniques.                           a bimodal speed paradigm, a base speed in which the cursor
                                                                        will move m pixels per unit of physical mouse movement.
PREVIOUS WORK                                                           They then use a certain physical speed threshold to increa-
As multiple monitor usage has increased, several studies ha-            se the cursor speed, usually called acceleration, to move n
ve been performed to evaluate different aspects of the usa-             pixels per mouse movement.
bility of larger displays and multiple monitor displays. For
larger displays, such as projector-based displays, there have           In our dynamic cursor paradigm we propose to proportional-
been several studies that have shown better performance on              ly change the cursor’s speed by maintaining the cursor thres-
the larger display than a similar smaller counterpart, such as          hold and increasing the acceleration so that users can move
a desktop monitor. Such studies have shown an increase in               the cursor across the display at much faster rates. In other
memory [16, 27], spatial performance [25], 3D virtual navi-             words, by increasing the accelerated speed, with a marginal-
gation [26], and multi-tasking [23].                                    ly faster movement than normal the cursor goes much farther
                                                                        than it normally would. However, slow speed is still preser-
On multiple monitors there have also been several studies               ved for fine control. With the DSS cursor the acceleration
showing improvements in user performance. Such studies                  speed is set proportional to the size of the display.
include an increase in performance in multi-tasking [2, 9],
basic perception and navigation [3], and offset gender bias                             Threshold       Cursor Acce-    Cursor Size in
in performance [10, 24].                                                                                leration Rate   Pixels
                                                                         Control Cur-   10              1x              32x32
There have also been a few experiments and ideas that deal               sor
with bezels in tiled displays and overcoming their distortive            DSS Cursor     10              6x              400x400
side affects. Both Baudisch, et al. [4] and Mackinlay, et al.
[17] investigate different aspects of dealing with bezels.              Table 1. This table shows how the different mouse setting
                                                                        compare to each other.
As more studies show the usefulness of large displays, diffe-
rent interactive techniques have followed. A number of dif-
ferent types of techniques, from using less traditional input           In this paper we describe an experiment that compares two
techniques to different ways of interacting with the mouse              different cursor setting. Table 1 shows that if the user were
have been developed. Large displays and multiple monitor                using either cursor and were detected as physically moving
displays are inherently different from smaller displays.                the mouse slowly across the desk, below the given threshold
                                                                        of 10, then the operating system would move the cursor m
A large amount of research has been done on pen-based in-               pixels on the screen accordingly. Then, supposing the user
teraction. For example, Tivoli [22], Flatland [18], and Fluid           made a faster physical movement of the mouse on the desk,
Interaction [15] are all well-known examples. These techni-             with a speed above the given threshold of 10, then the ope-
ques have historically been used for white-board type inter-            rating system would move the control cursor 1*m pixels on
actions.                                                                the screen and the DSS cursor 6*m pixels on the screen.

Other well-known interaction techniques also exist, such as             Suppose that the normal acceleration of the cursor sends the
laster pointers (e.g. [19]) and head-tracking (e.g. [1] and [7]).       cursor from one side of a desktop monitor to the other by mo-
A range of techniques have also been created for facilitating           ving the mouse two inches on the desk when mouse move-
users in accessing objects physically far from them on lar-             ment is detected above the threshold. Our DSS cursor would
ge displays using various software techniques (e.g. [12], [5],          alter the acceleration of the cursor in such a way as to send
[14], and [21]).                                                        the cursor from one side of the display to the other with two
                                                                        inches of physical mouse movement regardless of the size
Mouse-based interactions have also been developed. Of par-              of the display. So, if the display had four, twelve, or one-
ticular note is the high-density cursor by Baudisch, et al. that        hundred times the number of pixels, the accelerated speed
focus on a greater visibility of the mouse cursor [6]. Benko,           component would be set appropriately.
et al. introduced the concept of cursor warping [7]. Cursor
warping is the act of instantly jumping (moving) the posi-              Although the cursor size is also based on individual ope-
tion of the cursor from one monitor to another. In this pa-             rating systems and user preference, it usually ranges from
per we explain our extended implementation of cursor war-               16x16 pixels to 32x32 pixels large. This means that if the
ping. Wallace, et al. created a multi-cursor X window mana-             display had a low density of pixels like a resolution of
ger at the systems level [28]. Their contributions differ from          640x480, then the same cursor would appear larger than if it
other cursor ideas in that they implemented their cursor at             had a higher pixel count like on a resolution of 1600x1200.
the desktop level instead of a single application.                      In general, the larger the display, the smaller the percent of
                                                                        space that the cursor takes up. As a result, the cursor beco-
                                                                        mes increasing more difficult to visually detect for higher
                                                                        pixel count displays.

                                                                    2
By increasing the size and speed of the cursor proportional- We networked the twelve computers together in a priva-
ly to the display we are able to overcome the problems of te network using a gigabit switch. We then installed DMX
cursor visibility and mouse rowing. By increasing the size (Distributed Multihead X) [11] to create a unified display.
of the cursor proportional to the size of the display, users are DMX is a proxy X server that provides multi-head support
able to quickly find the cursor’s position and reposition it ac- for multiple displays attached to different machines. For all
cordingly. For example, if the cursor takes up one percent of appearances to the user, when running DMX the display ap-
the display on a normal desktop monitor then the DSS cursor pears to be one single GNU/Linux desktop that runs standard
would still take up one percent of a larger display. windows manager (e.g. KDE, GNOME, Fluxbox, etc.).
For the purpose of this paper we had two research questions. We used all twenty-four tiled monitors to test the different
interactive techniques. We did not compare our technique
• How does the DSS cursor compare to the standard cursor? on smaller displays as the smaller the display, the closer the
DSS cursor would be to the standard cursor in both speed
• How does the DSS cursor compare to other known cursor and size.
interaction techniques, specifically cursor warping with a
keyboard? We created an OpenGL [20] application using glut [13] in
order to create a working prototype of our DSS cursor tech-
We chose cursor warping with a keyboard to compare nique. However, OpenGL does not work efficiently on clu-
against for three reasons. First, it is easy to implement into stered displays. As a result, we also used Chromium [8], an
modern operating systems without additional hardware than open-source library that uses real-time parallel rendering of
what already comes standard (i.e. mouse and keyboard). Se- OpenGL.
cond, we felt that the cursor warping with a keyboard tech-
nique might perform better than the standard cursor at gre-
at distances. Third, we wanted to compare against the best-
known technique from Benko, et al. [7], in which cursor war- Cursor Technique Implementation
ping (using a physical mouse) was shown to be the best tech- We implemented three different variations of the DSS cur-
nique. sor. We then compared our implementations to the standard
cursor and to cursor warping.
Our hypothesis was that the DSS cursor would do better than
the standard cursor and cursor warping on large displays. The first implementation of the DSS cursor was based on a
Also, we thought that cursor warping would perform better simple assumption that a bigger, high-speed cursor would
than the standard cursor, though not better than the DSS cur- always be more helpful on a larger display. We set the speed
sor. and size by manual calculations and trial and error of the
high-speed cursor to 6x the normal acceleration and a size
of 400x400 pixels.
IMPLEMENTATION
This section explains the hardware and software specificati- After developing the high-speed cursor, we found that ha-
ons used for the purpose of replication of the experiment. ving a larger cursor was an advantage to cursor visibility,
but introduced the problem of obscuring data. As a result,
we created another implementation of a dynamic speed and
Hardware and Software Specifications
sized cursor. We created a dual-speed and dual-sized cur-
The experimental hardware consisted of twenty-four seven- sor that could be either large and high speed or small and
teen inch LCD monitors (1280x1024 resolution each) and slow depending on user input called the manual cursor.
twelve computers running GNU/Linux for the purpose of By pressing either the right button of the mouse or by pres-
creating a large, high-resolution display. Each computer po- sing the space bar, users were able to toggle between a large
wered two monitors. We removed the plastic bezel of each and high-speed cursor mode and the normal size and normal
monitor to reduce the gap between monitors. We then set the speed cursor mode. The normal mode was the same size and
monitors on reconfigurable wooden stands in a 8x3 matrix speed as the control cursor. The faster mode was the same
(see figure 2). speed and size as the high-speed cursor (the first DSS cursor
implementation). We change the speed at real-time by using
the Xlib library and size using the OpenGL library.
For the purpose of our experiment, we ran a small formative
study to determine which toggle input would be better - the
right button on the mouse or the space bar. We found that
using the right button on the mouse was slower and confused
users more than the space bar on the keyboard. As a result,
we chose to test our manual cursor using the space bar. The
space bar was chosen over other keys based on the size of the
Figure 2. A picture of a participant performing the third space bar, making it easier for participants to not mistakenly
task of the experiment on the 8x3 monitor cluster. press a wrong key without having to look at the keyboard.
3After completing the implementation of the manual cursor Cursor Technique Summary
Control Standard cursor.
we postulated that people might both prefer and perform bet- High-Speed (DSS 1) Large cursor with a high accelera-
ter on a cursor that changed size and speed automatically. tion.
By sampling the mouse’s input every half second we auto- Manual (DSS 2) Either standard cursor setting or
matically changed the size and speed of the cursor based on large cursor with a high accelera-
physical speed. We shall hereafter refer to this cursor as the tion. User manually toggles bet-
ween the two cursors.
automatic cursor. Automatic (DSS 3) Either standard cursor setting or
large cursor with a high acce-
We also extended the cursor warping idea presented by Ben- leration. Algorithm automatically
ko, et al. [7], which we will call the Benko technique hereaf- toggles between the two cursors.
ter. Benko introduces the idea of warping one’s cursor from Benko (Cursor Warping) Cursor warps from monitor to mo-
nitor using arrow keys. Standard
monitor to monitor by pressing mouse buttons or a combina- cursor functionality within each
tion of keys on the keyboard. Cursor warping is the reposi- monitor. Extended from [7].
tion of one’s cursor to an adjacent monitor. By pressing one
button on the mouse, the cursor is warped to a monitor on Table 2. This table summarizes the different attributes of
the left and pressing another button the cursor is warped to each cursor technique.
the right. In the event that the user tries to warp the cursor
beyond the edge of the display the cursor wraps around to
the other side of the display as if the right and left edges of EXPERIMENT SETUP
the display were connected like a cylinder. We did not intro- The goal of this experiment is to show that a dynamic size
duce the idea of wrapping the display with the other cursor and speed cursor is better than other techniques, specifically
techniques in order to reduce experimental complexity. the standard cursor mouse warping. The independent varia-
bles are:
For the cursor warping technique each monitor is considered
its own dependent display where the cursor is not allowed to • Cursor type
go between bezels. For instance, if one were to try to click • Target size
an object that is on the same monitor as the cursor then one
would use the mouse normally. However, if one were to try • Target distance
to click an object on another monitor, one would have to • Task type (e.g. simple click, simple drag and drop, and
warp the cursor to that other monitor then use the mouse complex drag and drop)
regularly within that monitor.
• Participant gender
We extended Benko’s cursor warping idea from four (4x1)
monitors to twenty-four (8x3) monitors. We also extended Our dependent variable is:
the idea of cursor warping to include warping up and down
to monitors above or below the current monitor. As well as • Performance time (i.e. How long it took the participants
having the furthest left and right parts of the display connec- to click the targets and drag and drop the targets)
ted we also connected the top and bottom, creating a virtual
toroid. Also, we used frame-relative positioning as sugge- In the experiment there were 15 participants. The average
sted by Benko. For reference, frame-relative positioning is age of the participants was 24 years old with a range from
warping the mouse in the same relative position from one 20 to 30. None of the participants were color blind; all had
monitor to another. For example, if the cursor were at the normal or corrected normal vision; 8 were male; 7 were fe-
top left corner of a monitor then if the cursor were warped male.
to another monitor, the cursor would be located at the same
relative top left corner of the second monitor. After the experiment all participants filled out a general que-
stionnaire about their age, gender, the cursor technique they
Instead of using four different buttons on the mouse for na- preferred, and the cursor technique they felt was the easiest
vigating as well an additional button for clicking in the tasks to use. The participants were a mix of undergraduate and
we used the arrow keys on the keyboard. Besides alleviating graduate students from a mix of majors.
participants of the arduous task of quickly clicking between
a number mouse buttons while also using the left-click but- A repeated Latin Square design was used for counterbalan-
ton for tasks we found that participants were already familiar cing. Also, each participant was required to spend a mini-
with the keyboard’s arrow keys and needed little time to ad- mum amount of time practicing each technique before per-
apt to using them. forming the tasks for baselining purposes. A with-in subject
design was used to reduce variability between participants.
The last cursor used in the experiment was the control cur- Each participant performed three different isomorphic tasks
sor. We did not modify any setting to the standard cursor for for each of the five different interactive techniques. The tasks
this cursor. To see how the control cursor compares to the were all given in the same order for each technique.
high-speed cursor see table 1. To summarize the different
techniques see table 2. Participants used a wireless keyboard and wireless optical
three-button mouse. The reason for the wireless devices was
4due to the distance of the participants from the computing addition, we found that the same general pattern of perfor-
cluster, which was behind the display. mance as seen in figure 3 was repeated in all three tasks in-
dividually - see each task subsection.
Tasks
.
Three types of tasks were used in the experiment: simple
140
Average Total Performance (sec.)
click, simple drag and drop, and complex drag and drop. The
first two tasks were based on Fitt’s law. Fitt’s law roughly 120
states that for simple movements, movement time is a lo-
100
garithmic function of distance when target size is held con-
stant, and that movement time is also a logarithmic function 80
of target size when distance is held constant.
60
In the first task, the participants were presented a sequence 40
of twenty-four squares of three sizes, where only one square
was present on the display at a time. After each successful 20
click on a square another square would immediately appear 0
in another location on the display. Similarly, the second task High Manual Control Automatic Benko
involved dragging a sequence of twenty-four solid circles to Speed
their perspective outlines.
The third task involved higher order thinking than the first Figure 3. A chart showing the summary results of all
two tasks. Instead of clicking or dragging and dropping three tasks. The high-speed cursor (DSS 1) was signifi-
objects as quickly as possible, participants were presented cantly faster than the Benko technique.
with twenty-four solid shapes along with their corresponding
twenty-four outlines at once. Different shape/color combina- Although we had hypothesized that the DSS cursors would
tions were presented so that the participants could easily tell be faster than the control cursor and cursor warping we were
each shape from the others. Figure 2 shows a participant per- surprised by the results for several reasons. First, we did not
forming the third task. hypothesize that the control cursor would be overall faster
than cursor warping. Second, we had postulated that the ma-
All three tasks used three different sized shapes: small nual cursor or the automatic cursor would be faster than the
(16x16 pixels), medium (40x40 pixels), and large (150x150 high-speed cursor, but we were wrong.
pixels). Each shape was represented eight times in each task.
The small shape was the size of the minimize, maximize, and It appears that participants were able to adapt to the higher
close icons at the top of applications in Linux and Windows. speed of the high-speed cursor better than we had anticipa-
The medium-sized shape was the size of a standard icon on ted. Although most participants did not prefer the high-speed
a desktop. The large-sized shape was four times the size of cursor (see section ), in general, it outperformed all other
the medium-sized shape. The different sized shapes were in- techniques.
terspersed equally in the different tasks.
One possible explanation for the high-speed cursor perfor-
Each of the fifteen (three tasks X five cursor techniques) iso- ming faster than the manual cursor is that it took time for
morphic tasks was created prior to the experiment. All sha- participants to press the space bar. Second, there were ma-
pes for each of the tasks were positioned randomly on the ny times when participants would accidently toggle to the
display and then saved to a file. However, shapes that fell on wrong sized cursor and then quickly toggle back. Third, by
a bezel were nudged to one side. using two hands instead of one it is possible that participants
had a higher cognitive load with the manual cursor than the
All tasks were tracked automatically by the computer. After high-speed cursor. Fourth, participants had to adapt to two
each task was completely successfully the computer auto- different acceleration speeds and two different sizes with the
matically logged and time stamped the performance for each manual cursor where with the high-speed cursor they only
successful click or drag and drop. had to adjust their behavior to one acceleration speed and
one size.
QUANTITATIVE RESULTS
This section reports the different quantitative results found The most probable reason for the automatic cursor perfor-
from running the experiment. All statistical analysis was ming worse than the high-speed cursor and the manual cur-
performed using SAS Institute’s JMP application. Standard sor is an implementation issue. Participants felt comfortable
ANOVA analysis was performed. with the automatic cursor by the end of the practice session,
however, they often felt frustrated by it when it came time
For performance time, for all three tasks, we found a main to actually perform timed tasks. They often explained that it
effect of cursor technique (p = 0.006). Using Tukey’s HSD did not accurately predict what they wanted to do. We obser-
post-hoc test we found that specifically the high-speed cur- ved participants jiggling the physical mouse back and forth
sor outperformed Benko’s technique of cursor warping. In to toggle the size of the cursor.
5It is possible that the additional cognitive load of using two faster than women, regardless of what cursor technique was
hands was amplified in the cursor warping technique. Not used.
only did participants have to use two hands, but they also
had to use four different arrow keys to navigate. It appears Figure 5 shows the relationship of target distance to target
that the high-speed cursor was able to go greater distances size. The y axis represents the average performance time in
faster than the cursor warping technique even with display seconds for each square that was clicked. The x axis repres-
wrapping as an aide. ents distance separated into discrete buckets of 1000 pixels.
For example, bucket 0 represents all the squares that were
clicked from 0 pixels to 999 pixels in distance from the cur-
Clicking Task sor’s origin. This should not be interpreted as how far the
The first task involved clicking a sequence of twenty-four cursor actually traveled as this differed per participant, but
squares that appeared in random positions on the screen. the shortest distance between where the cursor started and
Analysis of the data showed a gender bias (p < 0.01), an the target. All other charts that show distance in this paper
interaction between distance to targets and size of the target use the same mapping scheme of distance buckets and can
(p < 0.0001), and an interaction effect between distance to be interpreted similarly.
targets and cursor technique used (p < 0.0001).
The longest distance possible for a cursor to start away
Figure 4 shows an interesting relationship between cursor from a target is the diagonal from one far corner of the dis-
technique and distance to target. Although in general the best play to another. In the case of a typical desktop monitor
performance was found in the high-speed cursor (see figure (1280x1024), using the equation (a2 + b2 = c2 ), the longest
3), that general trend was not always true at all distances. As distance possible is 1639 pixels, which falls into the second
the distance to target was small, such as the points in bucket bucket. However, for the display used for this experiment,
0 (less than 1000 pixels), the control cursor appears to out- the resolution was 10,220x3030, which means that the lon-
perform all other cursor techniques (p = 0.0012). However, gest distance from one far corner to another is 10,690 pixels,
as the distance increases, an interaction effect is seen that the which falls into the last bucket. However, as all targets we-
control cursor performs increasingly worse to finally have re prepossessed to random locations by a random generator,
the worse performance at the greatest distances. To illustrate the largest distance between origin of cursor and target for
the point, the difference in performance between the first to the display used was 9,336 pixels, and the shortest distance
last point for the control cursor is 2.80 seconds, where the was 322 pixels.
difference between the first to last point for the high-speed
cursor is 0.74 seconds. Figure 5 shows that the main cause for the interaction effect
of target size to target distance occurs at the last two points
Performing post-hoc analysis shows that all cursor techni- of each curve on the chart. A note to the reader: due to an em-
ques were statistically significant from each other except for pirical error, we were not able to reliably record distances of
the manual and control cursor. In other words, the high- greater than 9000 pixels for the clicking task and, therefore,
speed cursor was faster than all other techniques for the do not report them. We did not have the error for the simple
clicking task. drag and drop task.
5 4
Performance (sec.)
3.5
Performance (sec.)
4
control 3
3 auto 2.5 S
benko 2 M
2 manual 1.5 L
1 high speed 1
0.5
0 0
0 1 2 3 4 5 6 7 8 0 1 2 3 4 5 6 7 8
Distance (x 1000 pixels) Distance (x 1000 pixels)
Figure 4. Chart showing how each cursor technique va- Figure 5. Chart showing the relationship of distance to
ried in performance as the distance to target increased targets and target size for the clicking task. Performance
from left to right for the clicking task. Control cursor is time increases with distance to target.
fastest for short range targets, but is overtaken by other
techniques for long range targets. High-speed and manu- Simple Drag and Drop Task
al cursors are fastest for long range targets. The second task required the participants to perform a se-
quence of twenty-four simple drag and drop operations. Si-
With the gender bias we found that males performed 8% fa- milar to the first task, we automatically recorded every in-
ster than females, on average 3.1 seconds faster. In other stance where a participant successfully dragged a solid circle
words, for the task of clicking a sequence of objects, we to its respective outline, where only one solid/outline circle
found that men were able to click the twenty-four squares combination was shown at once.
6Upon analyzing the data, we found an interaction effect
between distance to target and gender of participant (p < 5
0.0001), an interaction effect between distance to target and
Performance (sec.)
size (p < 0.0001), and an interaction effect between distance 4
to target and cursor technique (p < 0.0001).
3 F
Figure 6 shows the same trend of performance that is seen in M
2
the clicking task. Specifically, there appears to be trendline
for each cursor technique. As the distance from where the 1
cursor starts to the target is slight (less than 1000 pixels), the
control cursor appears to have the best performance and the 0
high-speed cursor has the worst performance. However, as 0 1 2 3 4 5 6 7 8 9
the distance to the target increases the opposite is true. Distance (x 1000 pixels)
Figure 7. Chart showing the differences in performance
5
for the two genders as the distance to target increased
from left to right for the simple drag and drop task. In
Performance (sec.)
4
control general, men outperform women by 12%.
benko
3
auto
manual
2
high speed 5
Performance (sec.)
1
4
0 S
3
0 1 2 3 4 5 6 7 8 M
Distance (x 1000 pixels) L
2
1
Figure 6. Chart showing how each cursor technique va-
ried in performance as the distance to target increased 0
from left to right for the simple drag and drop task. 0 1 2 3 4 5 6 7 8 9
Distance (x 1000 pixels)
Once again, post-hoc analysis shows that the high-speed cur-
sor is statistically faster than all the other techniques (with
the exception of the manual cursor). Figure 8. Chart showing the relationship of distance to
targets and target size for the simple drag and drop task.
Males performed 12% faster on the drag and drop task than
females, on average 13.7 seconds faster. Looking at figure
7 one can see a consistent trend of males outperforming fe- ly been dragged to the correct outline, it did not disappear,
males. It appears that the reason for the interaction effect is but simply turned white to indicate a correct match to the
found at the last data point for each gender where the lines user. The white shapes were left on the screen intentionally
overlap at distances of greater than 9000 pixels in distan- as a form of distractor to increase the cognitive load on the
ce. Other than that one distance point, it appears that men user.
are consistently faster at dragging and dropping objects than
women, similar to the first task (clicking). In the third task we also found a main effect of cursor tech-
nique to performance time (p < 0.001). Figure 9 shows the
Figure 8 shows the comparison of distance to target and size. overall trend of performance time with the high-speed cur-
As the distance becomes greater the longer it takes to com- sor performing the fastest, followed by the control cursor,
plete the task. However, at the same distances, the smaller manual cursor, automatic cursor, and cursor warping. This
the target the longer it takes. Except for the first small and result is similar to the overall result (see figure 3) with the
medium data point, where it appears to be the reason for the exception that the control cursor performing slightly faster
interaction, there is a clear separation of curves for each tar- on average (2.1 seconds) than the manual cursor. Specifical-
get size, regardless of cursor technique used. ly, performing post-hoc analysis shows that all cursor tech-
niques were faster than the Benko technique.
Complex Drag and Drop
The third task differed from the first two tasks in two main Unlike the first two tasks, we did not find a gender bias for
ways. First, all the shapes were presented to the user at once, the third task (p = 0.71). One explanation for this result is
not in sequence. Second, when a solid shape had successful- that for the first two tasks (clicking and simple drag and
7The cursor warping technique was the second preferred and
200 the first easiest to use even though it was consistently the
180 slowest cursor technique. Participants that preferred it often
cited that they felt it was the fastest technique. However, loo-
160
king at individual performance, there was not a single case
Performance (sec.)
140 where cursor warping was faster than any other technique for
120 any task. Another reason that participants preferred the cur-
sor warping technique was the ability to wrap around from
100 one side of the display to another (i.e. move the cursor from
80 the right most to left most part of the display or from the top
60 most to the bottom most) in a single key stroke.
40 CONCLUSION
20 Although the high-speed cursor had the best overall perfor-
0 mance, the manual cursor was the most preferred technique
and whose performance was only slightly slower. It also ap-
al
ic
l
o
d
pears that the main reason why participants preferred cursor
ro
nk
ee
u
at
nt
an
m
be
sp
warping was due to display wrapping (virtual toroid), not
co
m
to
gh
au
due to warping.
hi
To summarize the results of our experiment we have include
Figure 9. Bar chart showing average performance time of the following list:
the different cursor techniques used in the complex drag
and drop task. • The high-speed cursor performed consistently 15% faster
than the control cursor and 35% faster than cursor war-
ping.
drop) little cognitive load was placed upon the participants
and one could say that we were measuring the reflexes of the • Participants felt that the manual cursor seemed more nn-
individuals. That said, it is possible that our results indicate aturalthan the high-speed cursor. In other words when the
that men are slightly faster with reaction times or fine motor manual cursor was large, they felt that it was intuitive that
skills. it should move quickly and when the manual cursor was
small, they felt that it was intuitive that it should move
PREFERENCE slowly.
The techniques most preferred and thought to be easiest to • Participants liked display wrapping (virtually connected
use by participants were the manual cursor and the cursor the side of the display). However, it is not clear if par-
warping. The following table shows the preference of the ticipants liked display wrapping due to it being novel or
participants listed by technique. whether it truly helped them perform faster.
Cursor Technique Technique Prefer- Easiest to Use • For clicking and simple drag and drop operations on large,
red high-resolution displays there appears to be a gender bias
Manual (DSS 2) 7 5 of men performing 8% and 12% better respectively for the
Cursor Warping 5 6 two tasks. However, there does not appear to be a gender
High-speed (DSS 1) 2 2
Automatic (DSS 2) 1 0 bias for the higher thinking task that required a degree of
Control 0 2 strategy.
Table 3. Table showing participant preference and ease In conclusion, when using a mouse as the input device for
of use for each technique. large, high-resolution displays, we suggest that the dynamic
size and speed cursor be used over the standard cursor set-
Although the high-speed cursor was found to be consistently tings or cursor warping. We would like to point out that the
faster on all tasks regardless of size of the target, participants increase in time from short distance to long distance targets
preferred the manual cursor and found it easier to use. took from about 1.5 seconds on small displays to about 3 se-
conds on large screens with the high-speed cursor. That is a
Even though the manual cursor had slightly lower perfor- 2x increase in performance time for a 24x increase in screen
mance time than the high-speed cursor, participants indica- size. In contrast, the control cursor went from about 1 second
ted that the different sizes of the cursor made them think to about 5 seconds for the same targets.
that they could control it better. Participants indicated that
when the cursor size was small that they felt that it was ea- FUTURE WORK
sier to use for small movements. Likewise, when the cursor The results of this paper have raised a number of issues.
was big, they felt that it was easier to move quickly. As one First, do the results of this paper transfer to different types
participant explained, Ït is natural for a big cursor to go fast of mice, like the gyro mouse (3 degree of freedom (DOF)
and a small cursor to go slow.” tracking mouse) and the trackball mouse?
8Second, would a better implementation of the automatic cur- 5. Patrick Baudisch, Edward Cutrell, Dan Robbins, Mary
sor increase user performance over the nave approach of Czerwinski, Peter Tandler, Benjamin Bederson, and
the high-speed cursor? We hypothesize that a smart cursor Alex Zierlinger. Drag-and-pop and drag-and-pick:
that changes the speed and size of the cursor dynamically techniques for accessing remote screen content on
would perform better than a simple bimodal cursor such as touch- and pen-operated systems. In Proceedings of
the high-speed and the control cursor. Interact ’03, pages 57 – 64, 2003.
Third, would the high-speed cursor continue to have the best 6. Patrick Baudisch, Edward Cutrell, and George
performance on more sophisticated tasks than the simple Robertson. High-density cursor: A visualization
ones in this experiment? We purposely chose simple tasks in technique that helps users keep track of fast-moving
this experiment. Generally speaking, if a new technique does mouse cursors. In Proceedings of Interact 2003, pages
poorly with simple tasks it will also do poorly in complica- 236 – 243, Zurich, Switzerland, 2003.
ted tasks. However, it is not necessarily true that a technique
that performs well in simple tasks will also perform well in 7. Hrvoje Benko and Steven Feiner. Multi-monitor mouse.
more complex tasks. In Extended Abstracts of CHI ’05, pages 1208 – 1211,
Portland, Oregon, April 2005.
Fourth, how do these, and similar techniques, compare when
8. Chromium. http://chromium.sourceforge.net/.
display wrap is introduced. Participants often cited the cur-
sor warping technique as their favorite, or the most easily 9. Mary Czerwinski, Greg Smith, Tim Regan, Brian
used, due to the wrap around effect. As cited earlier, the re- Meyers, George Robertson, and Gary Starkweather.
ason for not adding wrap around in this preliminary expe- Toward characterizing the productivity benefits of very
riment was to reduce complexity and, therefore, make the large displays. In Proceedings of Interact 2003, 2003.
results easier to understand.
10. Mary Czerwinski, Desney Tan, and George Robertson.
Fifth, we only looked at the time it took participants to suc- Women take a wider view. In Proceedings of CHI ’02,
ceed, not how many tries they made. Future work should in- pages 195–201, 2003.
clude studies on the accuracy of different cursor techniques.
11. Dmx (distributed multihead x).
ACKNOWLEDGEMENTS
http://dmx.sourceforge.net/.
This research is partially supported by the National Science 12. Jrg Geiler. Shuffle, throw or take it! working efficiently
Foundation grant #CNS- 04-23611. This study was also sup- with an interactive wall. In CHI ’98 conference
ported and monitored by the Advanced Research and Deve- summary on Human factors in computing systems,
lopment Activity (ARDA) and the Department of Defense. pages 265 – 266, 1998.
The views and conclusions contained in this document are
those of the author(s) and should not be interpreted as ne- 13. Glut - the opengl utility toolkit.
cessarily representing the official policies or endorsements, http://www.opengl.org/resources/libraries/glut.html.
either expressed or implied, of the National Geospatial-
Intelligence Agency or the U.S. Government. 14. Tovi Grossman and Ravin Balakrishnan. The bubble
cursor: Enhancing target acquisition by dynamic
resizing of the cursors activation area. In Proceedings
REFERENCES
of CHI ’05, pages 281 – 290, Portland, Oregon.
1. Mark Ashdown, Kenji Oka, and Yoichi Sato.
Combining head tracking and mouse input for a gui on 15. Franois Guimbretire, Maureen Stone, and Terry
multiple monitors. In Extended abstracts of CHI ’05, Winograd. Fluid interaction with high-resolution
pages 1180–1191, 2005. wall-size displays. In Proceedings of UIST 2001, pages
21–30. ACM, 2001.
2. Robert Ball and Chris North. An analysis of user
behavior on high-resolution tiled displays. In Interact 16. James Jeng-Weei Lin, Henry B.L. Duh, Donald E.
2005 Tenth IFIP TC13 International Conference on Parker, Habib Abi-Rached, and Thomas A. Furness.
Human-Computer Interaction, pages 350 – 363, 2005. Effects of view on presence enjoyment, memory, and
simulator sickness in a virtual environment. In
3. Robert Ball and Chris North. Effects of tiled Proceedings of IEEE Virtual Reality, 2002.
high-resolution display on basic visualization and
navigation tasks. In Extended abstracts of CHI ’05, 17. Jock D. Mackinlay and J. Heer. Wideband displays:
pages 1196–1199, 2005. Mitigating multiple monitor seams. In Proceedings of
CHI ’04, pages 1521 – 1524, Vienna, Austria, 2004.
4. Patrick Baudisch, Edward Cutrell, K. Hinckley, and
R. Gruen. Mouse ether: Accelerating the acquisition of 18. Elizabeth D. Mynatt, Takeo Igarashi, W. Keith
targets across multi-monitor displays. In Extended Edwards, and Anthony LaMarca. Flatland: New
Abstracts in CHI 2004, pages 1379 – 1382, Vienna dimensions in office whiteboards. In Proceedings of
Austria, April 2004. CHI ’99, pages 346–353, 1999.
919. Dan R. Olsen and Travis Nielsen. Laser pointer
interaction. In Proceedings of the SIGCHI conference
on Human factors in computing systems, pages 17 – 22,
2001.
20. Opengl. http://www.opengl.org.
21. J. Karen Parker, Regan L. Mandryk, Michael N. Nunes,
and Kori M. Inkpen. Tractorbeam selection aids:
Improving target acquisition for pointing input on
tabletop displays. In Maria Francesca Costablie and
Fabio Patern, editors, Proceedings of INTERACT 2005,
pages 80 – 93, 2005.
22. Elin R. Pedersen, Kim McCall, Thomas P. Moran, and
Frank G. Halasz. Tivoli: An electronic whiteboard for
informal workgroup meetings. In Proceedings of CHI
’93, pages 391–398, 1993.
23. Terry Simmons. What’s the optimum computer display
size? Ergonomics in Design, pages 19–25, Fall 2001.
24. Desney Tan, Mary Czerwinski, and George Robertson.
Women go with the (optical) flow. In Proceedings of
CHI ’03, pages 209–215, 2003.
25. Desney Tan, Darren Gergle, Peter G. Scupelli, and
Randy Pausch. With similar visual angles, larger
display improve spatial performance. In Proceedings of
CHI ’03, pages 217–224, April 2003.
26. Desney Tan, Darren Gergle, Peter G. Scupelli, and
Randy Pausch. Physically large displays improve path
integration in 3d virtual navigation tasks. In
Proceedings of CHI ’04, pages 439–446, April 2004.
27. Desney Tan, Jeanine K. Stefanucci, Dennis Proffitt, and
Randy Pausch. The infocockpit: providing location and
place to aid human memory. In Proceedings of PUI
’01, pages 1–4, 2001.
28. Grant Wallace, Peng Bi, Kai Li, and Otto Anshus. A
multi-cursor x window manager supporting control
room collaboration. Technical Report TR-707-04,
Princeton University, 2004.
10You can also read