Development of a Minimally Invasive Method to Assess Glycosaminoglycan Content for Early Diagnosis of Osteoarthritis
←
→
Page content transcription
If your browser does not render page correctly, please read the page content below
Development of a Minimally
              Invasive Method to Assess
            Glycosaminoglycan Content for
           Early Diagnosis of Osteoarthritis
                  The Harvard community has made this
               article openly available. Please share how
               this access benefits you. Your story matters

Citation              Croswell, Damari. 2020. Development of a Minimally Invasive
                      Method to Assess Glycosaminoglycan Content for Early Diagnosis of
                      Osteoarthritis. Doctoral dissertation, Harvard Medical School.

Citable link          https://nrs.harvard.edu/URN-3:HUL.INSTREPOS:37364984

Terms of Use          This article was downloaded from Harvard University’s DASH
                      repository, and is made available under the terms and conditions
                      applicable to Other Posted Material, as set forth at http://
                      nrs.harvard.edu/urn-3:HUL.InstRepos:dash.current.terms-of-
                      use#LAA
1 Date: 1 March, 2020 Name: Damari Croswell Title: Development of a Minimally Invasive Method to Assess Glycosaminoglycan Content for Early Diagnosis of Osteoarthritis Mentor: Brian D. Snyder, M.D., Ph. D., Department of Orthopedic Surgery, Boston Children’s Hospital, Beth Israel Deaconess Medical Center Collaborators: Taylor Lawson, Ph.D. Candidate, Boston University
2

Title: Development of a Minimally Invasive Method to Assess Glycosaminoglycan
Content for Early Diagnosis of Osteoarthritis

Damari Croswell, Taylor Lawson, Mark Grinstaff, Brian Snyder

Purpose: Osteoarthritis (OA) is a painful degenerative joint disease that affects over 30
million people worldwide. By the time patients present with either clinical or radiographic
signs of OA, they typically have advanced disease. It has been shown that the depletion
of glycosaminoglycans (GAG) within articular cartilage is key to the pathogenesis of OA
and begins long before patients experience symptoms. The purpose of this project is to
develop a minimally invasive method of assessing the GAG content of cartilage that can
eventually be used as a screening tool for patients at risk of developing OA.

Methods: Several phantom compounds that are biomimetic are articular cartilage were
created to simulate a range of GAG concentrations that are analogous to the
concentrations found in diseased and healthy joints. The phantoms were exposed to a
positively charged, iodinated contrast agent (CA4+) for varying time intervals and
assessed using Contrast-Enhanced Computed Tomography (CECT). CT attenuation
values (in HU) were expected to correlate to a specific GAG concentration in each
phantom. Phantom compounds made from Tisseel (a synthetic fibrin matrix), synthetic
collagen and chondroitin sulfate (PureCol-C4S), and synthetic collagen and bovine
cartilage (PureCol-BC) were assessed with CECT at GAG percent by weight of 2.5%,
5%, 7.5%, and 10%, after exposure to contrast for 1 hour, 4 hours, and 20 hours.

Results: Tisseel-based phantoms demonstrated qualitatively increased uptake of
contrast with increased percent-by-weight GAG, but showed gross matrix degradation
hours after exposure to contrast, limiting study capability. PureCol-C4S phantoms at
equilibrium (20 hours) showed the following CT attenuations (in HU) by weight of GAG;
Control: 1096, 2.5%: 8796, 5%: 10298, 7.5%: 5481, 10%: 11837. PureCol-BC
phantoms at equilibrium showed the following CT attenuations (in HU); Control:
1082.25, Low GAG: 1633.14, Medium GAG: 1535.57, High GAG: 1916.29 (R2=0.803).

Conclusions: A phantom biomimetic to articular cartilage demonstrates qualitatively
increased CECT attenuation when exposed to CA4+ with increasing GAG content. A
more stable phantom and larger sample size is necessary to establish an appropriate
quantitative relationship.
3

Introduction:

       Osteoarthritis (OA) is a highly prevalent and painful condition that affects more
than 30 million people8. Although it typically affects weight bearing joints such as the
knee and hip, the incidence of osteoarthritis in non-weight bearing joints continues to
rise. In 2013, OA was found to be a major contributor to the cost of hospitalizations in
the United States, representing $16.5 billion, or 4.3% of combined hospitalization
cost7,8. It is a chronic condition caused by loss of hyaline cartilage lining several joints
throughout the body. Loss of the components of hyaline cartilage weakens the ability of
joints to withstand shear and compressive forces, thereby limiting their function. At
advanced stages, OA leads to significant pain and reduced joint function that can only
definitively be managed surgically, and is otherwise treated symptomatically.
       Diagnosis of OA is typically made clinically and radiographically. Clinical findings
associated with OA include pain, crepitus, tenderness, and possible swelling.
Radiographic findings include joint-space narrowing, osteophytes, and subchondral
sclerosis. Several invasive methods and associated scoring systems for diagnosing
osteoarthritis exist, including the histopathologic OARSI and Mankin scores. Since
these are histopathological grading systems, they require extraction and processing of
cartilage tissue, which is not feasible clinically5.
       The biochemical structure of articular cartilage is intimately related to arthritis
pathophysiology. Articular cartilage is predominantly composed of water,
glycosaminoglycan (GAG), and collagen. Water typically composes 65-80% by weight,
collagen roughly 20-25%, and GAG 5-10% by weight3,5. GAGs are glycoproteins that
carry multiple negatively-charged sulfate and carboxyl groups. These negative charges
attract water, and the interaction between GAG and water is responsible for providing
the lubricative and compressive features of cartilage. It has been established that the
cartilage integrity is integrally linked with and stabilized by extracellular GAG content5.
The anionic properties of GAGs also allow them to bind to cationic substances, such as
cationic contrast dyes or synthetic polymers3,4. This provides opportunities for both the
development of imaging techniques to quantify the severity of pathology, as well as
novel therapeutics for early stage osteoarthritis.
4
When the previously mentioned radiographic and clinical signs are present,
patients typically have already developed advanced disease. Since GAG loss is directly
proportional to the severity of OA, the ability to assess GAG content through minimally
invasive methods is critical to early diagnosis. Early diagnosis of OA allows patients to
change certain modifiable risk factors, for disease progression, such as level of activity,
diet, and exercise. It also allows for the development of novel, disease-modifying
therapeutics to minimize GAG loss, which may preferred over the current mainstays,
which include symptomatic management or surgery for severe disease.
Student Role:
In this project, I worked to develop phantom structures that resemble to
biochemical components of articular cartilage. These phantoms are meant to represent
a range of GAG concentrations in healthy and diseased cartilage. I was responsible for
creating and implementing a plan for: (1) determining the structural components of each
phantom, (2) producing each phantom in lab, (3) performing Contrast-Enhanced
Computed Tomography (CECT) scanning on each phantom, (4) performing CT
attenuation analysis of each phantom. I was also responsible for attending and
presenting at lab meetings, occurring once each month.
Materials and Methods:
Each phantom consisted of a matrix (meant to resemble collagen), water, and a
GAG source. The first phantom involved the use of Tisseel – a synthetic fibrin sealant –
as a matrix and chondroitin-4-sulfate as a GAG source. Tisseel is formulated into two
liquid components, which include a fibrinogen and a thrombin component. When
combined, the components form a solid, but elastic clot. The chondroitin-4-sulfate
powder was dissolved in water, and the subsequent solution was mixed with the
fibrinogen component of Tisseel. Finally, the fibrinogen solution was mixed with the
thrombin component to produce the composite structure. In order to simulate the range
of physiologic and pathophysiologic GAG content, phantoms of 2.5% and 10% by
weight were created. A negative control phantom, including only matrix and water
without GAG was also studied. These phantoms were then exposed to 0.1 mL of 4005
mOsm CA4+ contrast, which was allowed to diffuse through the phantom for various
time points (1 hour, 4 hours, 20 hours) to establish a diffusion equilibrium. These
phantoms were then scanned using CECT at 36-micron resolution and 700 kVp power.
The resultant images were analyzed for their CT attenuation, which was converted into
standardized Hounsfield Units (HU).
The second phantom created included the synthetic collagen matrix, PureCol EZ
gel. This is a Type I Bovine collagen gel in Dulbecco’s Modified Eagle’s Media ranging
300-360 mOsm and pH 6.9-7.41. In its normal formulation, PureCol is a viscous liquid,
and the GAG source for this matrix again was chondroitin-4-sulfate powder. The
chondroitin-4-sulfate was again dissolved in water, mixed with the PureCol collagen
liquid, and vortexed for several minutes. When appearing grossly homogenously
distributed in the gel, the phantom was incubated at 40 degrees Celsius. This caused
the solution to solidify into a stable gel, maintaining the dissolved GAG in its place. Two
“copies” of GAG phantoms composed of control (0%), 2.5%, 5%, 7.5%, and 10% by
weight were produced. Each copy was exposed to either 400 mOsm (hyperosmolar)
CA4+ or 225 mOsm (hyposmolar) CA4+ contrast for varying time points (1 hour, 4
hours, 20 hours). The contrast was allowed to passively diffuse in a rotating incubator
set at 125 RPM, 25 degrees Celsius. After the specified duration, remaining CA4+ on
the top of the gel was removed, leaving only the gel that dissolved in solution. The
phantom was then scanned using CECT at the aforementioned settings (36 micron, 700
kVp).
A third phantom was created in a similar fashion as the second, using PureCol
gel as a matrix. However, the GAG source was purified GAG from degraded bovine
cartilage explants. Bovine cartilage plugs cored from femoral condyles were exposed to
degradative Papain, a type of collagenase, degrading the protein backbone and
allowing GAG to be suspended in solution. The resultant solution was tested using a
DMMB assay to determine the amount of GAG present. It was then mixed with PureCol
and incubated at 40 degrees Celsius to form the solid gel. Four GAG phantoms were
made: Control (no GAG), 0.0082 mg/mg (Low GAG), 0.0164 mg/mg (Medium GAG),
and 0.0328 mg/mg (High GAG). CA4+ was allowed to diffuse as prior, and excess
CA4+ was removed at 20 hours only, as diffusion equilibrium was expected to be6
reached at this time. The resultant phantoms were scanned using CECT at the
aforementioned settings (36 micron, 700 kVp). After scanning, phantoms were used for
a repeat DMMB assay as an internal check to reassess GAG content.
Results:
The Tisseel phantoms qualitatively demonstrated increased uptake of contrast
increasing percentage by weight of GAG. A diffusion study demonstrated that after one
hour, contrast uptake by the phantom had reached an equilibrium, which was noticeably
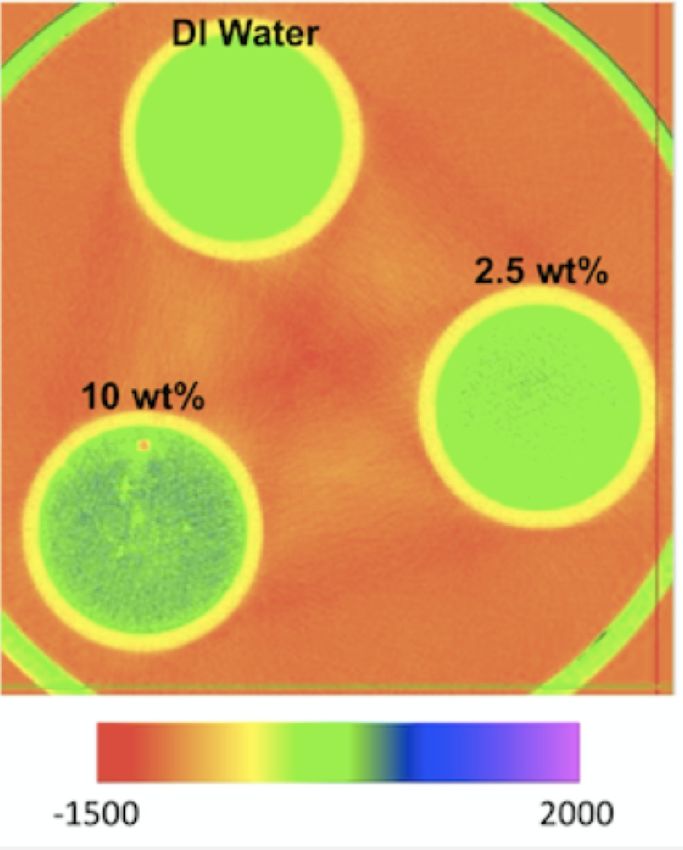
increased compared to the control phantom. Axial color maps demonstrate that GAG
was homogenously distributed (Figure 1), but importantly, Tisseel phantoms grossly
showed matrix degradation in the presence of contrast. When initially formed, the
phantoms were solid, elastic, and white. Within 6 hours of exposure to contrast,
phantoms had degraded into a tan-colored solution with small remaining solid
components and a superficial white film.
The PureCol – C4S phantoms exposed to 400 mOsm CA4+ demonstrated
unpredictable values at 1 hour and 4 hours exposure to CA4+ (Figure 2). At 20 hours
(expected equilibrium), attenuation values were in expected proportional relationships
with the exception of the fact that the 7.5% by weight samples showed lower attenuation
than both the 2.5% and 5% by weight samples. Importantly, many of these quantitative
values were extremely high (4000 HU – 12,000 HU) compared to the expectations
(1000 HU – 2000 HU). The PureCol – C4S phantoms exposed to 225 mOsm CA4+ also
demonstrated unpredictable values at each time point (Figure 3), and it was observed
that the collagen matrix had degraded as well, appearing similar to the degraded
Tisseel phantoms.
The PureCol – BC phantoms generally demonstrated a proportional relationship
between CT attenuation and increasing GAG concentration (Figure 4) at 20 hours,
excluding the Medium GAG phantom, which was similar in attenuation to the Low GAG
phantom. Attenuation values were in the expected range (1000 HU – 2000HU). Notably,
the repeat DMMB assay produced unexpected estimates of GAG in the phantoms that
appeared to not correlate with the initial measured values.7
Discussion:
Each phantom presented a specific chemical challenge that I attempted to
address in the following phantom. The Tisseel phantoms qualitatively demonstrated the
expected proportional relationship between increasing GAG and increasing uptake of
contrast. Importantly, Tisseel phantoms were unstable when exposed to CA4+. Within
hours, the phantoms began to degrade from a solid state to a partially liquid state,
limiting our ability to reliably study the distribution of GAG and contrast due to the
structural inconsistency. The likely reason for this is due to the features of Tisseel itself,
which relies on terminal stages of the en vitro clotting cascade. Activated thrombin
cleaves and activates the zymogen fibrinogen, forming fibrin. Fibrin forms stable clots,
but it is further stabilized and solidified by Factor XIII. On literature review, I discovered
that iodinated contrast agents, such as CA4+, inhibit Factor XIII2, possibly explaining the
rapid instability of these phantoms.
PureCol – C4S phantoms remained as stable solids after exposure to contrast,
but revealed interesting gross features. When the clear CA4+ contrast was added to the
top of the solid gel, rather than layering atop the gel as a clear solution, it instantly
became white and foamy. In some samples, the white layer became increasingly clear
several hours later. I suspected this to be due to the strong electrostatic interaction
between the negatively charged GAG and the heavily positively charged contrast,
possibly forming a salt suspension. Scans were completed as planned as it was unclear
how or if this would affect the expected relationships among samples.
Peculiar results were, however, witnessed at each time point. For the phantoms
exposed to 400 mOsm contrast I believe that the initial drop in attenuation from 1 hour
to 4 hours was due to diffusion and equalization of the contrast across the entire
phantom, which occupied a 1.5mL Eppendorf tube. As more contrast diffused in after 4
hours, the overall attenuation would be expected to increase as equilibrium was
reached. While equilibrium was reached fairly quickly in the Tisseel phantoms, it was
expected that it would take longer for PureCol phantoms since Tisseel is a porous solid,
while PureCol is a compact gel. Questionably, the attenuations at 20 hours showed an
odd relationship where the attenuation for the 7.5% GAG sample was less than both the8
5% and 2.5% samples. Similar relationships were seen with the phantoms exposed to
225 mOsm contrast. We agreed that the initial white suspension may have, in fact,
represented a strong GAG-contrast attraction the pulled the small chondroitin molecules
out of the superficial layers of the phantom into the contrast layer above the phantom.
When I extracted the contrast layer after the specified time points, I likely also extracted
some degree of GAG, which may have been heterogeneously distributed, potentially
causing unanticipated relationships among different phantoms.
I believed that the GAG-contrast interaction could be mitigated if a larger GAG
was used rather than chondroitin-4-sulfate, which is one of the smallest. A larger GAG
would be more difficult to draw out of the pores of the matrix, favoring a more stable
structure and the movement of contrast inward due its electrostatic attraction. We
discussed degrading cartilage explants with Papain, a type of collagenase. This
essentially uses naturally occurring GAG, which appears in the form of the large
molecule, aggrecan, a collection of several types of GAG attached to a protein core
resembling leaves on a tree. This required the additional step of performing a DMMB
assay to estimate the GAG content from each explant, in order to know which phantoms
had more or less GAG.
The PureCol-BC phantoms showed a good relationship with the control phantom
having the lowest attenuation and the High GAG phantom, the highest attenuation.
Notably, attenuation of the Medium GAG phantom was slightly higher than that of the
Low GAG phantom – this was believed to be within the range of error, and likely would
have been improved with a larger sample size for each GAG concentration. Importantly,
I performed a repeat DMMB assay, which showed inconsistent measurements of GAG
that were significantly greater than the initial measurements, likely representing user
error. On repeating the experiment with the same measurements of GAG, we again
observed unexpected CT attenuations, this time in an inverse relationship to GAG
content. This prompted us to explore other avenues to develop acceptable phantoms.
These experiments carry several limitations. The key limitation is that, as a proof
of concept experiment, sample size is very small. The small sample size brings
supportive data into question and forced us to rely more on qualitative relationships
rather than distinct quantitative values. Additionally, the third group of phantoms9
addressed initial critical issues involving structural stability, but yielded inconsistent
attenuations. This opened an avenue for future direction with the experiment, in which
we decided to avoid using synthetic matrices. It was suggested that using actual
cartilage explants with known amounts of GAG would solve both structural instability
challenges, as well as give more precise CT attenuations as the GAG present would be
distributed in physiologic proportions and locations. These experiments are currently
ongoing.
Acknowledgements:
I would like to express my deepest thank you to Dr. Brian Snyder for welcoming
me in his research group to pursue this project and acting as a mentor for me as I enter
orthopedics. I would also like to thank Beth Israel Deaconness Medical Center for
funding my participation in this group. Likewise, I would like to thank Dr. Mark Grinstaff
for including me in his lab as a collaborator, and Boston University for welcoming me as
a Visiting Scholar. Without the guidance of Drs. Snyder and Grinstaff, this project would
not have been possible.
I further thank Harvard Medical School and the Scholars and Medicine office both
for funding my participation in the project, as well as assisting me finding the support I
needed to enter orthopedic research.10
Figures
Figure 1. Qualitative axial color map showing areas
of increased CECT attenuation in water and two
Tisseel-based phantoms: 2.5% and 10% by weight
GAG. Water carries CECT attenuation of 0 HU
(green). Higher GAG content show increased
qualitative CECT attenuation (blue).
Mean CT Attenuation (in HU)11 Figure 2. Plot of CT attenuation over time for control and four GAG phantoms that were exposed to 400mOsm CA4+. At 20 hours, diffusion of contrast was thought to have reached a steady-state. Figure 3. Plot of CT attenuation over time for control and four GAG phantoms that were exposed to 225mOsm CA4+. At 20 hours, diffusion of contrast was thought to have reached a steady-state.
12

                     Figure 4.
                     Plot of CT attenuation vs GAG content at steady state (20 hours)
                     for control phantom and low, medium, and high dose GAG
                     phantoms.

                     Figure 5. Plot of CT attenuation vs GAG content at steady state (20
                     hours) for control phantom and four GAG phantoms that were exposed to
                     400mOsm CA4+. At 20 hours, diffusion of contrast was thought to have
                     reached a steady-state. The graph demonstrates a weak positive
                     correlation between increasing CT attenuation and increasing GAG
                     content.

                                    Mean CECT with 400 mOsm CA4+
                                     by GAG Content (at 20 hours)
Mean CECT Attenuation (in HU)

                                14000
                                12000                                       R² = 0.44961
                                10000
                                8000
                                6000
                                4000
                                2000
                                   0
                                        Control (no     2.5          5         7.5           10
                                          GAG)
                                                      GAG Content (percent by weight)

References:
13 1. Advanced, Biomatrix. “Product Description.” Advanced BioMatrix - PureCol® EZ Gel, Solution, 5 Mg/Ml (Bovine) #5074, advancedbiomatrix.com/purecol- ezgel.html. 2. Barry EL, Mosher DF. Factor XIII cross-linking of fibronectin at cellular matrix assembly sites. J Biol Chem. 1988;263(21):10464–10469. 3. Cooper, B., Lawson, T., Snyder, B. and Grinstaff, M. (2017). Reinforcement of articular cartilage with a tissue-interpenetrating polymer network reduces friction and modulates interstitial fluid load support. Osteoarthritis and Cartilage, [online] 25(7), pp.1143-1149. Available at: https://linkinghub.elsevier.com/retrieve/pii/S1063-4584(17)30888-9 [Accessed 24 Jun. 2018]. 4. Mäkelä, J., Cooper, B., Korhonen, R., Grinstaff, M. and Snyder, B. (2018). Functional effects of an interpenetrating polymer network on articular cartilage mechanical properties. Osteoarthritis and Cartilage, [online] 26(3), pp.414-421. Available at: https://linkinghub.elsevier.com/retrieve/pii/S1063-4584(18)30002-5 [Accessed 24 Feb. 2020] 5. Mankin HJ, Lippiello L. The glycosaminoglycans of normal and arthritic cartilage. J Clin Invest. 1971;50(8):1712–1719. doi:10.1172/JCI106660 6. Torio CM, Moore BJ. Statistical Brief #204. National Inpatient Hospital Costs: The Most Expensive Conditions by Payer, 2013. Rockville, MD: Agency for Healthcare Research and Quality; 2016 7. United States Bone and Joint Initiative: The Burden of Musculoskeletal Diseases in the United States (BMUS), Fourth Edition. Rosemont, IL. Available at http://www.boneandjointburden.orgexternal icon. Accessed on February 25, 2020
You can also read