Diabetes - DIABETES - CDC
←
→
Page content transcription
If your browser does not render page correctly, please read the page content below

DIABETES

Diabetes   2019 Report Card

Purpose of This Report
This report is required under the Catalyst to Better Diabetes Care Act of 2009 (Section 10407 of Public Law 111-148).
This act calls for a diabetes report card that includes information and data about diabetes, prediabetes, preventive
care practices, risk factors, quality of care, diabetes outcomes, and, to the extent possible, trend and state data.

For More Information
Division of Diabetes Translation
National Center for Chronic Disease Prevention and Health Promotion
Centers for Disease Control and Prevention
4770 Buford Hwy, Mailstop S107-3
Atlanta, GA 30341-3717
1-800-CDC-INFO (232-4636); TTY: 1-888-232-6348
Contact CDC-INFO
This publication is available online at
www.cdc.gov/diabetes/library/reports/congress.html

Suggested Citation
Centers for Disease Control and Prevention. Diabetes Report Card 2019. Atlanta, GA: Centers for Disease Control and
Prevention, US Dept of Health and Human Services; 2020.

   Contents
   Introduction                                                      1
   National and State Diabetes Trends                                3
   Diabetes Self-Management Education and Support                    9
   Prediabetes                                                      10
   Diabetes in Youth                                                12
   Prediabetes in Youth                                             14
   Preventive Care Practices                                        15
   National Diabetes Prevention Program                             18
   Diabetes Resources                                               20
   Technical Notes And References                                   22
   Appendix: Accessible Explanations of Figures                     24

INTRODUCTION

Background                                                     Diabetes Overview
The Diabetes Report Card provides current information          Diabetes is a group of diseases characterized by high
on the status of diabetes and its complications in the         blood sugar. When a person has diabetes, the body
United States. It has been published every 2 years             either does not make enough insulin (type 1) or is
since 2012 by the Centers for Disease Control and              unable to properly use insulin (type 2). When the
Prevention (CDC).                                              body does not have enough insulin or cannot use
                                                               it properly, blood sugar (glucose) builds up in the
This publication includes information and data on              blood. Prediabetes is a condition in which blood sugar
diabetes, preventive care practices, health outcomes,          is higher than normal but not high enough to be
and risk factors such as race, ethnicity, level of             classified as diabetes.
education, and prediabetes. It also includes information
about national trends and, to the extent possible,             People with diabetes can develop high blood pressure,
progress made by the states to meet national goals for         high cholesterol, and high triglycerides (a type of
improving diabetes care and reducing health care costs         fat in the blood). High blood sugar, particularly
and the rate of new cases.                                     when combined with high blood pressure and
                                                               high triglycerides, can lead to heart disease, stroke,
Public health professionals, policy makers, state health       blindness, kidney failure, amputations of the legs and
departments, and communities can use these data to             feet, and even early death.
focus their type 2 diabetes prevention and diabetes
management efforts on areas of greatest need.1,2

   What’s New?
        In the past decade, the annual rate of new cases of diabetes among US adults has been going down overall.
        Diabetes-related complications have increased among young adults aged 18–44 years and among middle-
        aged adults aged 45–64 years.
        The rate of new cases of diabetes among children and adolescents continues to grow.
        Nearly 1 in 5 adolescents aged 12–18 years and 1 in 4 young adults aged 19–34 years have prediabetes.

                                                           1
INTRODUCTION

Diabetes is also associated with increased risk of certain       For people with diabetes, research6–10 shows that:
types of cancer, such as liver, pancreas, uterine, colon,
breast, and bladder cancer.3 High blood sugar also                    Blood sugar management can reduce the risk of eye
increases a person’s chance of developing dementia                    disease, kidney disease, and nerve disease by 40%.
and Alzheimer’s disease.4 In addition, the average                    Blood pressure management can reduce the risk of
medical costs for people with diagnosed diabetes                      heart disease and stroke by 33% to 50% and decline
are 2.3 times higher than costs for people without                    in kidney function by 30% to 70%.
diabetes.5 These higher costs are often caused by                     Cholesterol management can reduce cardiovascular
diabetes-related health conditions and resulting                      complications by 20% to 50%.
hospitalizations.
                                                                      Regular eye exams and timely treatment could
People with diabetes, their caregivers and health care                prevent up to 90% of diabetes-related blindness.
providers, departments of health, policy makers, and                  Regular foot exams and patient education could
community organizations can help to reduce the risk of                prevent up to 85% of diabetes-related amputations.
serious diabetes-related complications.

                                                             2
NATIONAL AND STATE DIABETES TRENDS

Diabetes Incidence and Prevalence
Diabetes is the seventh leading cause of death in                       type 2 combined) in the United States decreased
the United States. Adults aged 50 years or older with                   from 2008 to 2017.13 Diabetes incidence is the rate
diabetes die 4.6 years earlier, develop disability 6 to 7               of new cases of diagnosed diabetes. About 1.5 million
years earlier, and spend about 1 to 2 more years in a                   new cases of diabetes (6.9 per 1,000 persons) were
disabled state than adults without diabetes.11                          diagnosed among US adults aged 18 years or older
                                                                        in 2018.
About 34.2 million people—or 10.5% of the US
population—had diabetes (diagnosed or undiagnosed)                      Figure 1 shows diabetes incidence trends during 2000–
in 2018. This total included 34.1 million adults aged 18                2018, with a declining curve after 2009. The decrease in
years or older, or 13% of all US adults. About 7.3 million              diabetes incidence may be due to multiple factors that
of these adults had diabetes but were not aware that                    cannot be determined by current data. Compared to
they had the disease or did not report that they had it.12              adults aged 18–44 years, incidence rates of diagnosed
                                                                        diabetes are estimated to be higher among adults aged
After almost two decades of continual increases, the                    45–64 years and among those aged 65 years or older.12
incidence of diagnosed cases of diabetes (type 1 and

Figure 1. Trends in Incidence of Diagnosed Diabetes Among Adults Aged 18 Years or Older, United
States, 2000–2018

                               10
                               9
      Rate per 1,000 Persons

                               8
                               7
                               6
                               5
                               4
                               3
                               2
                               1
                               0
                                        0

                                       04

                                       06

                                       08

                                       09
                                       05
                                       03
                                       02

                                       07
                                       01

                                       10

                                       16

                                       18
                                       14
                                       15
                                       13
                                       12

                                       17
                                       11
                                  0

                                    20

                                    20
                                    20

                                    20
                                    20
                                    20

                                    20

                                    20
                                    20
                                    20
                                    20

                                    20
                                    20

                                    20

                                    20

                                    20
                                    20

                                    20
                               20

                                                            Time Period

Notes: Rates are age-adjusted to the 2000 US standard population. Figure adapted from CDC’s National Diabetes Statistics Report 2020.
Data sources: CDC’s United States Diabetes Surveillance System and National Health Interview Survey.

                                                                    3
NATIONAL AND STATE DIABETES TRENDS

Diabetes prevalence is the total number of existing                   and ethnic groups, education levels, and both sexes.12
cases, including new cases. The prevalence of total and               The increase in diabetes prevalence may be due in
diagnosed diabetes among US adults aged 18 years or                   part to people living longer with diabetes because of
older steadily increased from 1999 to 2016 (Figure 2).                improvements in self-management practices, lifestyle
Similar trends were seen across all age groups, racial                change interventions, and health care services.

Figure 2. Trends in Prevalence of Diagnosed Diabetes, Undiagnosed Diabetes, and Total Diabetes
Among Adults Aged 18 Years or Older, United States, 1999–2016

                      14

                                                                                  Total Diabetes
                      12

                      10
                                                                               Diagnosed Diabetes
         Percentage

                      8

                      6

                      4                                                      Undiagnosed Diabetes

                      2

                      0
                                                                   6
                                                                   4
                                  0

                                                                   8

                                                                   0
                                            02

                                                                                                 6
                                                                                                 4
                                                                                                 2
                                                                 01
                                                                00
                                                         00
                                  0

                                                                00

                                                                                               01
                                                                                               01
                                                                                              01
                               20

                                             0

                                                              –2

                                                                                            –2
                                                                                            –2
                                                              –2
                                                       –2
                                           –2

                                                                                            –2
                                                             –2
                             9–

                                                           09
                                         01

                                                           07

                                                                                          11

                                                                                         13

                                                                                         15
                                                    03

                                                           05
                              9

                                                                                       20

                                                                                       20

                                                                                       20
                                      20

                                                        20
                                                        20
                                                 20

                                                        20
                           19

                                                              Time Period

Notes: Percentages are age-adjusted to the 2000 US standard population. Diagnosed diabetes was based on self-report. Undiagnosed
diabetes was based on fasting plasma glucose and A1C levels among people self-reporting no diabetes. Figure adapted from CDC’s
National Diabetes Statistics Report 2020.
Data source: CDC’s National Health and Nutrition Examination Surveys,1999–2016.

                                                                  4
NATIONAL AND STATE DIABETES TRENDS

Race, Ethnicity, and Education
Members of some racial and ethnic minority groups             Differences in diabetes prevalence are seen in the
are more likely to have diagnosed diabetes than non-          overall US population and within racial and ethnic
Hispanic whites. American Indian or Alaska Native             groups according to socioeconomic position, which
adults have the highest rates of diagnosed diabetes           is defined by level of education attained and the
(14.7%) among all US racial and ethnic groups, followed       income-to-poverty ratio. For example, the prevalence
by Hispanics (12.5%) and non-Hispanic blacks (11.7%)          of diabetes has increased among non-Hispanic whites
(Figure 3).                                                   with less education and lower incomes and among
                                                              Hispanics with less education (Figure 4).15
In addition, the percentage of adults living with
diagnosed or undiagnosed diabetes varied significantly        An association has also been observed between
by racial and ethnic group and among subgroups of             lower education levels and less use of preventive
Hispanics and non-Hispanic Asians. Mexican (14.4%)            care practices, such as annual foot and eye exams,
and Puerto Rican (12.4%) subgroups had the highest            regular laboratory testing of blood sugar levels (using
prevalence of diabetes among adults of Hispanic               the hemoglobin A1C test), and diabetes self-care
origin. Among non-Hispanic Asians, the highest                education.16
prevalence was among Asian Indian (12.6%) and
Filipino (10.4%) populations.14

                                                          5
NATIONAL AND STATE DIABETES TRENDS

Figure 3. Percentage of Adults Aged 18 Years or Older With Diagnosed Diabetes, by Racial or Ethnic
Group, United States, 2017–2018

          American Indian or Alaska Native                                                                   14.7%

                                             Asian                                       9.2%

                                        Hispanic                                                     12.5%

                          Black, non-Hispanic                                                    11.7%

                          White, non-Hispanic                                     7.5%

                                                     0                 5               10                 15                 20
                                                                                 Percentage

Notes: Percentages are age-adjusted to the 2000 US standard population. Figure adapted from CDC’s National Diabetes Statistics Report 2020.
Data sources: CDC’s National Health Interview Survey, 2017–2018, and the Indian Health Service National Data Warehouse, 2017 (American
Indian or Alaska Native data).

Figure 4. Percentage of Adults Aged 18 Years or Older With Diagnosed Diabetes, by Education Level,
United States, 2017–2018

          More than high school                                                      7.5%

                       High School                                                               9.7%

           Less than high school                                                                                     13.3%

                                         0                           5                          10                       15
                                                                           Percentage

Notes: Percentages are age-adjusted to the 2000 US standard population. Figure adapted from CDC’s National Diabetes Statistics Report 2020.
Data source: CDC’s National Health Interview Survey, 2017–2018.

                                                                   6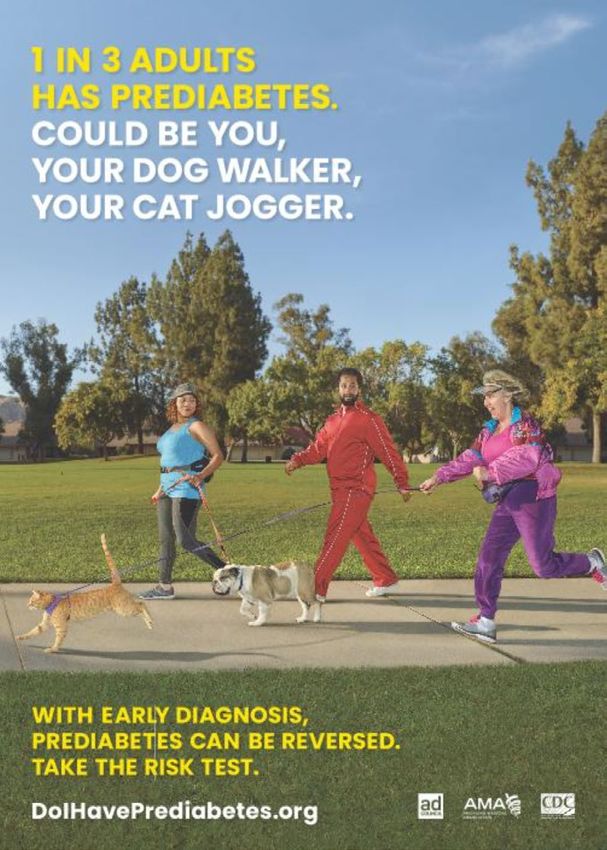
NATIONAL AND STATE DIABETES TRENDS

Geographic Distribution of Diagnosed Diabetes in Adults
Diagnosed diabetes is prevalent across all 50 states, the District of Columbia, and some US territories. Table 1 shows
the percentage of US adults who reported in 2016 that they had ever been told by a health care provider that
they had diabetes. Estimates ranged from 6.2% in Colorado to 13.7% in Puerto Rico. In 19 of the 54 states and 3 US
territories listed in Table 1, more than 10% of the population had diagnosed diabetes in 2016.

Table 1. Percentage of US Adults Aged 18 Years or Older With Diagnosed Diabetes, 2016
State or Territory           Percentage                         State or Territory              Percentage
Median                       9.5                                Ohio                            9.7
Alabama                      13.2                               Oklahoma                        10.9
Alaska                       7.7                                Oregon                          8.4
Arizona                      9.7                                Pennsylvania                    9.6
Arkansas                     12.1                               Puerto Rico                     13.7
California                   9.7                                Rhode Island                    8.6
Colorado                     6.2                                South Carolina                  11.5
Connecticut                  8.5                                South Dakota                    6.9
Delaware                     9.1                                Tennessee                       11.2
District of Columbia         8.4                                Texas                           10.9
Florida                      9.8                                Utah                            7.7
Georgia                      11.4                               Vermont                         7.3
Guam                         11.3                               US Virgin Islands               11.9
Hawaii                       9.5                                Virginia                        9.6
Idaho                        8.1                                Washington                      8.6
Illinois                     9.5                                West Virginia                   12.7
Indiana                      10.4                               Wisconsin                       8.6
Iowa                         8.1                                Wyoming                         7.6
Kansas                       8.5                               Note: Percentages are age-adjusted to the 2000 US standard
Kentucky                     11.8                              population.
Louisiana                    11.1                              Data sources: CDC’s United States Diabetes Surveillance System
                                                               and Behavioral Risk Factor Surveillance System.
Maine                        8.5
Maryland                     9.8
Massachusetts                8.3
Michigan                     9.8
Minnesota                    7.6
Mississippi                  12.4
Missouri                     10.2
Montana                      6.9
Nebraska                     8
Nevada                       10.1
New Hampshire                7.7
New Jersey                   8.1
New Mexico                   10.4
New York                     9.4
North Carolina               10.1
North Dakota                 8.2

                                                           7
NATIONAL AND STATE DIABETES TRENDS

Figure 5 shows the trend in geographic distribution of                  the adult population living with diabetes. County-level
diagnosed diabetes prevalence among adults across                       data can help researchers and public health officials,
US counties in 2004, 2008, and 2016. The largest                        community organizations, health care professionals,
percentages are in the southeastern and Appalachian                     and policy makers identify and work to reduce gaps in
portions of the United States, with more than 10.3% of                  diabetes care at the local level.

Figure 5. County-Level Distribution of Diagnosed Diabetes Prevalence Among US Adults Aged 20 Years
or Older, 2004, 2008, and 2016

                  2004                                           2008                                           2016

     1.5%–6.9%                   7.0%–8.4%                   8.5%–9.8%                  9.9%–12.1%                12.2%–33.0%

Notes: Percentages are age-adjusted to the 2000 US standard population. Data were not available for all US territories. Figure adapted
from CDC’s National Diabetes Statistics Report 2020.
Data source: CDC’s United States Diabetes Surveillance System. For detailed data for each map, go to https://gis.cdc.gov/grasp/diabetes/
DiabetesAtlas.html#. Click “County Data” tab at top and select “All Counties.”

                                                                    8
DIABETES SELF-MANAGEMENT EDUCATION AND SUPPORT
Diabetes self-management education and support diabetes participate in DSMES services recognized by
(DSMES) services have been scientifically proven to the American Diabetes Association (ADA) or accredited
improve management practices among people with by the Association of Diabetes Care & Education
diabetes, which lowers the risk of complications and Specialists (ADCES).
improves health outcomes.17
As of December 2019, about 3,650 DSMES services
CDC supports states in their efforts to prevent serious were offered across the United States. Forty-one
and costly complications from diabetes. This support states and the District of Columbia require that private
includes nationwide cooperative agreements, health insurers cover DSMES services. Twenty-five
partnerships, and surveillance and research activities states require coverage for all or nearly all Medicaid
to improve access to, coverage for, and participation beneficiaries. Five states require DSMES coverage for
in DSMES. For example, state health departments Medicaid beneficiaries who are receiving benefits
funded by CDC are working with health care systems through managed care organizations. Four states
to establish or expand the use of telehealth to increase require coverage under other specific conditions (e.g.,
access to DSMES services. They are also working to limited to specific populations or to beneficiaries with
encourage more pharmacists to participate. Alternative Benefit Plans).18
In 2018, CDC released a DSMES Toolkit to provide a Although ADA-recognized and ADCES-accredited
comprehensive set of resources and tools to support DSMES services are offered in 56% of counties across
the development, promotion, implementation, and the United States, 62% of rural counties do not have
sustainability of DSMES services. DSMES services.17
Research has shown that DSMES can also help lower
health care costs by reducing hospitalizations, hospital
readmissions, and emergency room visits for people
with diabetes.17 Every year, nearly 1 million people with
9PREDIABETES
When a person has prediabetes, their blood sugar had prediabetes in 2018, only 15.3% were aware of
levels are higher than normal but not high enough it. Trends in the prevalence of prediabetes among US
for a diabetes diagnosis. Prediabetes can increase adults remained constant from 2005 to 2016. However,
a person’s risk of developing type 2 diabetes, heart the percentage with prediabetes who had ever been
disease, and stroke. CDC estimates that 88 million, or 1 told by a health care professional that they had
in 3, US adults aged 18 years or older had prediabetes prediabetes (awareness) has doubled (Figure 6).12 Table
in 2018. This number includes about 35 million adults 2 shows the percentage of US adults by state or US
aged 45 to 64 years and 24 million aged 65 years or territory who said they had ever been told by a health
older. Although an estimated one-third of US adults care professional that they had prediabetes.
Figure 6. Trends in Age-Adjusted Prevalence and Awareness of Prediabetes Among US Adults Aged 18 Years
or Older, 2005–2016
40 Prevalence of Prediabetes
35
30
Percentage
25
20
15 Awareness of Prediabetes
10
5
0
2005–2008 2007–2010 2009–2012 2011–2014 2013–2016
Time Period
Notes: Prediabetes awareness was based on self-report and estimated only among adults with prediabtes. Prediabetes was defined as
fasting plasma glucose values of 100–125 mg/dL or hemoglobin A1C values of 5.7%–6.4%. Time periods overlap and are moving averages,
with two survey periods each. Figure adapted from CDC’s National Diabetes Statistics Report 2020.
Data source: CDC’s National Health and Nutrition Examination Survey, 2005–2016.
10PREDIABETES
Table 2. Percentage of US Adults Who Had Ever Been Told by a Health Care Professional That They Had
Prediabetes, 2016
State or Territory Percentage State or Territory Percentage
Median a
7.4 Ohio 6.7
Alabama 6.7 Oklahoma 7.4
Alaska 10.5 Oregon 8.8
Arizonab 7.6 Pennsylvaniab 6.0
Arkansasc 5.4 Puerto Rico 9.6
Californiab 8.2 Rhode Islandb 5.7
Coloradob 6.3 South Carolina 7.5
Connecticut 7.3 South Dakota 6.4
Delaware 10.8 Tennesseed 7.3
District of Columbia 10.8 Texas 9.7
Florida 8.7 Utahc 5.7
Georgiad 6.8 Vermontb 4.8
Guam 15.6 US Virgin Islands 10.8
Hawaiib 14.0 Virginia 9.0
Idaho 7.3 Washingtonb 7.0
Illinois 7.3 West Virginia 8.5
Indianab 6.4 Wisconsin 6.5
Iowa 6.5 Wyomingb 5.5
Kansas 6.5
Note: Percentages are age-adjusted to the 2000 US standard
Kentucky 7.7 population.
Louisiana 6.9 Data sources: CDC’s United States Diabetes Surveillance System
and Behavioral Risk Factor Surveillance System.
Maine 7.4 a
State median calculated with 2016 data only.
Marylandb 8.4
b
Data from 16 states are from 2014 because 2015 and 2016 data
were not available.
Massachusetts 7.2 c
Data from 4 states are from 2013 because 2014, 2015, and 2016
Michiganb 6.8 data were not available.
d
Data from 3 states are from 2015 because 2016 data were not
Minnesotab 6.2 available.
Mississippi 6.9
Missourib 6.9
Montanac 5.8
Nebraska 5.6
Nevada 9.5
New Hampshirec 5.5
New Jerseyb 7.4
New Mexico 9.0
New York 8.1
North Carolinad 7.2
North Dakotab 6.1
11DIABETES IN YOUTH
Of the estimated 26.9 million people with diagnosed
diabetes in 2018, about 210,000 were children
and adolescents younger than age 20 years.12 The
increasing frequency of both type 1 and type 2
diabetes in young people is a growing clinical and
public health concern. Since 2000, CDC and the
National Institutes of Health have funded the SEARCH
for Diabetes in Youth Study to learn more about
type 1 and type 2 diabetes and diabetes-related
complications among children and young adults in the
United States.
Findings from the SEARCH study indicate that the
incidence of both type 1 and type 2 diabetes increased
from 2002 to 2015. For type 1 diabetes, the annual
percentage change (APC) was 1.9%, with 14,638
children and adolescents younger than age 20 years
newly diagnosed.
Although the number of new cases of type 1 diabetes
was highest among whites, the APC in the number of
new cases during 2002–2015 was higher for all other
racial and ethnic groups. The sharpest increase was
among Asians or Pacific Islanders (4.4%), Hispanics
(4.0%), and blacks (2.7%).19 Figure 7 shows the
incidence of type 1 diabetes among children and
adolescents younger than age 20 years by racial or
ethnic group during 2014–2015. Incidence of type 1
diabetes was higher among whites than among racial
and ethnic minority groups.
Figure 7. Incidence of Type 1 Diabetes per 100,000 Persons Among Children and Adolescents Younger
Than Age 20 Years, by Racial or Ethnic Group, United States, 2014–2015
White 27.3
Black 20.8
Hispanic 16.3
Asian or Pacific Islander 9.4
American Indian 6.2
0 5 10 15 20 25 30
Incidence Rate
Note: American Indian youth who participated in the SEARCH study are not representative of all American Indian youth in the United
States. Therefore, these rates cannot be generalized to all American Indian youth nationwide.
Data source: SEARCH for Diabetes in Youth Study.
12DIABETES IN YOUTH
Similarly, for type 2 diabetes, the highest APC was seen Figure 8 shows the incidence of type 2 diabetes among
among Asians or Pacific Islanders (7.7%), Hispanics those younger than age 20 years by racial and ethnic
(6.5%), and blacks (6.0%) during 2002–2015. During group during 2014–2015. Incidence of type 2 diabetes
this period, 3,916 children and adolescents younger was significantly higher among racial and ethnic
than age 20 years were newly diagnosed with type 2 minority groups than among whites.
diabetes, with an overall APC of 4.8% per year.19
Figure 8. Incidence of Type 2 Diabetes per 100,000 Persons Among Children and Adolescents Aged
10–19 Years, by Racial or Ethnic Group, United States, 2014–2015
White 4.5
Black 37.8
Hispanic 20.9
Asian or Pacific Islander 11.9
American Indian 32.8
0 5 10 15 20 25 30 35 40
Incidence Rate
Note: American Indian youth who participated in the SEARCH study are not representative of all American Indian youth in the United
States. Therefore, these rates cannot be generalized to all American Indian youth nationwide.
Data source: SEARCH for Diabetes in Youth Study.
Findings from the SEARCH study indicate that the to 228 during 2012–2014. Although diabetes deaths
prevalence of both type 1 and type 2 diabetes among children and adolescents decreased over time,
increased among young people during 2001–2009. In the death rate among non-Hispanic black children
2001, the prevalence was 1.48 cases per 1,000 young and adolescents was about twice that of non-Hispanic
people for type 1 diabetes and 0.34 cases per 1,000 for white children and adolescents during 2012–2014.
type 2 diabetes. In 2009, the prevalence increased to
2.55 per 1,000 young people for type 1 diabetes and Additional research to identify health care factors and
0.46 cases per 1,000 for type 2 diabetes.20 behaviors that contribute to diabetes deaths among
children and adolescents may help public health
The SEARCH study also found that deaths from officials understand the reasons for differences by race
diabetes among all US children and adolescents aged or ethnicity. This information could help them target
1 to 19 years decreased, from 265 during 2000–2002 future prevention efforts more effectively.21
13PREDIABETES IN YOUTH
The prevalence of prediabetes is increasing among Adolescent boys aged 12 to 18 years have a significantly
US adolescents aged 12–18 years and young adults higher prevalence of prediabetes (22.5%) than girls (13.4%)
aged 19–34 years, which puts them at increased risk in the same age group (Figure 9). Adolescents with obesity
of developing diabetes and cardiovascular disease. A (25.7%) have a higher prevalence than those with normal
recent study found that 18% of US adolescents (1 in weight (16.4%). Prevalence among non-Hispanic black
5) and 24% of young adults (1 in 4) had prediabetes (22.7%) and Hispanic (22.5%) adolescents is higher than
during 2005–2016.22 among non-Hispanic white (15.8%) adolescents.22
Figure 9. Prediabetes Prevalence Among US Adolescents Aged 12–18 Years by Racial and Ethnic Group
and by Sex
Prevalence by Race or Ethnicity
25 22.5% 22.7%
20
15.8%
Percentage
15
10
5
0
Hispanic Black, non-Hispanic White, non-Hispanic
Prevalence by Sex
25 22.5%
20
Percentage
15 13.4%
10
5
0
Female Male
14PREVENTIVE CARE PRACTICES
Diabetes-related complications can be serious, costly, and deadly. They include heart disease, stroke, kidney disease
and kidney failure, blindness, and amputations of the legs and feet. Diabetes-related complications are more likely
and more severe among people whose diabetes is not well managed and those who have had diabetes longer.
People with diabetes can better manage their condition and improve their health by following evidence-based
preventive care practices recommended by ADA.23 These practices include getting regular A1C tests and annual foot
and eye exams, attending diabetes self-management classes (DSMES), and monitoring their blood sugar level every
day. Table 3 presents estimates of the percentage of US adults aged 18 years or older with diagnosed diabetes who
reported following ADA’s recommended preventive care practices.
Table 3. Percentage of US Adults Aged 18 Years or Older With Diagnosed Diabetes Who Reported
Following Recommended Preventive Care Practices, 2016
State or Territory Two or More Foot Exam Ever Attended a Dilated Eye Daily Self-
A1C Tests in by Health Diabetes Self- Exam in the Monitoring
the Last Year Professional in Management Last Year of Blood
the Last Year Class Sugar
Alabama 66.6 60.1 57.1 57.1 67.7
Alaska a
62.2 76.1 59.0 57.4 68.3
Arizona b
66.8 66.0 49.9 61.5 64.1
Arkansas c
NA NA NA NA NA
California b
63.9 62.9 64.5 59.7 42.7
Coloradob 63.2 67.9 54.4 61.1 55.6
Connecticutb 74.8 72.8 47.7 64.6 61.1
Delaware 66.7 69.5 55.3 76.1 50.0
District of Columbia 76.3 69.9 58.4 70.0 64.6
Florida b
74.4 52.4 45.2 62.1 62.2
Georgia b
63.5 65.2 52.9 65.6 61.3
Guam 59.2 66.9 43.4 52.5 42.9
Hawaii b
73.4 74.4 58.4 68.6 51.7
Idahoc NA NA NA NA NA
Illinoisb 67.9 74.2 61.4 61.5 70.2
Indiana b
73.1 70.6 59.2 49.8 64.2
Iowa b
78.7 79.3 65.2 64.1 65.9
Kansas b
71.4 69.6 59.8 64.6 58.7
Kentucky b
74.5 69.3 50.0 61.2 64.5
Louisiana 56.0 63.3 47.2 55.8 49.6
Maine a
77.3 80.8 59.3 60.6 60.7
Marylandb 75.4 75.7 59.0 61.9 65.9
Massachusetts 66.3 68.5 42.5 62.7 64.8
Michigan b
65.7 71.6 60.0 62.9 64.3
Minnesota b
75.4 81.4 69.1 74.4 64.8
Mississippi 72.2 69.6 42.5 56.3 69.0
Table 3 continued on next page
15PREVENTIVE CARE PRACTICES
Table 3 Continued
State or Territory Two or More Foot Exam Ever Attended a Dilated Eye Daily Self-
A1C Tests in by Health Diabetes Self- Exam in the Monitoring
the Last Year Professional in Management Last Year of Blood
the Last Year Class Sugar
Missouric NA NA NA NA NA
Montana b
72.8 82.7 63.1 58.2 41.6
Nebraska b
69.1 66.0 59.5 61.9 59.5
Nevada b
69.6 74.1 74.0 65.3 75.9
New Hampshire b
80.0 86.4 60.2 66.6 58.4
New Jersey 75.4 64.5 38.7 69.1 52.4
New Mexicob 73.6 75.9 48.1 61.2 65.5
New York b
77.3 71.5 34.8 67.0 56.1
North Carolina b
80.2 77.6 62.5 61.6 65.5
North Dakota a
66.1 82.7 66.8 58.0 68.0
Ohio 71.8 73.2 51.9 62.2 58.1
Oklahoma 74.7 73.9 56.9 63.8 65.0
Oregon c
NA NA NA NA NA
Pennsylvaniab 73.3 81.0 50.5 69.0 63.7
Puerto Rico 63.0 35.1 26.8 50.9 65.5
Rhode Island b
80.3 76.8 56.8 60.7 70.9
South Carolina b
69.2 63.9 54.1 56.5 62.1
South Dakota 74.9 74.7 59.8 64.1 60.9
Tennessee b
67.2 60.0 48.8 52.6 65.2
Texas 63.8 70.3 59.8 62.2 55.6
Utah b
69.8 71.2 60.4 57.9 60.4
Vermontb 71.6 72.8 45.7 66.7 67.5
US Virgin Islands 63.6 66.2 32.9 34.8 57.4
Virginia 75.6 73.8 57.4 64.1 63.0
Washington b
71.4 74.2 63.1 58.7 63.0
West Virginia a
77.9 70.1 54.6 54.8 71.1
Wisconsin 78.4 83.2 62.7 57.5 60.5
Wyoming 69.7 65.5 55.4 64.8 70.3
Note: Percentages are age-adjusted to the 2000 US standard population.
Data source: CDC’s United States Diabetes Surveillance System and Behavioral Risk Factor Surveillance System.
a
Data for 4 states are from 2014 because 2015 and 2016 data were not available.
b
Data for 29 states are from 2015 because 2016 data were not available.
c
Data for Arkansas, Idaho, Missouri, and Oregon were not available (NA) for 2014, 2015, or 2016.
16PREVENTIVE CARE PRACTICES
Healthy People 2020, which sets national objectives for improving the health of all Americans, monitors progress
toward increasing the percentage of people with diagnosed diabetes who follow preventive care practices. Table
4 shows the Healthy People 2020 targets for each practice and the all-states median percentages for each practice
during 2011–2016.
Table 4. Healthy People 2020 Targets and All-States Median Percentages of US Adults Aged 18 Years
or Older With Diagnosed Diabetes Who Reported Following Recommended Preventive Care Practices,
2011–2016
Year Two or More Foot Exam Ever Attended a Dilated Eye Daily Self-
A1C Tests in by Health Diabetes Self- Exam in the Monitoring
the Last Year Professional in Management Last Year of Blood
the Last Year Class Sugar
Healthy People 72.9 76.7 62.5 58.7 72.5
2020 Target
2011 68.8 70.8 56.3 60.1 64.2
2012 69.1 69.1 55.3 59.7 63.5
2013 67.3 69.2 55.8 59.5 64.1
2014 68.0 68.0 55.3 58.8 63.5
2015 71.4 71.6 54.4 61.6 63.0
2016 69.7 69.5 55.3 62.2 60.9
Notes: Percentages are age-adjusted to the 2000 US standard population. Percentages in bold met or exceeded the Healthy People
2020 target.
Data sources: CDC’s United States Diabetes Surveillance System and Behavioral Risk Factor Surveillance System.
Dilated eye exams were the only recommended barriers such as not having insurance coverage, having
practice that consistently met or exceeded the Healthy insurance with high co-payments, and living in a rural
People 2020 target during 2011–2016. The lowest area can make it hard for some people to participate
percentage was for ever attending a diabetes self- in DSMES.17 More research may help find new ways to
management class. DSMES can increase the use of overcome the challenges that prevent people from
preventive care practices, help improve quality of accessing DSMES services and address gaps in diabetes
life for people with diabetes, and reduce health care preventive care.17
costs by lowering the risk of complications.24 However,
Additional Diabetes Resources
The United States Diabetes Surveillance System is an interactive web application that provides national,
state, and county diabetes data. Users can view the data in the form of customized maps, charts, or tables
on desktop and mobile devices.
The Healthy People 2020 Diabetes website provides information about diabetes-specific objectives and
recommended practices as part of the nation’s 10-year health agenda.
The National Diabetes Statistics Report is a CDC publication that provides updated statistics about diabetes
in the United States for a scientific audience.
17NATIONAL DIABETES PREVENTION PROGRAM
CDC works to prevent or delay type 2 diabetes by The program is group-based and is led by a trained
leading the National Diabetes Prevention Program lifestyle coach. The CDC-approved curriculum can be
(National DPP). The National DPP is a partnership of delivered in-person, online, through distance learning,
public and private organizations working together to or through a combination of these delivery modes. The
build the infrastructure for nationwide delivery of an curriculum:
evidence-based lifestyle change program for adults
with prediabetes to prevent or delay the onset of Supports regular interaction between the lifestyle
type 2 diabetes. Participating organizations include coach and participants.
employers, insurers, community-based organizations, Builds peer support.
nonprofits, academic institutions, and federal, state, Focuses on helping people eat healthier, be more
and local governments. physically active and reduce stress.
Policy changes that allow health care delivery CDC also manages the Diabetes Prevention
and payment systems to interact with community Recognition Program (DPRP), which is the quality
organizations and service delivery networks have been assurance arm of the National DPP. The DPRP
shown to help build a sustainable system to deliver an awards CDC recognition to organizations that have
effective lifestyle change program.25 demonstrated their ability to effectively deliver the
The National DPP lifestyle change program is based on lifestyle change program and achieve the outcomes
the Diabetes Prevention Program research study and proven to prevent or delay onset of type 2 diabetes.
subsequent translation studies. These studies showed The DPRP is the only centralized source of performance
that making realistic behavior changes helped people data for organizations delivering the National DPP
with prediabetes lose 5% to 7% of their body weight lifestyle change program.
and reduce their risk of developing type 2 diabetes by
58% (71% for people older than age 60).26
18NATIONAL DIABETES PREVENTION PROGRAM
As of December 2019, over 1,500 organizations Center for Medicare & Medicaid Innovation to
had been recognized by CDC to deliver the lifestyle be eligible for Medicare coverage—a landmark
change program in all 50 states. More than 425,000 for public health. CDC worked closely with CMS
people at high risk of type 2 diabetes had participated. throughout the rulemaking process and revised
Participants whose data have been evaluated lost an the DPRP Standards to require preliminary or full
average of 5.5% of their body weight. recognition for organizations that want to supply
MDPP services. CMS coverage of the MDPP took
With technical assistance support from CDC, state effect in 2018.
health departments and other partners have secured
health insurance coverage for the National DPP for As of December 2019, 185 CDC-recognized program
close to 4 million public employees and dependents in delivery organizations had enrolled as MDPP
20 states. Over 100 commercial insurance companies suppliers. These organizations reported a total of
and self-insured employers also provide some form of 760 locations (312 administrative locations, 448
coverage for their plan members or employees with community locations). In addition to Medicare
prediabetes. coverage, 11 states (California, Delaware, Maryland,
Minnesota, Montana, New Jersey, New York, Oregon,
In March 2016, the Centers for Medicare & Medicaid Pennsylvania, Vermont, and Wyoming) include the
Services (CMS) certified the expansion of the National National DPP lifestyle change program as a covered
DPP lifestyle change program into Medicare. The health benefit for eligible Medicaid beneficiaries
new Medicare Diabetes Prevention Program (MDPP) and are in various stages of implementation.
became the first preventive service model from the
In 2016, the Do I Have Prediabetes campaign was
launched to raise awareness about prediabetes
across the nation. Witty and engaging public service
announcements distributed through thousands of
media outlets encourage people to take a 1-minute
online test to learn their risk of prediabetes.
People with high scores are directed to see their
doctor to confirm the result. The website also
provides links to a CDC-recognized lifestyle change
program, part of the National DPP. The Do I Have
Prediabetes campaign was developed by CDC,
ADA, the American Medical Association, and the Ad
Council. It is one of the Ad Council’s most successful
campaigns and has been extended through 2021.27
As of December 2019, a total of 2.7 million people
had taken the prediabetes risk test. The campaign
also documented 3 million unique visitors to its
website, 3.7 million video views, and 113,000 visits
to the National DPP website to find a lifestyle
change program.
Since the campaign began, awareness of the term
“prediabetes” increased from 50% in 2015 to 66%
in 2019 among people in the target audience who
speak English. Among Spanish speakers, awareness
rose from 53% to 80%.
19DIABETES RESOURCES
CDC and its partners have developed several tools An interactive web application allows users to view
to help employers, insurers, health care providers, the latest data on any device, from desktops to
and states assess the effect of diabetes on their smartphones, and produce a wide variety of reports,
communities and populations of interest. These datasets, and slides.28
tools can be used to calculate the economic costs
of the disease, evaluate the benefits of offering Diabetes State Burden Toolkit
the National DPP lifestyle change program, and
review existing policies related to education and The Diabetes State Burden Toolkit provides state
management of diabetes. estimates of diabetes burden (prevalence, incidence,
and related conditions), economic costs, and
United States Diabetes deaths. It also presents data about diabetes-related
complications; healthy life years lost; and costs
Surveillance System related to medical care, absence from work, and lost
CDC developed and manages the online United States household productivity.29
Diabetes Surveillance System (USDSS). This system is
used by public health planners, policy makers, health Diabetes Prevention Impact Toolkit
care systems, and community-based public health CDC developed the Diabetes Prevention Impact
practitioners to track and respond to trends in diabetes Toolkit to help employers, insurers, and state health
at national, state, and local levels. departments estimate the health and economic
The USDSS monitors incidence and prevalence of savings of offering the National DPP lifestyle change
diabetes, risk factors, care practices, and complications program to populations at risk of developing type 2
using various national surveys. These surveys include diabetes.30
the National Health and Nutrition Examination
Survey, the National Health Interview Survey, and the DSMES Toolkit
Behavioral Risk Factor Surveillance System (BRFSS). The
The DSMES Toolkit provides a comprehensive set of
USDSS also includes data on chronic kidney disease
resources and tools to support the development,
and end-stage renal disease from the United States
promotion, implementation, and sustainability of
Renal Data System.
DSMES services.31
20DIABETES RESOURCES
National Diabetes Prevention Program the following three tiers of engagement: (1) promoting
awareness of prediabetes and the National DPP;
The National DPP has a variety of resources, including (2) screening, testing, and referring people with
the following: prediabetes to CDC-recognized program delivery
organizations; and (3) delivering the program at the
National DPP Coverage Toolkit pharmacies.35
The National DPP Coverage Toolkit was developed to
support Medicaid, Medicare Advantage, commercial Chronic Kidney Disease
health plans, and employers that are considering
covering or implementing the National DPP lifestyle Surveillance System
change program.32
The Chronic Kidney Disease (CKD) Surveillance System
National DPP Registry of Recognized Organizations provides a range of data on CKD in the United States,
The National DPP Registry of Recognized Organizations including prevalence and incidence, risk factors,
lists CDC-recognized organizations that deliver the and quality of health care. It was created by CDC, in
National DPP lifestyle change program in communities collaboration with the University of California at San
across the United States. Preliminary or full recognition Francisco and the University of Michigan. The system
is required to supply services as part of the MDPP.33 also includes data that can be used to monitor kidney
disease objectives for Healthy People 2020.36
National DPP Customer Service Center
CDC created the National DPP Customer Service Vision and Eye Health
Center to address the increasing demand for technical
assistance and training from stakeholders involved Surveillance System
in delivering, promoting, or referring people to the The Vision and Eye Health Surveillance System (VEHSS)
National DPP lifestyle change program. provides data to help health professionals, researchers,
This online “one-stop shop” allows organizations to policy makers, and patients understand the scope of
access centralized resources, request personalized vision loss, eye disorders, and eye care services in the
technical assistance, and participate in discussions United States. It was developed by CDC and NORC at
with other members of the National DPP community. the University of Chicago.
It provides articles, recorded webinars, and answers CDC used VEHSS data to create state profiles of the
to frequently asked questions. Organizations in need impact of vision impairment and comorbid conditions
of more help can also submit technical assistance across the United States. The profiles provide
requests through the website or by e-mail.34 state-level data from the BRFSS and the American
Community Survey, as well as county-level maps for
Rx for the National DPP: Action Guide each state that show the prevalence of self-reported
for Community Pharmacists severe vision impairment.37
The publication Rx for the National DPP: Action Guide for
Community Pharmacists is designed to help community
pharmacists and members of the pharmacy workforce
get involved in the National DPP. It is framed around
Website addresses of nonfederal organizations are provided solely as a service to readers. Provision of an
address does not constitute an endorsement of this organization by CDC or the federal government, and
none should be inferred. CDC is not responsible for the content of other organizations’ web pages.
21TECHNICAL NOTES AND REFERENCES
The estimates in this report were calculated by staff from CDC’s Division of Diabetes Translation and are available
in more detail in CDC’s National Diabetes Statistics Report 2020 and from the USDSS. Diabetes data are from the
US Census Bureau, the Indian Health Service’s National Data Warehouse, the SEARCH for Diabetes in Youth Study,
and various surveys and data collection systems. These systems include the BRFSS, the National Health Interview
Survey, the National Health and Nutrition Examination Survey, the National Hospital Discharge Survey, and the
National Vital Statistics System.
To make meaningful comparisons between states and over time, we used the US Census Bureau’s 2000 US
standard population to age-adjust our estimated rates. Age adjustment is a statistical process applied to rates of
diseases, injuries, and health outcomes. It allows comparisons between communities with different age structures
because it proportions rates to a standard age structure. Three-year moving averages are sometimes used to
improve the precision of estimates. State estimates in this report card are based on BRFSS data. Because of the
limitations of self-reported data in surveys, these estimates may underreport the rates of diagnosed diabetes and
prediabetes in the US population.
1. Centers for Disease Control and Prevention. Division of 10. Geiss LS, Li Y, Hora I, et al. Resurgence of diabetes-related
Diabetes Translation website. Diabetes Report Card. nontraumatic lower-extremity amputation in the young
https://www.cdc.gov/diabetes/library/reports/ and middle-aged adult US population. Diabetes Care.
reportcard.html. Accessed November 19, 2019. 2019;42(1):50–54.
2. Patient Protection and Affordable Care Act of 2009. Pub. 11. Bardenheier BH, Lin J, Zhuo X, et al. Disability-free life
L No. 111-148, Title X, Sec 10407, 42 USC 247b-9a. -years lost among adults aged ≥50 years with and
3. Giovannucci E, Harlan DM, Archer MC, et al. Diabetes without diabetes. Diabetes Care. 2016;39(7):1222–1229.
and cancer: a consensus report. Diabetes Care. 12. Centers for Disease Control and Prevention. National
2010;33(7):1674–1685. Diabetes Statistics Report 2020: Estimates of Diabetes and
4. Dolan C, Glynn R, Griffin S, et al. Brain complications of Its Burden in the United States. Atlanta, GA: Centers for
diabetes mellitus: a cross-sectional study of awareness Disease Control and Prevention, US Dept of Health and
among individuals with diabetes and the general Human Services; 2020.
population in Ireland. Diabet Med. 2018;35(7):871–879. 13. Benoit SR, Hora I, Albright AL, Gregg EW. New directions
5. American Diabetes Association. Economic costs of in incidence and prevalence of diagnosed diabetes in
diabetes in the U.S. in 2017. Diabetes Care. 2018;41: the USA. BMJ Open Diab Res Care. 2019;7:e000657.
917–928. 14. Cheng YJ, Kanaya AM, Araneta MR, et al. Prevalence
6. National High Blood Pressure Education Program. of diabetes by race and ethnicity in the United States,
The Seventh Report of the Joint National Committee on 2011-2016. JAMA. 2019;322(24):2389–2398.
Prevention, Detection, Evaluation, and Treatment of High 15. Beckles GL, Chou C. Disparities in the prevalence of
Blood Pressure. Bethesda, MD: National Heart, Lung, and diagnosed diabetes — United States, 1999–2002
Blood Institute; 2004. and 2011–2014. MMWR Morb Mortal Wkly Rep.
7. Daniel MJ. Lipid management in patients with type 2 2016;65(45):1265–1269.
diabetes. Am Health Drug Benefits. 2011;4:312–322. 16. Luo H, Beckles GL, Zhang X, Sotnikov S, Thompson T.
8. Murchison AP, Hark L, Pizzi LT, et al. Non-adherence to The relationship between county-level contextual
eye care in people with diabetes. BMJ Open Diabetes Res characteristics and use of diabetes care services. J Public
Care. 2017;5(1):e000333. Health Manag Pract. 2014;20(4):401–410.
9. Lewis EJ, Hunsicker LG, Clarke WR, et al; Collaborative 17. Rutledge SA, Masalovich S, Blacher RJ, Saunders MM.
Study Group. Renoprotective effect of the angiotensin- Diabetes self-management education programs in
receptor antagonist irbesartan in patients with nonmetropolitan counties — United States, 2016.
nephropathy due to type 2 diabetes. N Engl J Med. MMWR Surveill Summ. 2017;66(10):1–6.
2001;345:851–860.
22TECHNICAL NOTES AND REFERENCES
18. ChangeLab Solutions. A Key Tool in Health Care: Diabetes 31. Centers for Disease Control and Prevention. Diabetes
Self-Management Education and Training (DSME/T). Self-Management Education and Support Toolkit
National Landscape: Background, Benefits, and Insurance website. https://www.cdc.gov/diabetes/dsmes-toolkit.
Coverage of DSME/T. Oakland, CA: ChangeLab Solutions; Accessed November 20, 2019.
2016. 32. National Association of Chronic Disease Directors.
19. Divers J, Mayer-Davis EJ, Lawrence JM, et al. Trends National Diabetes Prevention Program Coverage
in incidence of type 1 and type 2 diabetes among Toolkit website. https://coveragetoolkit.org/. Accessed
youths — selected counties and Indian reservations, November 20, 2019.
United States, 2002–2015. MMWR Morb Mortal Wkly Rep. 33. Centers for Disease Control and Prevention. National
2020;69:161–165. Diabetes Prevention Program website. Registry of All
20. Dabelea D, Mayer-Davis EJ, Saydah S, et al. Recognized Organizations. https://nccd.cdc.gov/DDT_
Prevalence of type 1 and type 2 diabetes among DPRP/Registry.aspx. Accessed November 20, 2019.
children and adolescents from 2001 to 2009. JAMA. 34. Centers for Disease Control and Prevention. National
2014;311(17):1778–1786. Diabetes Prevention Program Customer Service Center
21. Saydah S, Imperatore G, Cheng Y, Geiss LS, Albright website. https://nationaldppcsc.cdc.gov/s/. Accessed
A. Disparities in diabetes deaths among children and February 10, 2020.
adolescents — United States, 2000–2014. MMWR Morb 35. Centers for Disease Control and Prevention. CDC-
Mortal Wkly Rep. 2017;66(19):502–505. Recognized Lifestyle Change Program website. How
22. Andes LJ, Cheng YJ, Rolka DB, Gregg EW, Imperatore Pharmacists Can Participate. https://www.cdc.gov/
G. Prevalence of prediabetes among adolescents and diabetes/prevention/lifestyle-program/deliverers/
young adults in the United States, 2005-2016. JAMA pharmacists.html. Accessed November 20, 2019.
Pediatrics. 2019:e194498. 36. Centers for Disease Control and Prevention. Chronic
23. Introduction: standards of medical care in Kidney Disease (CKD) Surveillance System website.
diabetes—2020. Diabetes Care. 2020;43(1):S1–S2. https://nccd.cdc.gov/ckd/default.aspx. Accessed
24. Powers MA, Bardsley J, Cypress M, et al. Diabetes self- November 20, 2019.
management education and support in type 2 diabetes: 37. Centers for Disease Control and Prevention. Vision
a joint position statement of the American Diabetes Health Initiative website. State Profiles. https://www.
Association, the American Association of Diabetes cdc.gov/visionhealth/data/state-profiles/index.htm.
Educators, and the Academy of Nutrition and Dietetics. Accessed November 20, 2019.
J Acad Nutr Diet. 2015;115(8):1323–1334.
25. Burd C, Gruss S, Albright A, et al. Translating knowledge
into action to prevent type 2 diabetes: Medicare
expansion of the National Diabetes Prevention Program
lifestyle intervention. Milbank Q. 2020;98(1): 172–196.
26. Diabetes Prevention Program Research Group.
Reduction in the incidence of type 2 diabetes with
lifestyle intervention or metformin. N Engl J Med.
2002;346(6):393–403.
27. New prediabetes awareness campaign features
unexpected animal videos to encourage Americans to
learn their risk [news release]. New York, NY: Ad Council;
July 25, 2017.
28. Centers for Disease Control and Prevention. US Diabetes
Surveillance System website. https://gis.cdc.gov/grasp/
diabetes/DiabetesAtlas.html. Accessed May 21, 2019.
29. Centers for Disease Control and Prevention. Diabetes
State Burden Toolkit website. https://nccd.cdc.gov/
Toolkit/DiabetesBurden. Accessed November 20, 2019.
30. Centers for Disease Control and Prevention. Diabetes
Prevention Impact Toolkit website. https://nccd.cdc.gov/
Toolkit/DiabetesImpact. Accessed November 20, 2019.
23APPENDIX: ACCESSIBLE EXPLANATIONS OF FIGURES
Figure 1. This horizontal line graph shows the 9.9% to 12.1%, and 12.2% to 33.0%. The maps show
incidence trend of diagnosed diabetes among US that prevalence has increased steadily over time, with
adults aged 18 years or older from 2000 to 2018. The many more counties in the highest rate category in
vertical Y-axis is the rate per 1,000 persons and ranges the 2016 map compared to the 2004 and 2008 maps.
from 1 to 10. The horizontal X-axis is the time period. (Page 8)
Incidence rates increased steadily from 6.2 in 2000 to
9.3 in 2009, and then declined from 7.7 in 2010 to 6.7 Figure 6. This horizontal line graph uses 2 lines to show
in 2018. (Page 3) the prevalence and awareness trends of prediabetes
among US adults aged 18 years or older from 2005 to
Figure 2. This horizontal line graph uses 3 lines to 2016. The vertical Y-axis presents percentages from
show the prevalence trends of diagnosed diabetes, 0% to 40% in increments of 5. The horizontal X-axis
undiagnosed diabetes, and total diabetes among US presents the time period in 3-year spans. Prevalence
adults aged 18 years or older from 1999 to 2016. The remained constant, ranging from 33.6% in 2005–2008
vertical Y-axis presents percentages from 0% to 14% to 33.3% in 2013–2016. Awareness doubled, from 6.5%
in increments of 2. The horizontal X-axis presents the in 2005–2008 to 13.3% in 2013–2016. (Page 10)
time period in 2-year spans. Prevalence of diagnosed
diabetes increased from 6.1% in 1999–2000 to 9.7% Figure 7. This horizontal bar graph shows the
in 2015–2016. Prevalence of undiagnosed diabetes incidence of type 1 diabetes among US children and
remained steady, ranging from 2.7% in 1999–2000 to adolescents younger than age 20 years by racial or
3.5% in 2001–2002 and 3.3% in 2009–2010, and then ethnic group from 2014 to 2015. The vertical Y-axis lists
returning to 2.8% in 2015–2016. Prevalence of total 5 racial and ethnic groups in the United States. The
diabetes increased from 8.8% in 1999–2000 to 12.5% horizontal X-axis presents rates per 100,000 persons
in 2015–2016. (Page 4) from 0 to 30 in increments of 5. Incidence was higher
among whites at 27.3, followed by blacks at 20.8,
Figure 3. This horizontal bar graph shows the Hispanics at 16.3, Asians or Pacific Islanders at 9.4, and
percentage of US adults aged 18 years or older with American Indians at 6.2. (Page 12)
diagnosed diabetes by racial or ethnic group from
2017 to 2018. The vertical Y-axis lists 5 racial and ethnic Figure 8. This horizontal bar graph shows the
groups in the United States. The horizontal X-axis incidence of type 2 diabetes among US children and
presents percentages from 0% to 20% in increments of adolescents aged 10 to 19 years by racial or ethnic
5. American Indians or Alaska Natives had the highest group from 2014 to 2015. The vertical Y-axis lists 5 racial
age-adjusted rates at 14.7%, followed by Hispanics at and ethnic groups in the United States. The horizontal
12.5%, non-Hispanic blacks at 11.7%, Asians at 9.2%, X-axis presents rates per 100,000 persons from 0 to 40
and non-Hispanic whites at 7.5%. (Page 6) in increments of 5. Incidence was significantly higher
among racial and ethnic minority groups compared to
Figure 4. This horizontal bar graph shows the whites. Rates were 37.8 for blacks, 32.8 for American
percentage of US adults aged 18 years or older with Indians, 20.9 for Hispanics, 11.9 for Asians or Pacific
diagnosed diabetes by education level from 2017 to Islanders, and 4.5 for whites. (Page 13)
2018. The vertical Y-axis lists 3 education levels. The
horizontal X-axis presents percentages from 0% to Figure 9. Two vertical bar graphs show the prediabetes
15% in increments of 5. Percentages were higher prevalence among US adolescents aged 12 to 18 years
among adults with less than a high school education by race or ethnicity and by sex. In the first graph, the
at 13.3%, followed by those with a high school vertical Y-axis presents percentages from 0% to 25% in
education at 9.7%, and those with more than high increments of 5. The horizontal X-axis lists female and
school education at 7.5%. (Page 6) male. Prevalence was higher among males at 22.5%
than among females at 13.4%. In the second graph, the
Figure 5. Three US maps show the county-level vertical Y-axis presents percentages from 0% to 25% in
distribution of diagnosed diabetes prevalence among increments of 5. The horizontal X-axis lists 3 racial and
US adults aged 20 years or older in 2004, 2008, and ethnic groups. Prevalence was higher among non-
2016. Prevalence percentages are divided into 5 Hispanic blacks at 22.7% and Hispanics at 22.5% than
categories: 1.5% to 6.9%, 7.0% to 8.4%, 8.5% to 9.8%, among non-Hispanic whites at 15.8%. (Page 14)
CS 316415-A 24You can also read