Diggers and Dealers 2021 - Inspired people creating a premier global gold company - Evolution Mining
←
→
Page content transcription
If your browser does not render page correctly, please read the page content below
Click on the page to view the video

     Diggers and Dealers 2021
     Inspired people creating a premier global gold company

                                                              1
FORWARD LOOKING STATEMENT
These materials prepared by Evolution Mining Limited (or “the Company”) include forward looking statements. Often, but not always, forward looking statements
can generally be identified by the use of forward looking words such as “may”, “will”, “expect”, “intend”, “plan”, “estimate”, “anticipate”, “continue”, and “guidance”,
or other similar words and may include, without limitation, statements regarding plans, strategies and objectives of management, anticipated production or
construction commencement dates and expected costs or production outputs.

Forward looking statements inherently involve known and unknown risks, uncertainties and other factors that may cause the Company’s actual results,
performance and achievements to differ materially from any future results, performance or achievements. Relevant factors may include, but are not limited to,
changes in commodity prices, foreign exchange fluctuations and general economic conditions, increased costs and demand for production inputs, the speculative
nature of exploration and project development, including the risks of obtaining necessary licenses and permits and diminishing quantities or grades of reserves,
political and social risks, changes to the regulatory framework within which the Company operates or may in the future operate, environmental conditions including
extreme weather conditions, recruitment and retention of personnel, industrial relations issues and litigation.

Forward looking statements are based on the Company and its management’s good faith assumptions relating to the financial, market, regulatory and other
relevant environments that will exist and affect the Company’s business and operations in the future. The Company does not give any assurance that the
assumptions on which forward looking statements are based will prove to be correct, or that the Company’s business or operations will not be affected in any
material manner by these or other factors not foreseen or foreseeable by the Company or management or beyond the Company’s control.

Although the Company attempts and has attempted to identify factors that would cause actual actions, events or results to differ materially from those disclosed in
forward looking statements, there may be other factors that could cause actual results, performance, achievements or events not to be as anticipated, estimated or
intended, and many events are beyond the reasonable control of the Company. Accordingly, readers are cautioned not to place undue reliance on forward looking
statements. Forward looking statements in these materials speak only at the date of issue. Subject to any continuing obligations under applicable law or any
relevant stock exchange listing rules, in providing this information the Company does not undertake any obligation to publicly update or revise any of the forward
looking statements or to advise of any change in events, conditions or circumstances on which any such statement is based.

This presentation has been approved for release by Evolution’s Board of Directors.

                                                                                                                                                                           2
A ROUGH 12 MONTHS FOR GOLD
                           ASX All Ords Gold Index (XGD) vs
                          ASX300 Metals & Mining Index (XMM)

                                                                                                         +25%

                                                                                                         -30%

Jul-20   Aug-20 Sep-20 Oct-20           Nov-20 Dec-20    Jan-21   Feb-21 Mar-21   Apr-21 May-21 Jun-21

                                           XMM (% chg)        XGD (% chg)

                 Source: https://au.finance.yahoo.com/
                                                                                                                3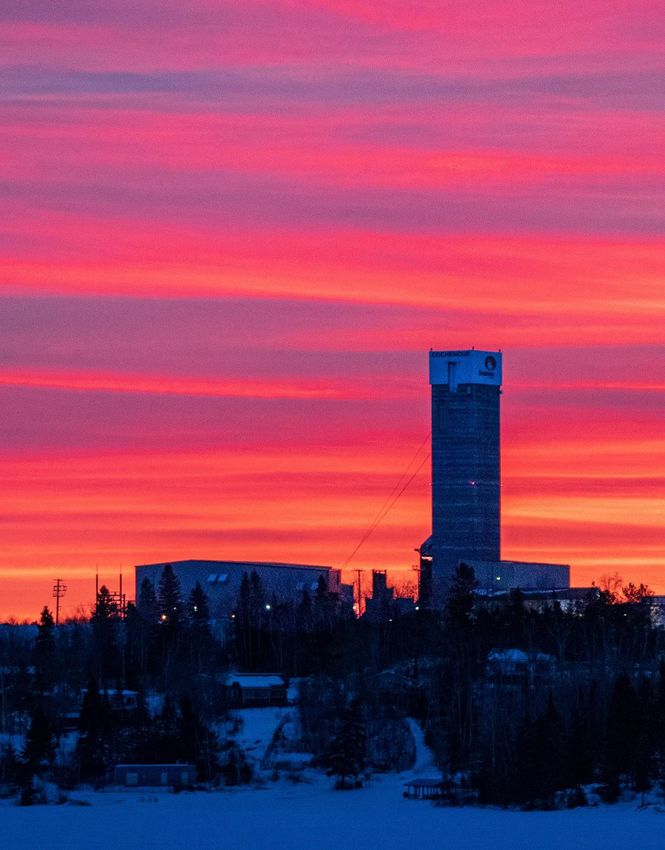
EVERY INVESTOR SHOULD HAVE INSURANCE

                          Central Bank Assets                                                                             Gold price (US$ per ounce)

                                                                                                US$8.0T
                                                                                                €7.7T
                                                                                                ¥717T                                                                      US$1797/oz

                                                                                                    US$520/oz

2006        2008      2010          2012           2014     2016        2018      2020   2021                   2006   2008   2010   2012   2014   2016   2018   2020   2021

       ECB Total Assets      Bank of Japan Total Assets            Fed Balance Sheet Assets

                      Source: https://fred.stlouisfed.org
                                                                                                                                                                               4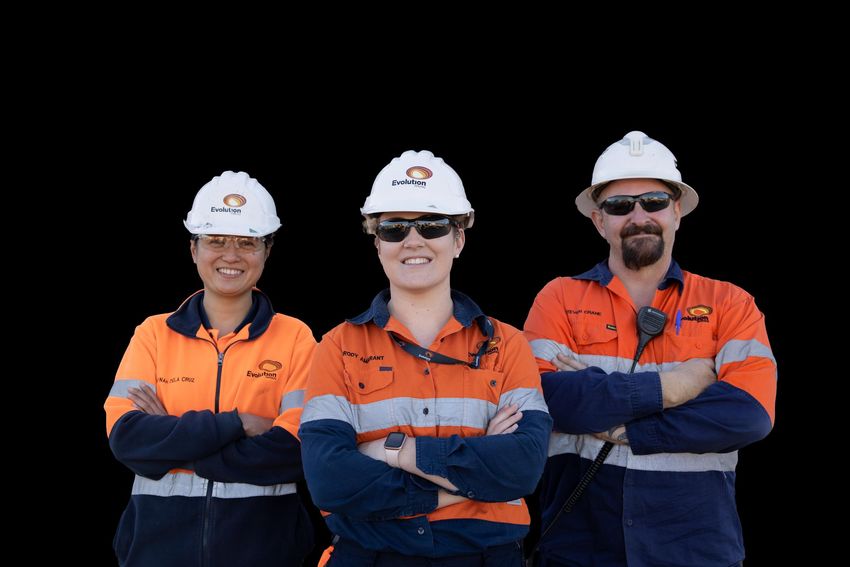
EVOLUTION SNAPSHOT
MARKET CAPITALISATION                              1                      A$7.6bn

NET DEBT 2                                                                A$460M

GOLD MINERAL RESOURCES 3                                                  26.4Moz

GOLD ORE RESERVES 3                                                       9.9Moz

RESERVE PRICE ASSUMPTION                                                  A$1,450/oz

FY21 PRODUCTION                                                           681koz

FY21 AISC                                                                 A$1,215/oz

NUMBER OF OPERATING ASSETS                                                6

PORTFOLIO MINE LIFE 4                                                     13+ years

                                                                                                                           Pictured: Cochenour shaft – Red Lake operation

     1.   Based on share price of A$4.18 per share on 30 July 2021
     2.   As at 30 June 2021
     3.   Excludes Battle North Ore Reserves and Mineral Resources which have not been estimated in accordance with JORC
          Code. See the Appendix of this presentation for details on Mineral Resources and Ore Reserves
     4.   Portfolio mine life refers to a production weighted average of asset mine lives excluding Acquisition Assets                                           5
FOCUSED PORTFOLIO OF ASSETS IN TIER 1 JURISDICTIONS

▪ Evolution has a focused
  portfolio of assets located solely                                                                    Red Lake

  in Tier 1 jurisdictions
▪ Australia and Canada are
  amongst the highest rated
  countries based on the Fraser
  Institute and World Bank metrics
                                                                                                                                                                                                               Ernest Henry    Mt Carlton
                                                                                                                                                                                                                                Mt Rawdon
                                                                                                                                                                                                             Mungari
            Evolution vs. peers World Bank                                                    Evolution Legend
                                                                                                                                                                                                                                Head
                                                                                                                                                                                                                       Cowal    Office
              investment attractiveness1                                                            Head Office
                                                                                                    Operating assets
                                                                                                    Low Jurisdictional Risk
                                                                                                    Moderate Jurisdictional Risk
                                                                                                    High Jurisdictional Risk
  91   88   86
                  77     73     71     67     65     60     59
                                                                   40
                                                                          29
                                                                                                   Evolution offers a premium exposure to a range of world-class
                                                                                                            assets located solely in Tier 1 jurisdictions

            1.   Investment attractiveness based on The World Bank’s Ease of Doing Business Index of the asset location, weighted according to 22E production of each asset from Wood Mackenzie estimates.
                 Peers include Newcrest, Newmont, Barrick, Kinross, IAMGOLD, Agnico Eagle, Gold Fields, Eldorado, New Gold, Yamana and AngloGold                                                                                   6
SUSTAINABILITY –                                              INTEGRATED INTO EVERYTHING WE DO

▪ Keeping our people healthy and safe
    ◼   Through strong collective leadership Evolution
        continues to operate safely through COVID-19 with                 Creating value
                                                                         in the areas we
        no material impact on operations
                                                                         choose to lead
▪ Environment, climate risk and emissions
   ◼ Committed to “Net Zero” emissions1 by 2050 and

     30% emissions reduction by 2030
    ◼   Water security – mitigating risk through reduction of
        fresh-water demand, reuse of water and reduction
        of total demand

▪ Cultural Heritage & Community
   ◼ Engaging with our First Nation partners and our

      communities to move beyond our obligations to
      ‘doing the right thing’
                                                                                           DISCLAIMER STATEMENT
▪ MSCI ESG rating upgraded to AA                                                           THE USE BY EVOLUTION MINING OF ANY MSCI ESG
                                                                                           RESEARCH LLC OR ITS AFFILIATES (“MSCI”) DATA,
                                                                                           AND THE USE OF MSCI LOGOS, TRADEMARKS,

   ▪ The highest rating among global gold mining peers                                     SERVICE MARKS OR INDEX NAMES HEREIN, DO NOT
                                                                                           CONSTITUTE A SPONSORSHIP, ENDORSEMENT,
                                                                                           RECOMMENDATION, OR PROMOTION OF EVOLUTION
                                                                                           MINING BY MSCI. MSCI SERVICES AND DATA ARE THE
                                                                                           PROPERTY OF MSCI OR ITS INFORMATION
                                                                                           PROVIDERS, AND ARE PROVIDED ‘AS-IS’ AND
                                                                                           WITHOUT WARRANTY. MSCI NAMES AND LOGOS ARE
                                                                                           TRADEMARKS OR SERVICE MARKS OF MSCI.
        1.   Emissions targets are related to Scope 1 and 2
                                                                                                                             7 7
FOUR LONG LIFE, HIGH MARGIN CORNERSTONE ASSETS
Executing a focused and sustainable growth strategy

              Cowal                   Red Lake               Ernest Henry                 Mungari
             Expansion             Transformation             Extension                  Expansion
                Underground        Investment in restoring     Below 1200mRL          Kundana acquisition
          development project to   to a premier Canadian      Concept Study and       and mill expansion to
             lift production to     gold mine producing      Pre-Feasibility Study   increase production to
                  350kozpa                350kozpa                                         200kozpa

                                                                                                              8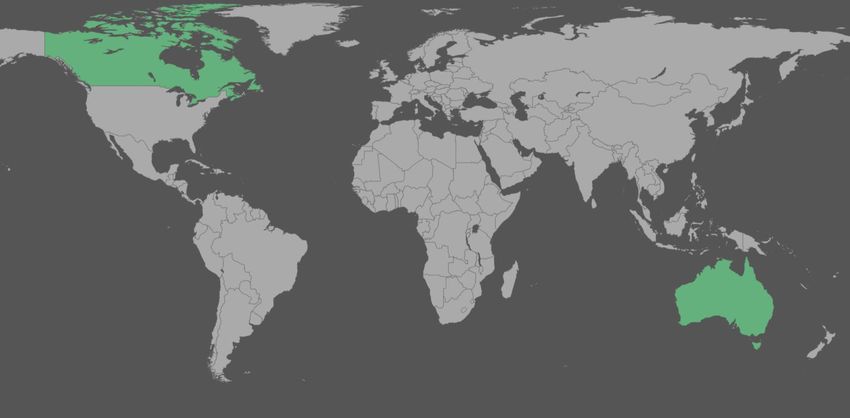
COWAL
                                                                         In the next three years
Cowal Underground development
▪ A$380M investment in Cowal Underground
                                                                      Production
▪ Strong community support for the project                            to ramp-up    350kozpa
▪ Base load of open pit ore from E42 and longer-term development of   to
  satellite pits

                                                                      All-in Cost
                                                                      expected to      ~28%
                                                                      decrease by

                                                                      Mine Life
                                                                      (Years)       17+ years

                                                                                                   9
RED LAKE
                                                                                                                                                                    In the next three years
Red Lake Transformation – a clear pathway to 350kozpa
                                                                                                                                                              Production
▪ Large Mineral Resource of                         11Moz1                                                                                                    ramp-up to      200kozpa
▪ Growth plans accelerated by Battle North acquisition
▪ Investment now focused on mine development to fill mills
                                                                                                                                                              All-in Cost
                                                                                                                                                              expected to        ~26%
                                                                                                                                                              decrease by

                                                                                                                                                              Mine Life
                                                                                                                                                              (Years)         15+ years

                                                                                                                                                                    In the next five years
                                                                                                                                                               Further
                                                                                                                                                               ramp-up goal
                                                                                                                                                               by FY26
                                                                                                                                                                              350kozpa

         1.   Mineral Resources and Ore Reserves estimate at 31 December 2020. See the Appendix of this release for details on Mineral Resources and Ore Reserves                             10
ERNEST HENRY
Ernest Henry Extension below the 1200m RL
▪ Current drill program testing extension of the ore body below the
Mine life extension milestones
current reserves at 1,200mRL
▪ Targeting a 3 – 5 year mine life extension with increased copper
exposure
Below Finalising concept
1,200mRL study to test depth
extension
Advancing to
Pre-Feasibility H1 FY22
Study in
11ACQUISITION OF KUNDANA ASSETS 1
Elevating Mungari to create Evolution’s Map of the Acquisition Assets Legend
fourth cornerstone asset and Mungari Evolution
Acquisition Assets
Current ore sources
▪ Acquisition of underground operating mines within Carnage
Processing facilities
8km of Evolution’s low-cost Mungari Mill 2
Development /
discovery
Carbine Tenements
▪ Improved production with addition of high-grade
ore sources, displacing lower grade open pit feed Kanowna
Belle Mill
▪ Production, net mine cash flow and Mineral
Castle Millennium
Resources per share accretive Hill Raleigh
WKJV
RHP3 Kalgoorlie
▪ Significant synergies from shorter haulage White Foil
Mungari Frog’s Leg
distances and lower processing costs Mill
▪ Maintained focus on margins with no change to
Group AISC or major capital outlook Coolgardie
50km
0 10km Radius
1. For details on the transaction, see announcement entitled “Acquisition to Elevate Mungari to Cornerstone Asset”
released to the ASX on 22 July 2021 and available to view at www.evolutionmining.com
2. Refers to estimated haulage distance from the Kundana and EKJV deposits to the Mungari Mill
3. RHP – Rubicon, Hornet, Pegasus 12MUNGARI – A FOURTH CORNERSTONE ASSET
Gold production objective of 200kozpa post Doubling Mungari’s mineral endowment with higher
mill expansion grade ore sources
Pro Forma Mungari Ore Reserve and Mineral Resources (koz) (Pre-EVN certification)1
▪ More than doubles Mineral Resources and Ore Reserves1
▪ Extends mine life from 9 to 13 years with potential for Mineral Resources (koz)
further resource conversion2 4.1 2.1
▪ Future mill expansion to increase production to 200kozpa 1.4 2,443
4,629
objective and reduced AISC 2,186
▪ Pre-Feasibility Study completion – ~September 2021 Mungari Acquisition Assets Mungari
(Standalone) (Pro Forma)
quarter
▪ Feasibility Study completion – ~end FY22
Ore Reserves (koz)
4.0 2.2
1.4 579
1,033
1. Mungari Mineral Resources and Ore Reserves inclusive of stockpile and based on Evolution Ore 454
Reserves gold price assumption of A$1,450/oz and Mineral Resources gold price assumption of
A$2,000/oz as reported in the Evolution 2020 Annual Mineral Resources and Ore Reserves Mungari Acquisition Assets Mungari
Statement released on the 17 February 2021. Acquisition Assets Mineral Resources and Ore
Reserves are provided in Evolution’s ASX announcement entitled ‘Acquisition to elevate Mungari to a
(Standalone) (Pro Forma)
cornerstone asset and A$400 million equity raising’ released on 22 July 2021 and available to view at
www.evolutionmining.com.au. Those Mineral Resources and Ore Reserves have been prepared Contained Ounces (koz) Au Grade (g/t)
based on Mineral Resource and Ore Reserve estimation criteria using a gold price assumption of
A$2,250/oz to estimate Mineral Resources and A$1,750/oz to estimate Ore Reserves. Further
information on Mineral resources and Ore Reserves are provided in the Appendix of this release
2. Based on Evolution’s internal life of mine plan 13ENHANCES PORTFOLIO QUALITY
Four long life, high margin assets
3,000 Ernest Henry
Production
Base2
2,500 100koz
LOM AISC Margin (A$/oz)1
Acquisition Assets extend Mungari’s mine
2,000 life and support Mungari mill expansion to Cowal
increase scale to a 200kozpa operation Red Lake
Mungari
1,500 Mungari (incl. Acquisition
(Standalone) Assets)
Mt Rawdon
Mt Carlton
1,000
500
-
- 2 4 6 8 10 12 14 16 18 20
Mine Life3
1. LOM AISC Margin based on Evolution’s current life of mine plan. AISC margin assumes the spot gold price of A$2,450/oz on 19 July 2021
2. Production base refers to FY21 actuals for Mungari (standalone), Ernest Henry, Mt. Rawdon and Mt. Carlton. Mungari (incl. Acquisition Assets) based on post Mungari mill expansion objective of ~200koz p.a. Cowal
and Red Lake based on medium-term production objectives of ~350kozpa (refer to ASX announcement released on 16 July 2021 titled “Cowal Underground Board Approval and Group 3 Year Outlook”)
14
14
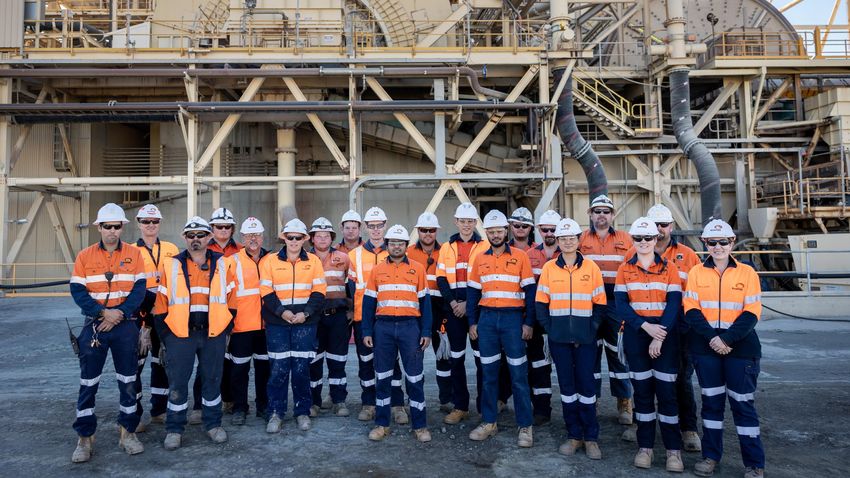
3. Mine Life based on Evolution’s current life of mine plans. Mungari (incl. Acquisition Assets) reflects the contribution to mine life extensions expected from the Acquisition AssetsPEOPLE – OUR MOST IMPORTANT ASSET
SAFETY | EXCELLENCE | ACCOUNTABILITY | RESPECT
15Appendix
16EVOLUTION 2020 GOLD MINERAL RESOURCES
Gold Measured Indicated Inferred Total Resource Dec 19
Resource
Gold Gold Gold Gold Gold Gold Gold
Tonnes Gold Tonnes Tonnes Tonnes CP4 Gold Metal
Project Type Cut-Off Metal Grade Metal Grade Metal Grade Metal
(Mt) Grade (g/t) (Mt) (Mt) (Mt) (koz)
(koz) (g/t) (koz) (g/t) (koz) (g/t) (koz)
Cowal1 Open pit 0.35 20.63 0.46 306 209.19 0.85 5,724 22.90 0.84 615 252.71 0.82 6,645 1 6,0891
Cowal UG 1.5 - - - 22.78 2.55 1,868 14.75 2.43 1,151 37.53 2.50 3,019 1 2,502
Cowal1 Total 20.63 0.46 306 231.97 1.02 7,593 37.65 1.46 1,765 290.24 1.04 9,664 1 8,591
Red Lake3 Total 3.3 - - - 28.09 7.45 6,371 19.72 6.82 4,322 47.81 7.19 11,053 2 -
Mungari1 Open pit 0.5 - - - 37.55 1.19 1,443 6.80 1.35 296 44.36 1.22 1,739 3 1,849
Mungari UG 1.8 0.34 5.09 56 1.78 3.25 187 2.58 2.46 204 4.71 2.95 448 3 560
Mungari1 Total 0.34 5.09 56 39.34 1.29 1,629 9.39 1.66 500 49.07 1.39 2,186 3 2,409
Mt Rawdon1 Total 0.21 7.29 0.34 81 32.91 0.60 630 10.47 0.52 175 50.66 0.54 885 4 1,062
Mt Carlton1 Open pit 0.35 - - - 6.96 0.70 157 2.17 2.56 178 9.12 1.14 335 5 3431
Mt Carlton3 UG 2.55 - - - 0.33 4.26 45 0.08 3.19 7.88 0.40 4.05 52 5 75
Mt Carlton1 Total - - - 7.28 0.86 201 2.24 2.58 186 9.53 1.26 387 5 418
Ernest Henry2 Total 0.9 4.29 0.51 70 45.43 0.61 896 8.98 0.61 177 58.70 0.61 1,143 6 1,288
Marsden Total 0.2 - - - 119.83 0.27 1,031 3.14 0.22 22 122.97 0.27 1,053 1 1,053
Total 32.55 0.49 513 504.85 1.15 18,711 91.59 2.43 7,147 628.99 1.30 26,371 15,167
Data is reported to significant figures to reflect appropriate precision and may not sum precisely due to rounding. Mineral Resources are reported inclusive of Ore Reserves. ‘UG’ denotes underground.
1Includes stockpiles 2 Ernest Henry Operation cut-off 0.9% CuEq 3 Red Lake cut-off is 3.3g/t Au except for Cochenour (3.0g/t Au) and HG Young (3.2g/t Au) deposits
4Group Mineral Resources Competent Person (CP) Notes refer to 1. James Biggam; 2. Dean Fredericksen; 3. Brad Daddow; 4. Tim Murphy; 5. Ben Coutts; 6. Jessica Shiels (Glencore)
5The Mineral Resource for the Mt Carlton A39 underground deposit has been estimated using a AuEq (g/t) cut-off of 4.4g/t to enable quotation of this silver rich deposit as equivalent gold ounces.
The gold equivalent (AuEq) calculation accounts for silver recoveries determined from metallurgical test work and uses an assumed silver price of A$26/oz and gold price of A$2,000/oz as per the below equation.
AuEq=26/2,000*0.8203*silver grade (Silver price/Gold price*silver recovery*silver grade). It is the Competent Persons opinion that the assigned cut-off criteria satisfies the JORC Code requirement that the reported Mineral Resource meets reasonable prospects of eventual
economic extraction and that the silver present within the A39 deposit can be economically recovered.
Full details of the Evolution Mineral Resources and Ore Reserves are provided in the report entitled “Annual Mineral Resources an Ore Reserves Statement” released to the ASX on 17 February 2021 and available to view at www.evolutionmining.com.au
Full details of the Ernest Henry Mineral Resources and Ore Reserves are provided in the report entitled “Glencore Resources and Reserves as at 31 December 2020” released 3 February 2021 and available to view at www.glencore.com.
The Company confirms that it is not aware of any new information or data that materially affects the information included in the Reports and that all material assumptions and parameters underpinning the estimates in the Reports continue to apply and have
not materially changed except for the Cowal Underground. This revised information is provided in ASX release entitled ‘Cowal Underground Board Approval, Red Lake Growth Update and Group Three-year Outlook‘ released on 16 July 2021 and available to
view at www.evolutionmining.com. The Company confirms that the form and context in which the Competent Persons’ findings are presented have not been materially modified from the Reports. Evolution Mining has an economic interest earning rights to
100% of the revenue from future gold production and 30% of future copper and silver produced from an agreed area, and 49% of future gold, copper and silver produced from the Ernest Henry Resource outside the agreed area. The Ernest Henry Resource
is reported here on the basis of economic interest and not the entire mine resource. The above reported figures constitute 77% of the total Ernest Henry gold resource. 17EVOLUTION 2020 GOLD ORE RESERVES
Dec 19
Gold Proved Probable Total Reserve
Reserves
Gold Gold Gold CP4
Tonnes Gold Tonnes Gold Grade Tonnes Gold Gold Metal
Project Type Cut-Off Metal Metal Metal
(Mt) Grade (g/t) (Mt) (g/t) (Mt) Grade (g/t) (koz)
(koz) (koz) (koz)
Cowal1 Open pit 0.45 20.60 0.46 306 104.72 0.96 3,241 125.32 0.88 3,547 1 3,6341
Cowal Underground 1.8 - - - 12.55 2.59 1,045 12.55 2.59 1,045 2
Cowal Total 20.60 0.46 306 117.27 1.14 4,287 137.87 1.04 4,593 4,438
Red Lake3 Total 4.4 - - - 13.16 6.90 2,929 13.16 6.90 2,929 3
Mungari Underground 2.9 - - - 0.30 3.57 35 0.30 3.57 35 4 68
Mungari1 Open pit 0.75 - - - 9.68 1.35 419 9.68 1.35 419 4 500
Mungari1 Total - - - 9.98 1.41 454 9.98 1.41 454 4 568
Mt Rawdon1 Open pit 0.3 4.26 0.41 56 15.82 0.67 342 20.08 0.62 398 5 538
Mt Carlton1 Open pit 0.8 - - - 6.13 0.63 124 6.13 0.63 124 6 2701
Mt Carlton5 Underground 3.2 - - - 0.30 4.52 44 0.30 4.52 44 6 40
Mt Carlton1 Total - - - 6.43 0.81 168 6.43 0.81 168 6 311
Ernest Henry2 Underground 0.9 2.67 0.81 70 29.94 0.47 455 32.62 0.50 525 7 660
Marsden Open pit 0.3 - - - 65.17 0.39 817 65.17 0.39 817 6 817
Total 27.54 0.49 432 257.77 1.14 9,452 285.31 1.08 9,884 6,642
Data is reported to significant figures to reflect appropriate precision and may not sum precisely due to rounding
1Includes stockpiles 2 Ernest Henry Operation cut-off 0.9% CuEq 3Red Lake cut-off is 4.3g/t Au except for Lower Campbell (4.4g/t Au) and Upper Campbell (2.5g/t Au) deposits
4Group Ore Reserve Competent Person (CP) Notes refer to 1. Ryan Kare; 2: Joshua Northfield; 3.Brad Armstrong; 4: Ken Larwood; 5. Thomas Lethbridge; 6. Anton Kruger; 7. Michael Corbett (Glencore)
5The Ore Reserve for the Mt Carlton A39 underground deposit has been estimated using a AuEq (g/t) cutoff of 6.1g/t to enable quotation of this silver rich deposit as equivalent gold ounces.
The gold equivalent (AuEq) calculation accounts for silver recoveries determined from metallurgical test work and uses an assumed silver price of A$20/oz and gold price of A$1,450/oz as per the below equation.
AuEq = 20/1,450*0.8203*silver grade (Silver price/Gold price*silver recovery*silver grade). It is the Competent Persons opinion that the assigned cut-off criteria meets the minimum acceptable criteria to support economic extraction and that the silver present within the A39
deposit can be economically recovered.
Full details of the Evolution Mineral Resources and Ore Reserves are provided in the report entitled “Annual Mineral Resources an Ore Reserves Statement” released to the ASX on 17 February 2021 and available to view at www.evolutionmining.com.au
Full details of the Ernest Henry Mineral Resources and Ore Reserves are provided in the report entitled “Glencore Resources and Reserves as at 31 December 2020” released 3 February 2021 and available to view at www.glencore.com.
The Company confirms that it is not aware of any new information or data that materially affects the information included in the Reports and that all material assumptions and parameters underpinning the estimates in the Reports continue to apply and have
not materially changed except for the Cowal Underground. This revised information is provided in ASX release entitled ‘Cowal Underground Board Approval, Red Lake Growth Update and Group Three-year Outlook‘ released on 16 July 2021 and available to
view at www.evolutionmining.com. The Company confirms that the form and context in which the Competent Persons’ findings are presented have not been materially modified from the Reports. Evolution Mining has an economic interest earning rights to
100% of the revenue from future gold production and 30% of future copper and silver produced from an agreed area, and 49% of future gold, copper and silver produced from the Ernest Henry Resource outside the agreed area. The Ernest Henry Resource
is reported here on the basis of economic interest and not the entire mine resource. The above reported figures constitute 86% of the total Ernest Henry gold reserve 18EVOLUTION 2020 COPPER RESOURCES & RESERVES
Group Copper Mineral Resource Statement
Dec 19
Copper Measured Indicated Inferred Total Resource
Resources
Copper Copper Copper Copper Copper Copper CP3
Tonnes Copper Tonnes Copper Tonnes Tonnes Copper
Project Type Cut-Off Metal Metal Grade Metal Grade Metal
(Mt) Grade (%) (Mt) Grade (%) (Mt) (Mt) Metal (kt)
(kt) (kt) (%) (kt) (%) (kt)
Marsden Total 0.2 - - - 119.83 0.46 553 3.14 0.24 7 122.97 0.46 560 1 560
Ernest Henry2 Total 0.9 1.54 0.93 14 20.20 1.16 234 7.11 1.16 83 28.85 1.15 331 2 356
Mt Carlton1 Open pit 0.35 - - - 1.25 0.29 4 1.04 0.43 5 2.29 0.29 7 3 14
Mt Carlton UG 2.55 - - - 0.33 1.30 4 0.08 1.07 1 0.40 1.25 5 3 4
Mt Carlton1 Total - - - 1.58 0.50 8 1.12 0.48 5 2.69 0.49 13 3 18
Total 1.54 0.93 14 141.61 0.56 794 11.36 0.84 95 154.51 0.58 904 934
Group Copper Ore Reserve Statement
Dec 19
Copper Proved Probable Total Reserve
Reserves
CP3
Copper Copper Copper Copper Copper Copper Copper
Project Type Cut-Off Tonnes (Mt) Tonnes (Mt) Tonnes (Mt)
Grade (%) Metal (kt) Grade (%) Metal (kt) Grade (%) Metal (kt) Metal (kt)
Marsden 0.3 - - - 65.17 0.57 371 65.17 0.57 371 1 371
Ernest Henry2 Total 0.9 0.80 1.49 12 12.94 0.91 117 13.74 0.94 129 2 150
Mt Carlton1 Open pit 1.8 - - - 0.32 0.12 0 0.32 0.12 0 1 10
Mt Carlton Underground 3.2 - - - 0.30 1.40 4 0.30 1.40 4 1 1
Mt Carlton1 Total - - - 0.62 0.74 5 0.62 0.74 5 1 11
Total 0.80 1.49 12 78.73 0.63 493 79.53 0.63 505 532
Group Mineral Resources Competent Person3 (CP) Notes refer to: 1. James Biggam; 2. Jessica Shiels (Glencore); 3 Ben Coutts
Group Ore Reserve Competent Person3 (CP) Notes refer to: 1. Anton Kruger; 2. Michael Corbett (Glencore)
The following notes relate to Tables 3 and 4.Data is reported to significant figures to reflect appropriate precision and may not sum precisely due to rounding. Mineral Resources are reported inclusive of Ore Reserves. Evolution cut-off grades are reported in g/t gold
1 Includes stockpiles. 2 Ernest Henry Operation cut-off 0.9% CuEq
Full details of the Evolution Mineral Resources and Ore Reserves are provided in the report entitled “Annual Mineral Resources an Ore Reserves Statement” released to the ASX on 17 February 2021 and available to view at www.evolutionmining.com.au
Full details of the Ernest Henry Mineral Resources and Ore Reserves are provided in the report entitled “Glencore Resources and Reserves as at 31 December 2020” released 3 February 2021 and available to view at www.glencore.com.
The Company confirms that it is not aware of any new information or data that materially affects the information included in the Reports and that all material assumptions and parameters underpinning the estimates in the Reports continue to apply and have
not materially changed. The Company confirms that the form and context in which the Competent Persons’ findings are presented have not been materially modified from the Reports. Evolution Mining has an economic interest earning rights to 100% of the
revenue from future gold production and 30% of future copper and silver produced from an agreed area, and 49% of future gold, copper and silver produced from the Ernest Henry Resource outside the agreed area. The Ernest Henry Resource is reported
here on the basis of economic interest and not the entire mine resource. The above reported figures constitute 38% of the total Ernest Henry copper resource and 35% of the total Ernest Henry copper reserve.
19ACQUISITION ASSETS RESOURCES & RESERVES
Acquisition Assets Mineral Resource Statement1
Gold Measured Indicated Inferred Total Resource
Gold Gold
Tonnes Gold Grade Tonnes Gold Gold Metal Tonnes Gold Gold Metal Tonnes Gold Metal
Project Metal Grade
(Mt) (g/t) (Mt) Grade (g/t) (koz) (Mt) Grade (g/t) (koz) (Mt) (koz)
(koz) (g/t)
Kundana (100%) 0.59 4.2 80 4.07 4.4 571 3.27 3.8 403 7.93 4.1 1,053
EKJV (51%)2 1.12 6.2 223 2.88 5.2 485 2.06 4.5 295 6.06 5.2 1,003
Carbine (100%) - - - 2.89 2.3 213 1.87 2.9 174 4.76 2.5 387
Total 1.71 5.5 302 9.84 4.0 1,269 7.20 3.8 872 18.83 4.1 2,443
Acquisition Assets Ore Reserve Statement1
Gold Proved Probable Total Reserve
Gold Grade Gold Metal Gold Grade Gold Metal Tonnes Gold Grade Gold Metal
Project Tonnes (Mt) Tonnes (Mt)
(g/t) (koz) (g/t) (koz) (Mt) (g/t) (koz)
Kundana (100%) 0.20 4.8 30 1.34 4.3 184 1.53 4.4 214
EKJV (51%)2 0.66 4.8 101 1.07 5.4 185 1.73 5.1 286
Carbine (100%) - - - 1.24 2.0 78 1.24 2.0 78
Total 0.85 4.8 131 3.65 3.8 447 4.50 4.0 579
(1) Acquisition Assets Mineral Resources and Ore Reserves are provided in Evolution’s ASX announcement entitled ‘Acquisition to elevate Mungari to a cornerstone asset and A$400 million equity raising’ released on 22 July 2021 and available to view at
www.evolutionmining.com.au. Those Mineral Resources and Ore Reserves have been prepared based on Mineral Resource and Ore Reserve estimation criteria using a gold price assumption of A$2,250/oz to estimate Mineral Resources and A$1,750/oz
to estimate Ore Reserves. The Acquisition Assets Mineral Resources and Ore Reserves are expected to be re-estimated as at 31 December 2021 as part of Evolution’s Annual Mineral Resources and Ore Reserves Statement which will be released in
February 2022. Rounding may result in apparent summation differences between tonnes, grade and contained metal content. Ounces are estimates of metal contained in the Ore Reserve and do not include allowances for processing losses
(2) EKJV deposits are 51% interest, except Raleigh and Falcon North which are 50%
The Company confirms that it is not aware of any new information or data that materially affects the information included in the Company’s 22 July 2021 announcement and that all material assumptions and parameters underpinning the estimates in the Report
continue to apply and have not materially changed. The Company confirms that the form and context in which the Competent Persons’ findings are presented have not been materially modified from the Company’s 22 July 2021 announcement.
20You can also read