Digital Press Conference - Health Update Dr K Cloete - Western ...
←
→
Page content transcription
If your browser does not render page correctly, please read the page content below
Digital Press Conference

                                               Health Update

                                                 Dr K Cloete

                                                  25 March 2021

© Western Cape Government 2012 |
Overview

1. Surveillance & Response Update

2. Health platform COVID response

3. Well-being of health care workers

4. Vaccine Roll-out Update

5. Conclusions
Surveillance & Response Update
Integrated testing, case, hospitalisation and mortality trends

             © Western Cape Government 2012 |
Mortality by date of death

           © Western Cape Government 2012 | Go to Insert > Header & Footer > Enter presentation name into footer field   5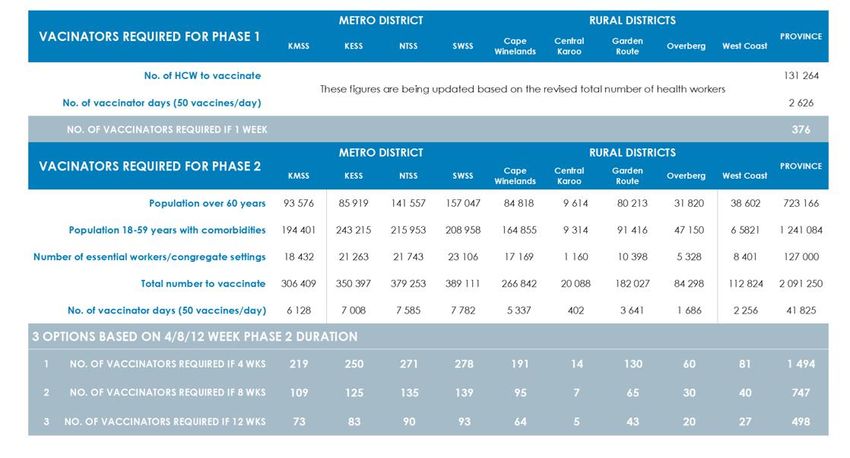
Current reproduction number

              Rt (cases)=0.92

           © Western Cape Government 2012 |
                                              Approximated based on smoothed doubling times
- 22% in last wk
             (12 Mar – 19 Mar)

                    - 21% in last wk                      - 23% in last wk
                 (12 Mar – 19 Mar)                     (12 Mar – 19 Mar)

             •   COVID-19 cases, admissions and deaths in the Western Cape are starting to
                 plateau, but small declines still being seen.
Provincial   •   While the weekly percent decreases in cases, admissions and deaths seem
                 large (21-23%), the actual change is absolute numbers is relatively small.
Overview     •   We are approaching but have not yet reached the situation seen between
                 the first and second waves last year.
             •   The proportion positive is stable at 5.1% on 19 March 2021.
-
       - 13%                                                                            31%

                                               - 20% in last wk
                                            (12 Mar – 19 Mar)

       1%                                                                                - 34%

       - 23%            24%                             - 41%                            0%

                 •   Cases in the Metro decreased by 20% from 12 March to 19 March 2021.
                 •   With relatively small absolute numbers of cases, the percentage increases of
                     cases can vary quite dramatically.
Metro Overview   •   Mitchells Plain is showing an increase in case numbers, related to an outbreak
                     in a hospital ward there that is now contained. Eastern and Tygerberg are
                     unchanged, while the rest of Metro is showing a decline in cases.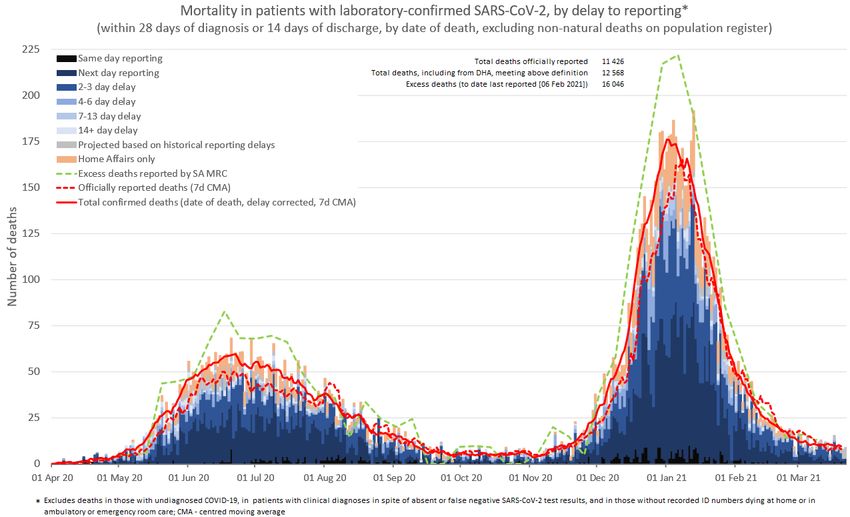
- 15%

                                             - 26% in last wk
                                           (12 Mar – 19 Mar)

        - 33%

        - 17%            - 37%                           - 25%

                 • Cases in Rural have decreased by 26% overall.
                 • All districts in Rural have seen decreases of more than 15%, but the
Rural Overview     absolute numbers are very small.
                 • We continue to watch for and work to contain local outbreaks in all
                   districts, especially over upcoming holiday period.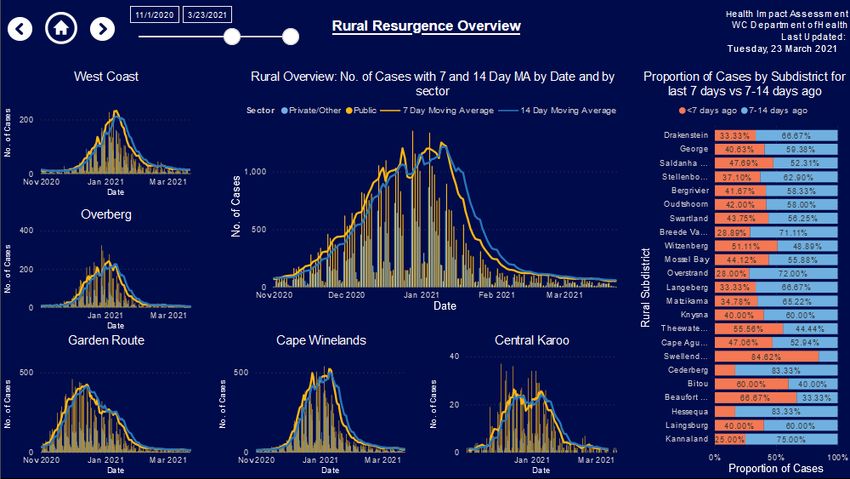
Triangulating with wastewater
                                                                                                                          WEEK 10
                       SAMRC COVID- 19 AND WASTEWATER EARLY WARNING SYSTEM                                                2021
                                                                                                                          update
                                 City of Cape Town, Breede Valley AND Overberg

Metro:
Decrease/sustained low SARS CoV-2 RNA across most treatment
plants with none detected at 18 treatment plants (previously 9).   Breede Valley:
Scottsene decreased.                                               SARS CoV-2 remains low; not detected in Rawsonville & Worcester

Increase in SARS-CoV-2 RNA >1000 copies/ml at:                     Theewaterskloof:
-    Wesfleur Industrial                                           SARS-CoV-2 not detected at any of 4 treatment plants
-    Cape Flats
-    Zandvliet
South Africa and Western Cape – expectations for 3rd wave
1. National MAC technical working group with involvement of WC
epidemiologists
2. 3rd wave is very likely but there remains uncertainty about timing, location
and magnitude of resurgence. This will be driven by:
Change in viral ▪ Seasonality (weather)
transmissibility ▪ Seasonal changes in behaviour (long weekends, funerals, Easter)
▪ People touched by COVID
▪ Restrictions on movement and behaviour (alcohol ban, gatherings etc.)
Behavioural changes in a steep declines in cases & deaths from 28 Dec ’20 (reinstating level 3)
population
▪ Now shift back to Level 1
▪ Contact tracing; Encouraging Q&I
Change in interactions ▪ Between provinces
between weakly connected ▪ Between urban and rural
subpopulations ▪ Between wealthy and poor
Changing immunity / ▪ Evidence of some immunity post infection, but may wane
reinfection risk ▪ Communities hard hit in wave 1, relatively less severe in wave 2
Viral evolution ▪ As with 501Y.V2 variant, other variants may affect viral transmissibility
Speed, uptake & impact of ▪ This will become more evident over the coming weeks and months with
vaccination vaccine rollout in the ProvinceSentinel seroprevalence results Tested residual (“leftover”) convenience samples from patient groups attending health services for non-COVID reasons: • Public sector diabetic HbA1c specimens (Metro 1661; Rural 1000) • Private sector diabetic HbA1c specimens (Metro 1000) • Public sector HIV VL specimens (Metro 1529) • Public sector children (age
Public sector diabetics comparing with previous results

                                  Proportion positive by district (public sector diabetics)
                                        Oct 2020 (n= 3022) & Feb 2021 (n=2661)

                         70%

                         60%
                                                        Diabetic Oct/Nov (public)           Diabetic Feb (public)
                         50%
        Seroprevalence

                         40%

                         30%

                                       226                                                                                 1661
                                                        139              211
                         20%
                                                                                           219
                                                                                                           205
                                                                                                                    2506
                         10%      93                                                 103              40
                                                                   234

                                                   24
                         0%
                               Cape Winelands   Central Karoo    Eden District   Overberg District   West Coast      Metro
                                   District        District                                           District

 Seroprevalence in February ranged from 33% in West Coast to 47% in Cape Town Metro
Metro: different patient groups – February 2021
60%
47%
36%
26%
• Metro public sector seroprevalence higher in PLHIV (60%; range across subdistricts 54-70%)
vs. diabetics (47%; range across subdistricts 37-68%)
• In diabetics seroprevalence increased in 2nd wave by ~20% in all subdistricts, even subdistricts that had >40%
seroprevalence at end of wave 1
• Lower seroprevalence in children in public sector (36%)
• Lowest seroprevalence in private sector diabetics (26%; range across subdistricts 21-48%)Proportion SARS-CoV-2 antibody positive by Metro subdistrict
(Public and private sector diabetics Feb 2021)
Note: No private sector specimens from KhayelitshaProportion SARS-CoV-2 antibody positive by age for different patient groups
(Cape Town Metro; Feb 2021)
70% Diabetics and children females
(public)
Diabetics and children males
60%
(public)
Diabetic females (private)
50%
Diabetic males (private)
Seroprevalence
40%
30%
20%
10%
0%
0-14 15-29 30-44 45-59 60-74 ≥75
Age group in years
• Seroprevalence highest in 30-44 year old group; decreases with increasing age (supports vaccinating elderly)
• In public sector – seroprevalence consistently higher in females vs. males
In summary:
• Substantial variation in community-level susceptibility to resurgence; affluent & rural communities may remain
particularly vulnerable.
• Very few areas/groups had estimated seroprevalence approaching “putative herd immunity threshold” of
approximately 65-70% →most areas are susceptible to at least minor resurgences.Summary of implications for the 3rd wave preparedness
1. High sero-prevalence may provide a measure of protection against a
significant impact in the 3rd wave, but we should still plan for appropriate
mitigation.
2. Low sero-prevalence indicates a risk of potentially a more severe impact in
the 3rd wave, and this should be taken into consideration in planning
mitigation for these areas.
3. Overall, we should plan for additional mitigation in rural districts (especially
West Coast and Overberg), and with the private sector in general.
4. Access to beds with oxygen supply, and specifically access to high-flow
nasal oxygen, will be a key focus for the 3rd wave.
© Western Cape Government 2012 |Recommendations for the holiday period
1. Numerous public holidays coming up where people travel for religious and
family gatherings.
2. These gatherings pose a high risk of being super-spreader events, with
infected people travelling back to different parts of the country, which
could easily lead to a 3rd wave.
3. What can we do to prevent the holiday period causing a 3rd wave?
• Avoid unnecessary inter-provincial travel
• Avoid gatherings:
o Especially with lots of people from different places
o Especially older people or with comorbidities
• If you must gather:
o Keep it small (more people = more risk)
o Keep it short (longer = more risk)
o Keep it outside (indoor = more risk)
o Keep it quiet and don’t sing
• Social distance, ventilate, mask up and hand hygiene if
must travel or gatherMessages for the holiday season: making safer choices
The health platform COVID response
Acute service platform – general comments

1.   Currently 880 COVID patients in our acute hospitals (544 in public hospitals & 336 in private
     hospitals). This excludes PUIs and cases in specialised hospital settings.
2.   COVID hospitalisations have continued to decline; there has however been an increase in
     trauma cases
3.   The Metro hospitals have an average occupancy rate of 86%; George drainage area hospitals
     at 64%; Paarl drainage area hospitals at 72% & Worcester drainage area hospitals at 70%.
4.   Occupancies in COVID beds show Metro hospitals at 15%; George drainage area hospitals at
     16%; Paarl drainage area hospitals at 21%; Worcester drainage area hospitals at 23%.
5.   COVID & PUI cases currently make up 7% of all available acute general hospital capacity in
     both Metro and Rural Regional Hospital drainage areas.
6.   COVID inter-mediate care – the Brackengate Hospital of Hope currently has 27 patients (3 274
     cumulative patients), Freesia & Ward 99 has 4 patients, Mitchell Plain Hospital of Hope has 41
     patients and Sonstraal currently has 1 patient.
7.   The Metro mass fatality centre has capacity for 240 bodies; currently 3 decedents (cumulative
     total of 1377 bodies) admitted. The overall capacity has been successfully managed across the
     province.

                        © Western Cape Government 2012 |
Acute Care Availability & Utilisation per Drainage Area
Operational Bed = an inpatient bed available for inpatient use that is staffed
and equipped.
© Western Cape Government 2012 |Oxygen utilisation – general comments
1. The combined public-private utilisation is now 25.55 tons/day or 36.5 % of the
maximal production capacity (70 tons/day) at the Afrox Western Cape plant.
2. The public sector total bulk oxygen consumption has reduced to 15.13 tons/day
(21.44% of capacity), compared to 51 tons/day in the first week of January.
3. The Western Cape still has 4 bulk oxygen tankers allocated for the daily delivery
of oxygen supplies during the week.
4. We have started to address some of the capacity challenges at facility level, as
identified during the 2nd wave, in preparation for the 3rd wave.
5. We will continue to monitor the utilisation of oxygen over the coming weeks, but
the situation has completely stabilised.
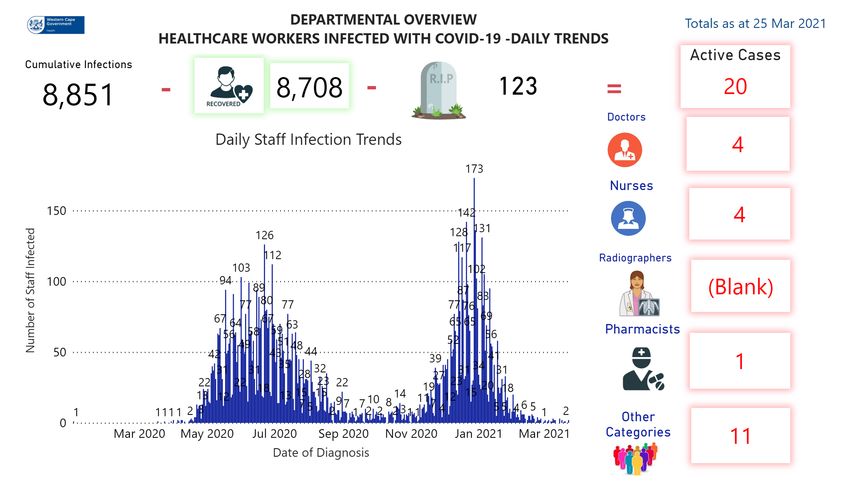
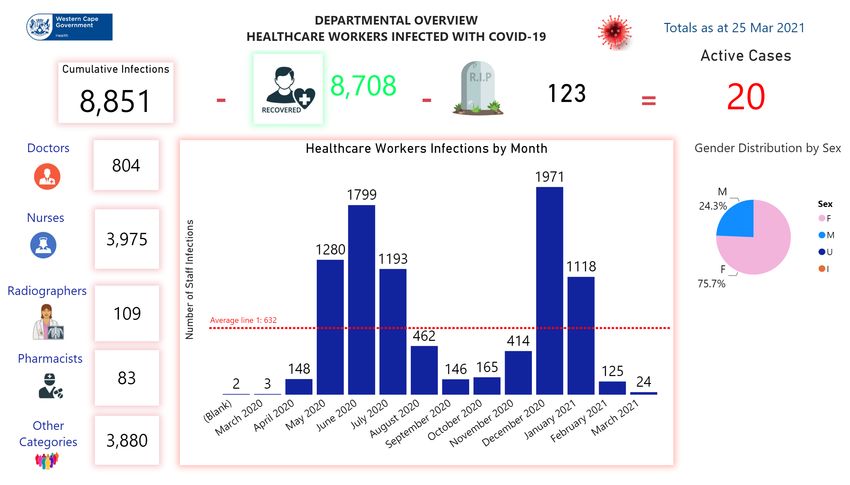
© Western Cape Government 2012 |Safe-guarding the well-being of health
care workers and the health services
© Western Cape Government 2012 |High Level Summary on Recruitment Drive
Number of new entries on the Recruitment Drive
Up until 21 December 2020, a total of
31
438 applications were registered on
27 the Recruitment Drive. The day-on-day
20 registrations are depicted on the
13 12
8 9 11 7578 8 7 75
5 6
10 3 53 3453 4 2
1
5
1211 312 2 3 2 5
2 2 131 3 5
1
0
Possibly Appointed on Institutions have made 31 Offers to the following categories of staff:
Category of HCW Available PERSAL
OSD-Category Rank Filled Reserved Posts Grand Total There are currently 1128 filled
MO 157 26
Allied Health 24 2 26 posts across the platform for
Enrolled Nurse(EN) 96 20 additional COVID posts, 31 offers
Doctors 77 1 78
Enrolled Nursing Auxiliary are pending finalization which
Nursing 852 27 879
(ENA) 111 24
Pharmacists 5 5 will bring the total to 1159. Of the
Not Indicated 33 7 714 Recruitment Drive
Pharmacists-
Professional Nurse 130 61 Assistant 10 10 applicants, 146 has thus far been
Professional Nurse with Social Workers 5 5 appointed on PERSAL. The
Specialty 41 8 Admin and Related 155 1 156 balance of which 568 are
568 146 Grand Total 1128 31 1159
possibly available for
appointment.
27
© Western Cape Gov ernment 2012 |Vaccine Roll-out Update
Vaccine update: Phases and Prioritisation Groups

 Phase I                                           Phase II                Phase III
 • Health Care Workers :                           • Essential Workers     • Older than 18 years
   • Public & Private Health                       • Clients in
     Sectors                                         congregate settings
   • Care Workers                                  • Older than 60 Years
   • CHWs                                          • Older than 18 yrs
   • Health Science students                         with Co-morbidities
   • Traditional Healers
                                                   • Estimated target :    • Estimated target :
 • Estimated target:                                 • 2m                    • 2,9m
   • 132 000

                               ▪ It is anticipated that we will be able to cover 50% of health
                                    care workers with the limited doses being received via the
                                    Sisonke Programme. We support equitable access to staff
                                    from across the service platform, from acute hospitals to
                                    EMS and PHC (incl. CHWs) both within WCGH and CoCT.
                               ▪ We are preparing to scale up vaccination during April to
                                    complete Phase 1 (the remaining 50% of health care
                                    workers), with expected delivery of sufficient Pfizer doses.
                       © Western Cape Government 2012 |
Vaccine Update: J&J Sisonke Programme
1. Since the launch of the J&J Sisonke Programme took place on 17 February 2021 at
Khayelitsha District Hospital, the province is currently in the process of
implementing its third tranche of the vaccines.
2. Each vaccine tranche covers a 2-week period. Thus far the province has
received 3 Tranches:
Tranche 1 Tranche 2 Tranche 3
(17 – 28 (01 – 15 (16 – 28
February): March): March):
13 160 13 068 18 080
3. The total number of doses received thus far: 44 308
4. As at 24 March 2021, a total of 36 098 health care workers have been vaccinated
in the province (public and private sectors).
© Western Cape Government 2012 | Go to Insert > Header & Footer > Enter presentation name into footer field 30Vaccine Update: Sites
Metro Rural
Groote Khayelitsha
Paarl George
Schuur District
Hospital Hospital
Hospital Hospital
Mitchell’s
Tygerberg Worcester Caledon
Plain District
Hospital Hospital Hospital
Hospital
Melomed
Gatesville
(Private)
• Vaccination sites in rural districts service
both the public and private sectors.
• In the Metro, Melomed Gatesville services
the private sector and the public sector
vaccination sites service the public
sector.
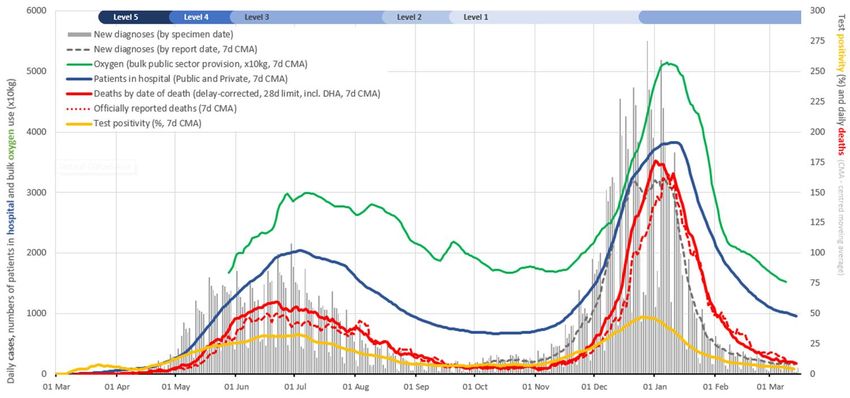
© Western Cape Government 2012 |Vaccine Update: Current Tranche (15 - 28 March 2021)
Tranche 3: 15 - 24 March 2021 (Total: 11 013)
3000
2500
2000
1500
1000
500
0
3/15/2021 3/16/2021 3/17/2021 3/18/2021 3/19/2021 3/23/2021 3/24/2021
GSH TGH KDH MPDH George Worcester Paarl Caledon Gatesville
Highest daily output achieved on 24 March 2021 – 2 808 vaccinations administered
© Western Cape Government 2012 |Vaccinator Database (as at 25 March 2021)
© Western Cape Government 2012 |Phase 2 preparation – targeted to start in May 2021
Global and Local Lessons Learned

   Key Global Lessons:                                                                     Key Lessons from Phase 1

 - High-level leadership                                                                  - Vaccination Site Setup
   & commitment                                                                           - Vaccinator Training
 - Information Systems:                                                                     and Training Updates
   Scheduling /                                                                           - Information Systems
   Appointments,
   Monitoring, Reporting                                                                  - Registration and
                                                                                            Appointment
 - Effective                                                                                Scheduling
   Communications and
   Citizen Engagement                                                                     - People Behaviour
   to obtain buy-in and
   trust                                                                                  - Vaccine Logistics

 - Patient centred, highly                                                                - Governance
   organised and                                                                          - Stakeholder
   efficient logistics                                                                      Interaction

               © Western Cape Government 2012 | Go to Insert > Header & Footer > Enter presentation name into footer field   35
National Supply Pipeline - Accelerating the delivery of the J&J vaccines and securing the
Pfizer vaccines could save >48k lives and relieve pressure on the healthcare system
Supply demand balance (with accelerated J&J supply and Pfizer supply starting in Q2) Accelerated Delivery of Q3 and Q4 J&J doses
Key insights
Vaccine Supply (m doses)
6.7 6.7 6.7 • Accelerating the delivery of J&J
4.4
vaccines from Q3 to Q2 and assuming
3.9 3.9 3.9 3.4
1.1
3.0
1.6 1.6 Pfizer doses are also secured from Q2
1.6 2.5 2.5 2.5
0.3
0.2
1.4 2.3 2.7
1.4 1.4 Pfizer
onwards, the supply deficit required by
0.9 0.9 J&J winter could drop to 3.5m
Feb Mar Apr May Jun Jul Aug Sep Oct Nov Dec Jan
• This will have a significant impact on
Rolling vaccine supply / demand balance in # individuals1 the third wave
0.2
– Up to 40,000 lives saved
-0.2 -0.2 -0.1 -1.1 -2.6
-3.5 -5.9
-7.3
-11.2 -12.6
-9.2 – Up to 200,000 fewer
Feb Mar Apr May Jun Jul Aug Sep Oct Nov Dec Jan hospitalisations1
Incremental deaths expected – More than R8b savings in
93k total expected deaths (Mar-Dec 21) healthcare costs2
44k total expected deaths (Mar-Dec 21)
WAVE 3
36
1 Based on best available data, ~12% of tested positive in high risk population will require hospitalisation, death rate of ~15-18% among the hospitalised
2 Assuming average ~10 days stay per case, at an average cost of ~R4,000 based on a case mix between general ward and ICU in private/public hospitalsVaccine options in SA – SAHPRA approvals Pfizer and J&J - approvals granted by SAHPRA Covishield - approval granted, but roll-out put on hold Moderna – no submission made to SAHPRA yet, and is not imminent before 3rd quarter
Vaccine options in SA – SAHPRA approvals

Sputnik, Sinovac & Sinopharm – submitted applications to SAHPRA, approvals not imminent
Novavax & Bharat Biotech – no applications submitted to SAHPRA yet
Western Cape vaccine acquisition - Update

1. Process followed by acquisition team:
   a)   Standard SCM process followed for all unsolicited bids
   b)   28 individuals/entities contacted to follow-up on specific details
   c)   Each submission will be evaluated accordingly, with due diligence
2. Approaches to suppliers/ manufacturers:
   a)   J&J – replied that they will supply to NDoH at this stage
   b)   Pfizer - replied that they will supply to NDoH at this stage
3. Next steps:
   a)   Continue with targeted RFI process, with view to acquire by August 2021
   b)   Specific follow-up with foreign governments should be explored by DoTP
   c)   Engage with private sector through the existing WCG Public-Private platforms
   d)   Document the liability and no-fault provisions likely, and assess options for
        WCG in this regard
Potential SA portfolio of COVID-19 vaccination sites
NATIONAL TARGET
50/50 sharing Provincial Target
between public
and private
250 000 – 300 000 30 000-36 000
vaccinations per day
Vaccinations per day
sector
Small sites Medium sites Mass Vaccination sites
~90 x ~1 200 = ~110 000 ~300 x ~500 = ~150 000 ~1 000 x ~47 = ~55 000
Vaccinatio Small sites Vaccinations / Vaccinatio Medium sites Vaccinations Vaccinations / L / XL / XXL Vaccinations
ns / day day ns / day / day day sites / day
Pharmacies Community Hospitals Medical Select retail Gyms Hotels / Conference
clinics centres locations retail centers /
GP practices spaces stadiums
© Western Cape Government 2012 |Phase 2 modelling of clients, vaccinators and duration
Need to do 30 000/day to cover phase 2 in 3/12.
© Western Cape Government 2012 | 41Vaccine Site Calculator
Outreach
XXL Site XL Site L site M site S Site team
Assumptions
Expected
2 000 750 500 300 100 50
vaccinations /day
Number of
20 20 20 20 20 12
operating days
Number of
vaccinations 50 50 50 50 30 20
/vaccinator /day
Vaccinators
required per site 40 15 10 6 3 2.5
per day
Projected Total
Number of Sites 4 4 4 4 20 12
Vaccinators /day 160 60 40 24 67 30 381
Vaccinations /day 8 000 3 000 2 000 1 200 2 000 600 16 800
Vaccinations /
160 000 60 000 40 000 24 000 40 000 7 200 331 200
month
© Western Cape Government 2012 | WCG-PPT Slide Gallery-01112012.pptx 42Vaccine Site Planning: Ensuring an Optimal Mix
The choice of vaccination site model depends on the population
distribution, priority groups and projected efficiency.
An optimal mix of sites should be selected.
1. Large: Mass vaccination site (Propose 4-8 Metro+ 4 Rural)
2. Medium: Hospitals, CHCs
3. Small: Outreach team, pharmacies, small PHCs
Provincial Infrastructure Database of WCG and CoCT facilities is available to
inform decision-making and site selection.
© Western Cape Government 2012 | WCG-PPT Slide Gallery-01112012.pptx 43Conclusions
© Western Cape Government 2012 |Concluding remarks 1. Our current situation is one of having navigated and exited a 2nd wave with a clear and consistent decline in cases, hospitalisation and deaths. 2. We move into heightened surveillance vigilance and urge everyone to adhere to protective behaviours to reduce new cases – while in Level 1, especially over the coming holiday period, to avert an early 3rd wave. 3. We have to reflect on our experience over the 1st and 2nd wave to learn and to improve our response for the coming 12 months. 4. We require a concerted whole of government and whole of society response to mitigate the impact of the 3rd wave. 5. We have to significantly scale up the implementation of vaccines over the coming months as the key drive against COVID over the coming months.
Thank you

     © Western Cape Government 2012 |
You can also read