DigitalCommons@University of Nebraska - Lincoln
←
→
Page content transcription
If your browser does not render page correctly, please read the page content below
University of Nebraska - Lincoln
DigitalCommons@University of Nebraska - Lincoln

Library Philosophy and Practice (e-journal)                Libraries at University of Nebraska-Lincoln

Winter 1-21-2021

Analysis of ‘Big Data’ Research Output in IEEExplore : A
Bibliometric Study
Shanmugam Rajeswari
University College of Engineering BIT Campus, Anna University, Trichy., drrajeswari19772009@gmail.com

Praveena Krish
Annamalai University, praviedu@gmail.com

Follow this and additional works at: https://digitalcommons.unl.edu/libphilprac

   Part of the Library and Information Science Commons

Rajeswari, Shanmugam and Krish, Praveena, "Analysis of ‘Big Data’ Research Output in IEEExplore : A
Bibliometric Study" (2021). Library Philosophy and Practice (e-journal). 5000.
https://digitalcommons.unl.edu/libphilprac/5000
Analysis of ‘Big Data’ Research Output in IEEExplore : A Bibliometric Study

                                         Dr. S. Rajeswari,
                                        Assistant Librarian
        University College of Engineering BIT Campus, Anna University, Tiruchirappalli.
                              e-mail : rajee.dlisau2009@yahoo.com
                                                 and
                                          Dr. K. Praveena,
                                        Associate Professor
                        Department of Library and Information Science,
                                      Annamalai University.
                                 e-mail : praviedu@gmail.com

                                            Abstract
        The present study has been taken with the purpose of finding out the growth of literature
of big data research output 3,48,512 articles has been collected from the period 2009-2018 from
the IEEE Xplore and were analyzed to study year wise distribution, form wise distribution and ,
publisher distribution etc.

        Key Words : Big data, Scientometric, Data Analysis, Related Growth Rate and Doubling
time.

Intoduction

        The growth of literature has been normally identified in a given domain using metric
studies specifically bibliometric analysis. A Quantitative measurement of research contributions
is an innovative way of correlating numerous gestures of research revealing trends and is
considered as an aid to map research productivity. These quantitative method in sciences
includes metric studies which are known as bibliometrics in 1960’s, Scientometrics in 1970’sand
informetrics in the midst of 1980’s. The measure of research output has been carried out using
scientometric method.

IEEE
        IEEE, an association dedicated to advancing innovation and technological excellence for
the benefit of humanity, is the world's largest technical professional society. It is designed to
serve professionals involved in all aspects of the electrical, electronic, and computing fields and
related areas of science and technology that underlie modern civilization. IEEE's roots go back to
1884 when electricity began to become a major influence in society. There was one major
established electrical industry, the telegraph, which since the 1840s had come to connect the
world with a data communications system faster than the speed of transportation.
IEEE, pronounced "Eye-triple-E," stands for the Institute of Electrical and Electronics
Engineers. The association is chartered under this name and it is the full legal name. However, as
the world's largest technical professional organization, IEEE's membership has long been
composed of engineers, scientists, and allied professionals. These include computer scientists,
software developers, information technology professionals, physicists, medical doctors, and
many others in addition to IEEE's electrical and electronics engineering core. For this reason the
organization no longer goes by the full name, except on legal business documents, and is referred
to simply as IEEE.
IEEE and its members inspire a global community to innovate for a better tomorrow
through its more than 423,000 members in over 160 countries, and its highly cited publications,
conferences, technology standards, and professional and educational activities. IEEE is the
trusted “voice” for engineering, computing, and technology information around the globe.
About Big Data
The concept of big data itself is relatively new, the origins of large data sets go back to
the 1960s and '70s when the world of data was just getting started, with the first data centers and
the development of the relational database. Around 2005, people began to realize just how
much data users generated through Facebook, YouTube, and other online services. Hadoop (anopen-source framework created specifically to store and analyze big data sets) was developed
that same year.
The development of open-source frameworks, such as Hadoop (and more recently,
Spark) was essential for the growth of big data because they make big data easier to work with
and cheaper to store. In the years since then, the volume of big data has skyrocketed. Users are
still generating huge amounts of data—but it’s not just humans who are doing it. With the
advent of the Internet of Things (IoT) , more objects and devices are connected to the internet,
gathering data on customer usage patterns and product performance. The emergence of machine
learning has produced still more data. While big data has come far, its usefulness is only
just beginning. Cloud computing has expanded big data possibilities even further. The cloud
offers truly elastic scalability, where developers can simply spin up ad hoc clusters to test a
subset of data.
Methodology
The present study has been taken with the purpose of finding out the literature published
on “Big Data”. The IEEE xplore was found to be the most inclusive and suitable source of
literature for the present study. The turn “Big Data” was used to search the articles in IEEE
xplore for retrieving the results. All articles referring to “Big Data” research output during 2009-
2018 were analyzed Various aspect: Year wise distribution , related growth rate and Doubling
time, form wise distribution and publisher wise distribution etc. Finally the analyzed data were
arranged and presented to fulfill the objectives of the study.Objective 1. To find out the year wise research output on Big Data. 2. To analyses the form wise distribution of research output. 3. To identify the Related Growth Rate and Doubling time. 4. To analyses the publisher wise distribution of research output. 5. To examine the growth ratio of research output. Literature Review Ranganathan, A., & Balasubramani, R1. (2014) have investigated Green Energy Research in India as revealed by the scholarly publication indexed in web of science (WoS) for a period of fifteen years from 1999 to 2013. It was seen that the analyses included research growth, author productivity, authorship pattern, Geographical distribution of the literature, citation analysis rank, global publications’ share, citation impact, share of international collaborative papers and major collaborative partner countries and patterns of research communication in most productive journals. It also analyses the characteristics of most productive institutions, authors and high- cited papers. Chaman Sab, M., & Kumar,P2 .(2017) analyzed the research activities of India in biomedicine during 2012–2016. The result shows that a total number of 2712 publications is indexed and there is an insignificant growth in Biomedicine literature published from India. Rajeswari, S., & Praveena , K 3. (2017) conducted the research analysis on the Indian Journal of Library and Information Science from 2012 to 2016 for nearly 194 articles and the found the result that more number of articles published by multi authors. The degree of collaboration among authors is 0.655. The maximum number of articles 22.68% were published in the year 2014. Patel Vimlesh4 (2017) have done and revealed that 202 papers published in the Librarianship and Information Science for the period of 2012 to 2016. He revealed that maximum number of contribution from single authors with 52.97% and top number of publication of articles from England and the average citations per year for study is 53.60 and the highest number of articles published in the year 2013 with 23.76%
BIBLIOMETRIC INDICATORS

Relative Growth Rate

       In order to identify the relative growth rate, the researcher has adopted a model
developed by        Mahapatra5. The relative growth rate is the increase in the number of
publications/pages per unit of time. The mean relative growth rate R (1-2) over a specified
period of interval can be calculated from the following equation.

                       W2 − W1
         R (1 − 2) =
                       T2 − T1

       Where R (1-2) = mean relative growth rate over the specified period of interval;

       W1      = log W1 (Natural log of initial number of publications/pages);

       W2      = log W2 (Natural log of initial number of publications/pages);

       T2-T1 = The unit difference between the initial time and final time.

       The relative growth rate for both publications and pages can be calculated separately.

       Therefore,

        R (a) = Relative growth rate per unit of publications per unit of time (year);

        R (p) = Relative growth rate per unit of pages per unit of time (year)

Doubling Time

       It is also calculated that there is a direct equivalence existing between the relative growth
rate and doubling time. If the number of publication/pages of a subject doubles during a given
period, then the difference between the logarithms of the numbers at the beginning and the end
of the period must be the logarithms of the number 2. If one uses natural logarithms, this
difference has a value of 0.693. Thus, the corresponding doubling time for publications and
pages can be calculated by the following formula:
Doubling time (Dt) = 0.693/ R
Therefore,
Doubling time for publications Dt(a) = 0.693/ R (a)
Doubling time for pages Dt(p) = 0.693/ R p)
Degree of Collaboration
In order to identify the degree of collaboration, the researcher has adopted
K.Subramanyam’s formula6.
The formula is
Nm
C=
Nm + Ns
Where,
C = Degree of collaboration in a discipline
Nm = Number of multiple authored papers
Ns = Number of single authored papersAnalysis
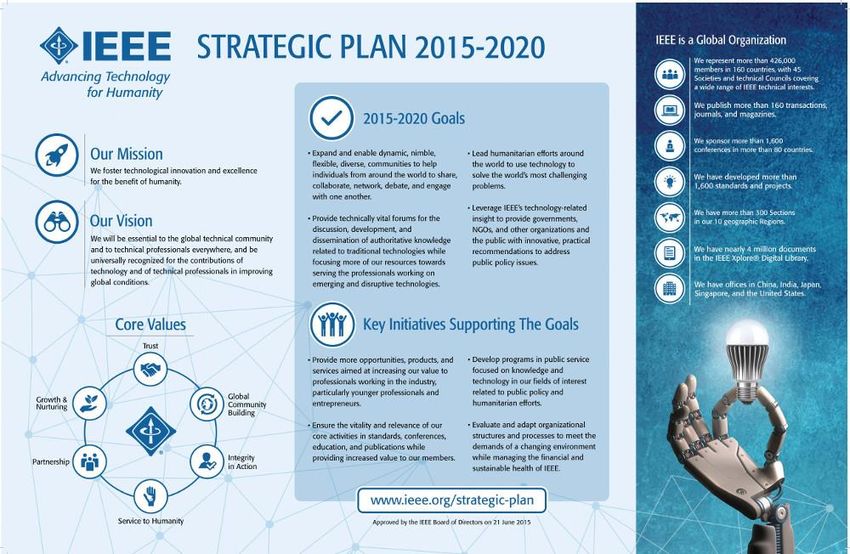
Table : 1
Form wise Distribution
S.No Form of Publication No. of Publication %
1 Conferences 269548 77.34
2 Journals & Magazines 70734 20.30
3 Books 5096 1.46
4 Early Access Articles 2505 0.72
5 Standards 513 0.15
6 Courses 116 0.03
348512 100
Table 1shows that out of 3,48,512 articles 2,69,548 are from conferences in the first
place. Next comes journal & Magazines by 70,734, Followed by the books 5,096, Early Access
Articles 2,505, Standards 513 and Courses 116.
No. of Publication
Conferences
5096
Journals & Magazines
70734
513 Books
3018
2505 Early Access Articles
269548
Standards
CoursesTable : 2
Year wise Distribution of Publication
Year No.of Publication %
2009 30061 8.63
2010 32289 9.26
2011 31032 8.90
2012 28863 8.28
2013 29203 8.38
2014 31105 8.93
2015 35921 10.31
2016 40042 11.49
2017 43154 12.38
2018 46842 13.44
348512 100
Table 2, reveals the year wise research output. The highest research output was 4,68,42 in
the year 2018. The lowest research output was 30,061 in the year 2009 and the table shows that
the research output is in increasing trend.
Table : 3
Related Growth Rate and Doubling time
Year No.of Publication Cumulative w1 w2 RGR Dt
output
2009 30061 30061 - 10.31 - -
2010 32289 62350 10.31 11.04 0.73 0.94
2011 31032 93382 11.04 11.44 0.40 1.73
2012 28863 122245 11.44 11.71 0.27 2.572013 29203 151448 11.71 11.93 0.22 3.15
2014 31105 182553 11.93 12.11 0.18 3.85
2015 35921 218474 12.11 12.29 0.18 3.85
2016 40042 258516 12.29 12.46 0.17 4.08
2017 43154 301670 12.46 12.62 0.16 4.33
2018 46842 348512 12.62 12.76 0.14 4.95
348512
.
It is observed from table 3 the computed value for Related Growth rate and Doubling
Time was clearly proved that the relative growth rate of published articles was declined trend
from 2009-2018. The maximum computed value RGR 0.73 was recorded in the year 2009 and
lowest value 0.14 was recorded in the year 2018. The doubling time shown increasing trend in
the study period.
Table: 4 Year wise Vs Form of Publication
S.No Form of 2009 2010 2011 2012 2013 2014 2015 2016 2017 2018 Total
Publication
1 Conferences 26297 28322 26705 23817 23055 23911 27433 30248 30542 29218 269548
2 Journals & 3309 3491 3839 4450 5573 6571 7831 9163 11971 14536 70734
Magazines
3 Books 370 394 432 529 538 574 636 557 556 510 5096
4 Early - - - - - - - - - 2505 2505
Access
Articles
5 Standards 66 58 39 60 36 30 19 60 81 64 513
6 Courses 19 24 17 7 1 19 2 14 4 9 116
30061 32289 31032 28863 29203 31105 35921 40042 43154 46842 348512
It is observed from table 4 the year wise vs form of publications. The maximum
research out put in the form of conference papers is 30542 in the year 2017, followed byjournal& Magazines is 14536 in the year 2018, and by books is 636 in the year 2015, and early
access articles is 2505 in the year 2018, and standards is 81 in the year 2017 and from courses is
24 in the year 2010.
Table : 5
Distribution of Publisher
S.No Name No.of Publication %
1 • IEEE 335933 96.39
2 IET 6151 1.76
3 MITP 2441 0.70
4 • Wiley 916 0.26
5 • VDE 759 0.22
6 • Morgan & Claypool 422 0.12
7 • SMPTE 410 0.12
8 • SAE 289 0.08
9 • TUP 253 0.07
10 BIAI 240 0.07
11 • now 224 0.06
12 IBM 170 0.05
13 AGU 111 0.03
14 Nokia Bell Labs 73 0.02
15 CSEE 42 0.01
16 • URSI 27 0.007
17 • SAIEE 19 0.005
18 CPSS 16 0.004
19 • CES 9 0.003
20 CMP 7 0.003
348512 100
It is clear from the Table 5 that IEEE.has the maximum research output i.e 335913 and
the minimum research output is 7 in the CMP.
Findings
1. The ratio of growth research output is in increasing trends2. Conference paper type is highest in the form wise distribution of research output
3. The Related growth rate is decreasing trends and Doubling time is increasing trends.
4. The publisher wise distribution of research output is maximum of IEEE.
5. The year wise research output on Big Data is in increasing trend.
Conclusion
Big data has been growing multidisciplinary field of research. Bibliometric study is an
authentic tool to evaluate the development and quality of scientific production. The study is
analyzed year wise, form wise and publisher wise output and related growth rate and doubling
time. The year wise research publication is increasing gradually during the study period.
Reference
1. Ranganathan, A., & Balasubramani, R. (2014). Scientometric Profile of Research
Activities on Green Energy: An Indian Perspective. International Journal of esearch
in Applied, Natural and Social Sciences, 2(1), 23-30.
2. Chaman Sab, M., & Kumar,P.(2017). Mapping of Indian Biomedicine Research: A
Scientometric Analysis of Research Output During 2012 – 2016. Indian Journal of
Information Sources and Services, 7(2), 46-52.
3. Patel Vimlesh(2017) A Bibliometrics Analysis of Contributions to journal of
Librarianship and Information Science during 2012-2016. International Journal of
Information movement , 2(4),158-165.
4. Rajeswari, S., & Praveena , K . (2017). Bibliometric Analysis of Indian Journal of
Library and Information Science. Indian Journal of Library and Information Science
11(2),195-198.
5. Mahapatra, M. (1985) On the validity of the theory of Exponential growth of
scientific literature. proceedings of the 15th IASLIC, Conference, Bangalore. 61-70.
6. Subramanyam, K. (1983) Bibliometric Studies of Research Collaboration A review:
Journal of Information Science , 6, 33-38.You can also read