Discuter de l'impact de COVID-19 sur les Directives Réglementaires récentes (IFRS 9)
←
→
Page content transcription
If your browser does not render page correctly, please read the page content below

Discuter de l'impact de COVID-19 sur les
Directives Réglementaires récentes (IFRS 9)
                                      June 2020
IFRS 9 Challenges in View of COVID-19:
Impact on Provisions and Associated Regulatory Guidance

                                                    June 2020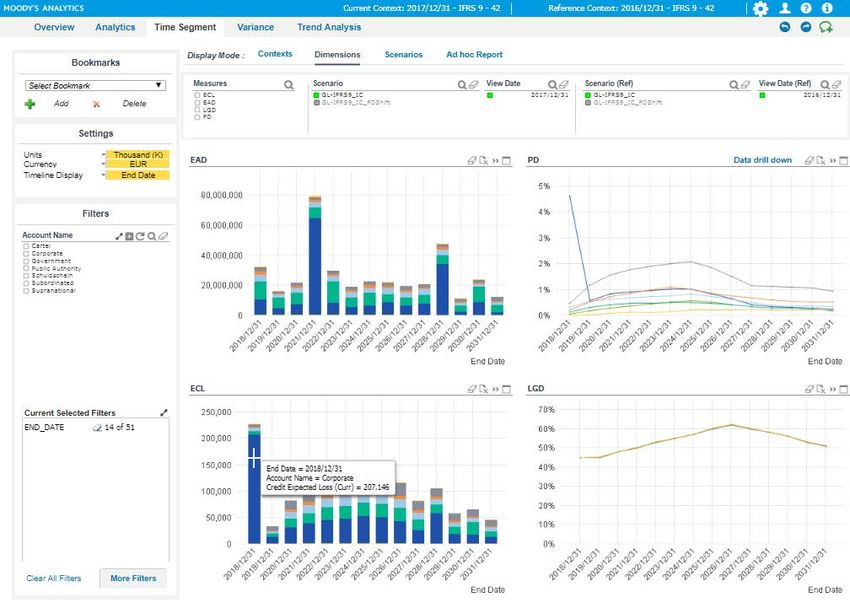
Agenda
1. COVID-19 Impact Benchmark Study
2. Implications and Challenges of the Regulatory Guidance
3. Forecasting Future Period Provisions to Identify Vulnerabilities
   in Portfolio Segments

                                                     IFRS 9 Challenges in View of COVID-19   3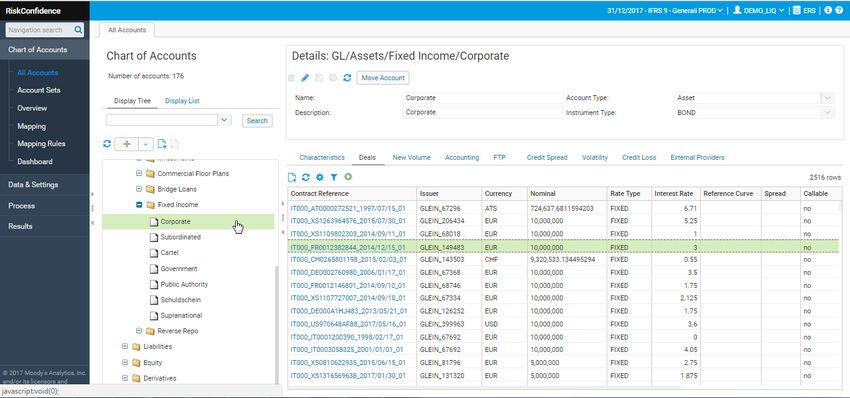
COVID-19 Impact on IFRS 9 Provisions
» COVID-19 is having an unprecedented impact since the Great Depression on global public health, healthcare
  systems, and economy**
» Since the outbreak, the credit risk faced by lending institutions around the world has increased significantly,
  as evidenced in this and other Moody’s studies** for various asset classes. Major banks have reported much
  higher loss allowances in 2020Q1 than 2019Q4
» Due to the extraordinary and uncertain nature of the current environment it is critical to have a timely and
  unbiased assessment of expected losses for credit portfolios
    » We provide COVID-19 impact results on IFRS 9 loss allowances for benchmark commercial and
      industrial (C&I) portfolios consisting of the European, Middle-Eastern, and North American exposures
    » We compare IFRS 9 loss allowances as of 2019Q4 (pre-COVID-19 crisis) with 2020Q1 levels under
      commonly used macroeconomic scenarios
    » In addition, we illustrate how current capital market information can be incorporated in impairment
      assessment, in addition to macroeconomic forecasts

** See http://www.moodys.com/coronavirus for a comprehensive credit risk research library related to the COVID-19 outbreak.

                                                                                                 IFRS 9 Challenges in View of COVID-19   4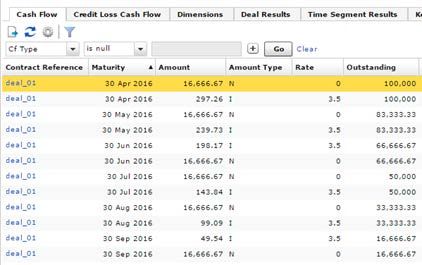
Baseline and Alternative Scenarios
Moody’s Analytics May Forecasts (Released on 18 May, 2020)

                      Key Aspects                    S1 (Upside*)         Baseline           S3 (Downside**)

                Quarantine Measure End                   Mid Q2 2020   End of Q2 2020           Mid Q3 2020

                    Global Recession                         Mild         Moderate                 Severe
                 Global GDP Growth
                                                    -0.9% and 6.1%     -4.2% and 4.3%         -6.5% and 0.4%
                  in 2020 and 2021
              Global Unemployment Rate
                                                   6.14% and 5.91%     6.33% and 6.35%       7.07% and 8.14%
                  in 2020 and 2021
                      Brexit Process                       Efficient      Moderate               Protracted
               Oil Price in 2020 and 2021                $38 and $60     $33 and $55            $20 and $24

* 10% probability that the economy will perform better
** 10% probability that the economy will perform worse

                                                                                         IFRS 9 Challenges in View of COVID-19   5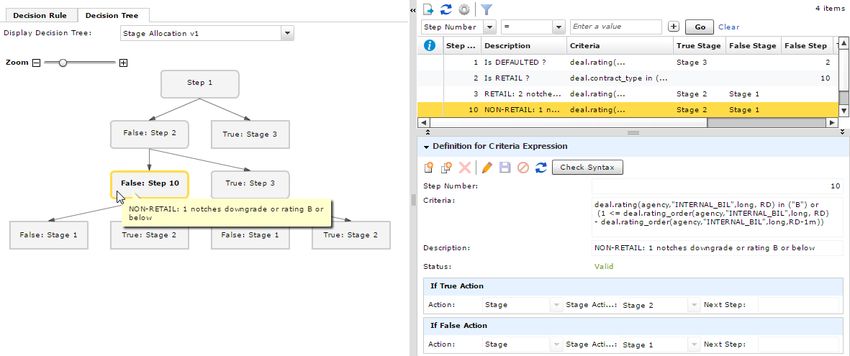
Modeling Framework
                                                 » Forecasts of GDP growth, unemployment rate, equity price
    Macroeconomic Scenario Forecasts               index, oil price, etc.
                                                 » 3 scenarios: baseline, upside (S1), and downside (S3)

                                                 » 40% baseline, 30% upside (S1), 30% downside (S3)
        Scenario Probability Weights

GCorrTM Macro to Calculate Conditional, Point-         Exposure             Discount                Expected
   in-Time PD & LGD + Staging Decisions          X                    X                     =
                                                       at Default            Factor                Credit Loss

Moody’s Analytics Through-the-Cycle (TTC) to     » Produce PIT PD term structures; the underlying PIT PDs are
     Point-in-Time (PIT) PD Converter              from Moody’s Analytics CreditEdgeTM Expected Default
                                                   Frequency (EDF)

                                                 » Through-the-Cycle PD, or external or internal rating
    Default and Recovery Risk Measures           » LGD (assumed=40%)

                                                                           IFRS 9 Challenges in View of COVID-19   6
Benchmarking Methodology
» In this benchmarking study, we calculate Expected Credit Losses (ECLs) of the same
portfolios on two reporting dates:
» 31 Dec, 2019 ECLs based on Moody’s Analytics December 2019 economic forecasts
» 31 Mar, 2020 ECLs based on Moody’s Analytics May 2020 economic forecasts
» Comparing the two sets of results enables an assessment of COVID-19’s impact on the
benchmark portfolios, and segments within
» Note, however, some information used in our models is from time periods before COVID-19
became the dominant concern in public health and future of the economy
» We caution that our analyses are based on diversified benchmark portfolios and Moody’s
Analytics economic scenario forecasts; individual organizations may observe very different
results
IFRS 9 Challenges in View of COVID-19 7C&I Benchmark Portfolios
Outstanding Balance
(% of balance) Year to Maturity Main Industries
Portfolio
(years) (% of balance)
Investment Grade High Yield
Bank and Savings & Loans (43%)
Business Services (15%)
Europe 78% 22% 2.75
Consumer Products Retail/Wholesale (5%)
Agriculture (4%)
Bank and Savings & Loans (18%)
Construction (16%)
Middle East 52% 48% 2.50
Consumer Services (9%)
Utilities NEC (9%)
Bank and Savings & Loans (21%)
Oil Refining (6%)
North America 52% 48% 2.50
Telephone (5%)
Utilities, Gas (5%)
» Loss given default (LGD) is assumed to be 40%
» Due to the lack of information of credit quality at origination, a simple absolute threshold is used in stage
allocation – probability weighted PDs are mapped to Moody’s rating, and B1 or worse are assigned stage 2
IFRS 9 Challenges in View of COVID-19 8Q1
IFRS 9 Challenges in View of COVID-19 9Expected Credit Losses from 2019Q4 to 2020Q1
ECL % Change from 2019 December Scenarios to 2020 May Scenarios
Portfolio
Baseline S1 S3 Scenario Weighted
Europe 87% 101% 14% 51%
Middle East 19% 33% 3% 15%
North America 63% 130% 8% 45%
Changes in ECL Term Structures – European » Results under May scenarios are higher than those under
December scenarios, mainly driven by the significant near-term
700% stress from COVID-19 in the relevant MEVs used in the model
500% » Results of the S3 scenario increased not as much as other
scenarios, driven by the strong recovery under the May S3
300%
scenario in later quarters.
100%
» ECLs under the May scenarios are higher in the first few
-100% quarters, reflecting the near-term stress. The recovery results in
Q1 Q2 Q3 Q4 Q5 Q6 Q7 Q8 lower expected losses in later quarters
Baseline S1 S3
IFRS 9 Challenges in View of COVID-19 10ECL Changes from 2019Q4 to 2020Q1
Changes in ECL Term Structures – Middle East Changes in ECL Term Structures – North America
700%
700%
500%
500%
300%
300%
100% 100%
-100% -100%
Q1 Q2 Q3 Q4 Q5 Q6 Q7 Q8 Q1 Q2 Q3 Q4 Q5 Q6 Q7 Q8
Baseline S1 S3 Baseline S1 S3
» ECL term structures for Middle East and North America under May scenarios share the similar pattern with those for Europe
» Due to the timing of COVID-19 spread across the globe, Middle East has experienced lower impact in its portfolio ECL than
other regions
IFRS 9 Challenges in View of COVID-19 11COVID-19’s Impact on Different Countries
ECL % Change from 2019 December Scenarios to 2020 May Scenarios
Europe
Baseline S1 S3 Scenario Weighted
Spain 559% 665% 152% 311%
Italy 383% 444% 133% 234%
France 345% 320% 134% 214%
Germany 220% 242% 103% 157%
United Kingdom 157% 323% 56% 121%
ECL % Change from 2019 December Scenarios to 2020 May Scenarios
Middle East
Baseline S1 S3 Scenario Weighted
Kuwait 60% 94% 47% 60%
Egypt 58% 85% 25% 49%
Turkey 23% 24% 3% 15%
» Due to the timing of the COVID-19 spread across the globe, Middle Eastern countries have
experienced lower impact in their ECL than other regions
IFRS 9 Challenges in View of COVID-19 12Eurozone, Macroeconomic Variable Projections
Moody’s Analytics Forecasts of Unemployment Rate
13
12
11
10
%
9
8
7
6
Baseline (Dec 2019) Baseline (May 2020) S1 (May 2020) S3 (May 2020)
IFRS 9 Challenges in View of COVID-19 13France, Macroeconomic Variable Projections
Moody’s Analytics Forecasts of GDP Annualized Growth
80
60
40
20
%
0
-20
-40
-60
Baseline (Dec 2019) Baseline (May 2020) S1 (May 2020) S3 (May 2020)
IFRS 9 Challenges in View of COVID-19 14France, Macroeconomic Variable Projections
Moody’s Analytics Forecasts of Equity Index Annualized Growth
100
80
60
40
20
0
%
-20
-40
-60
-80
-100
Baseline (Dec 2019) Baseline (May 2020) S1 (May 2020) S3 (May 2020)
IFRS 9 Challenges in View of COVID-19 15Incorporating More Current Market Condition
» One of the modeling components in generating the results under May scenarios so far – the unconditional PDs from
Moody’s rating to PIT PD converter – uses market information up to Dec 2019
» To incorporate more current market information, we create a new version of the converter using EDFs up to March 31,
2020, and compare with the previous results (i.e., same scenarios, different unconditional PDs)
Region Europe Middle East North America
Scenario Weighted ECL Change 211% 127% 207%
Scenario Weighted Scenario Weighted
Most Affected Industries Least Affected Industries
ECL Change ECL Change
Air Transportation 311% Finance, NEC 31%
Hotels & Restaurant 233% Security Brokers & Dealers 37%
Entertainment & Leisure 195% Real Estate 38%
Oil, Gas & Coal Insurance –
195% 47%
Exploration/Production Property/Casualty/Health
Aerospace & Defense 183% Lessors 55%
Transportation 181% Investment Management 64%
Apparel & Shoes 176% Insurance - Life 69%
Utilities, Gas 175% Real Estate Investments Trust 69%
Broadcast Media 174% Utilities, Electric 72%
Oil Refining 172% Mining 77%
IFRS 9 Challenges in View of COVID-19 16Regulatory Guidance
Additional Regulatory Responses: IFRS 9
– ‘Our expectation is that eligibility for, and use of, the UK government’s policy on the extension of payment holidays should not automatically,
BoE/PRA other things being equal, result in the loans involved being moved into Stage 2 or Stage 3 for the purposes of calculating ECL or trigger a
default under the EU Capital Requirements Regulation (CRR).’
– ‘The EBA calls for flexibility and pragmatism in the application of the prudential framework and clarifies that, in case of debt moratoria, there
ECB/EBA
is no automatic classification in default, forborne, or IFRS 9 status.’
– SICR assessment: relief measures, granted either by public authorities, or by banks on a voluntary basis, should not automatically result in
exposures moving from a 12-month ECL to a lifetime ECL measurement.
– Where banks are able to develop forecasts based on reasonable and supportable information, ECL estimates should reflect the mitigating
BCBS
effect of the significant economic support and payment relief measures.
– While estimating ECL, banks should not apply the standard mechanistically and should use the flexibility inherent in IFRS 9, for example to
give due weight to long-term economic trends.
– SICR assessment: Categorization of exposures into groups based on impact of COVID-19 crisis to determine if “BAU” staging criteria should
be applied.
– Due to the high degree of uncertainty surrounding the economic consequences of the COVID-19 crisis, institutions are not expected to
CBUAE incorporate the updated forecasts into ECL until September 1, 2020.
– Institutions are not required to update model parameters to account for this crisis, instead they are required to adjust inputs, critically assess
model outputs and apply judgmental overlay if needed.
– Institutions have the option to employ add-ons at portfolio or product level to holistically reflect changes in the economic environment.
IFRS 9 Challenges in View of COVID-19 17Q2
IFRS 9 Challenges in View of COVID-19 18Common Questions
Incorporating Regulatory Guidance in IFRS 9 models
PD
» Incorporating / updating market data for PiT PD conversion
» Flexibility of models and incorporating management overlays
» Increased borrower, industry analysis – individual assessment G
» Expectations around short-term and long-term impact of scenarios
O
Scenarios LGD V
» Application of scalars to reflect changed economic
Existing and environment E
anticipated fiscal » Development data (e.g. including last crisis)
R
and monetary » Incorporation of internal / external views
N
policy actions are
EAD A
embedded in the » Payment holidays, payment moratoria
forecast » Model as missed payments or create custom cashflows
N
assumptions C
Staging E
» If payment moratoria are applied, staging rules are not automatically
applied
» Manual overrides, management overlays
IFRS 9 Challenges in View of COVID-19 19Q3
IFRS 9 Challenges in View of COVID-19 20Managing Financial Resources in a Crisis
Challenges for Financial Resource Management in times of emerging and evolving stress
Challenges Needs
» COVID-19 resulted in heightened and more Robust forecasting capabilities in business
frequent analysis and reporting as usual conditions to meet demands during
crisis:
» Constantly scanning evolution of risks and
effects of multiple assumptions » Forecasting analytics for core financial
performance metrics (e.g. IFRS 9)
» Uncertainty due to evolving nature of crisis,
responses from governments and regulators » Assessment at granular level to
identifying vulnerabilities
» Regular, timely, comprehensive forecasting
information on evolving assumptions » Structured and controlled forecasting
process, minimized manual hand-offs
» Significant responsibility on analytical and
reporting groups, (e.g. risk and finance) to » Timely analysis, speed-to-market and
produce forecasts and analyses flexibility to analyze evolving situations
IFRS 9 Challenges in View of COVID-19 21Implementation des normes IFRS9 Eric Leman, Directeur, Moody’s Analytics Juin, 2020
Challenges

» Les principaux challenges rencontrés par les institutions financières sont:
 – La récolte de données granulaires et completes (sur les portefeuilles et les
   contreparties) avec une bonne qualité et dans une base de données robuste
 – La possibilité d’utiliser différents modèles sur ces mêmes données
 – Les ajustements sur les résultats, avec un process d’approbation et une piste
   d’audit
 – L’analyse des résultats, pour les remises comptables et l’étude de variance
 – La connection au système comptable (General Ledger)

                                                                                IFRS9
Le workflow du calcul IFRS9
Le process de calcul des dépréciations

                     Exposition, collatéraux,               Critères de                            Inputs du Management
                     contreparties                          détérioration de crédit
                     Cash Flows

            Data             Calculation         Staging             Analysis         Adjustment            Posting

       12M et Lifetime ECL                  Variance et drill-down                     Extraction vers la
                                                                                            comptabilité

                                                                                                                          IFRS9
Le modèle de données doit se calquer au bilan de
la banque
Structure du bilan
IFRS9L’utilisateur doit avoir accès aux données
Exemple d’un titre
Contract type
More fields with
Issuer information about
coupon, amortizing, etc
Currency
Rating
Maturity Date
Issue date
Bid & Offer price
IFRS9Les contreparties et leurs notations
Pays, secteur économique
d’où dérivent les modèles
Information sur les défauts et
moratoires
Hiérarchie des
contreparties
IFRS9Variables Macro-economiques
Importer les scenarios macro-
économiques
» Sur autant d’indices et time-
series requis par les modèles.
» Les indices peuvent être
transformés par les utilisateurs
ou créés par des formules
IFRS9EAD: Utilisation des Cash flow
» Les cash flows contractuels sont d’abord générés
» Ils peuvent être complétés de modèles comportementaux (remboursements
anticipés, tirages et utilisation des lignes revolvings et cartes de crédit)
Maturity
Effective Interest
Rate (EIR)
Outstanding
Ex: monthly interest
Cash flows générés
cash-flows
Client interest rate
type
Ex: monthly amortizing
Ex: Linear amortizing
IFRS9La fléxibilité sur l’utilisation des modèles est
primordiale
IFRS9PD & LGD Term Structures
Les données peuvent être importées…
Term structures can be
directly imported for
PD/LGD
IFRS9…ou créées dans le système
Une solution flexible pour que les banques calculent la LGD à des dates futures selon leurs propres modèles..
» L'éditeur de formule prend en entrée l'allocation des garanties et les cash flows
» Calcule LGD transaction par transaction, mais plusieurs instruments peuvent partager la même formule
» Peut être construit pour une modélisation LGD plus complexe:
– à quelle date LGD doit-il être généré: l'utilisateur définit les dates de segmentation lors du paramétrage
– comment prévoir EAD: deal.end_balance + 3 * deal.accrued_interest; deal.ead (dt-9M)
– comment prévoir la valeur future des garanties: différentes garanties prennent un indice économique différent
– quelles garanties inclure dans le calcul: if deal.collateral.maturity> = dt
IFRS9Les règles de stagings doivent être claires
Easy definition of rules. For example,
based on a rating downgrade
Decision tree defined for
the stage allocation rules
IFRS9Drill-down sur les résultats granulaires
» Utilisation de
toutes les
dimensions
pour le drill
down
» Création de
tables pivot
IFRS9Comprendre
la variance
d’une date à
une autre
Changement
d’ECL entre 2
périodes, expliqué
par les ‘drivers’:
» Changement de
stage,
» Nouveau
business
» …
IFRS9Eric Leman
eric.leman@moodys.com
linkedin.com/in/ericleman/
moodysanalytics.com© 2020 Moody’s Corporation, Moody’s Investors Service, Inc., Moody’s Analytics, Inc. and/or their licensors and affiliates (collectively, “MOODY’S”). All To the extent permitted by law, MOODY’S and its directors, officers, employees, agents, representatives, licensors and suppliers disclaim liability for any
rights reserved. direct or compensatory losses or damages caused to any person or entity, including but not limited to by any negligence (but excluding fraud, willful
misconduct or any other type of liability that, for the avoidance of doubt, by law cannot be excluded) on the part of, or any contingency within or beyond the
CREDIT RATINGS ISSUED BY MOODY'S INVESTORS SERVICE, INC. AND/OR ITS CREDIT RATINGS AFFILIATES ARE MOODY’S CURRENT control of, MOODY’S or any of its directors, officers, employees, agents, representatives, licensors or suppliers, arising from or in connection with the
OPINIONS OF THE RELATIVE FUTURE CREDIT RISK OF ENTITIES, CREDIT COMMITMENTS, OR DEBT OR DEBT-LIKE SECURITIES, AND information contained herein or the use of or inability to use any such information.
MATERIALS, PRODUCTS, SERVICES AND INFORMATION PUBLISHED BY MOODY’S (COLLECTIVELY, “PUBLICATIONS”) MAY INCLUDE SUCH
CURRENT OPINIONS. MOODY’S INVESTORS SERVICE DEFINES CREDIT RISK AS THE RISK THAT AN ENTITY MAY NOT MEET ITS NO WARRANTY, EXPRESS OR IMPLIED, AS TO THE ACCURACY, TIMELINESS, COMPLETENESS, MERCHANTABILITY OR FITNESS FOR ANY
CONTRACTUAL FINANCIAL OBLIGATIONS AS THEY COME DUE AND ANY ESTIMATED FINANCIAL LOSS IN THE EVENT OF DEFAULT OR PARTICULAR PURPOSE OF ANY CREDIT RATING, ASSESSMENT, OTHER OPINION OR INFORMATION IS GIVEN OR MADE BY MOODY’S IN ANY
IMPAIRMENT. SEE MOODY’S RATING SYMBOLS AND DEFINITIONS PUBLICATION FOR INFORMATION ON THE TYPES OF CONTRACTUAL FORM OR MANNER WHATSOEVER.
FINANCIAL OBLIGATIONS ADDRESSED BY MOODY’S INVESTORS SERVICE CREDIT RATINGS. CREDIT RATINGS DO NOT ADDRESS ANY
OTHER RISK, INCLUDING BUT NOT LIMITED TO: LIQUIDITY RISK, MARKET VALUE RISK, OR PRICE VOLATILITY. CREDIT RATINGS, NON- Moody’s Investors Service, Inc., a wholly-owned credit rating agency subsidiary of Moody’s Corporation (“MCO”), hereby discloses that most issuers of debt
CREDIT ASSESSMENTS (“ASSESSMENTS”), AND OTHER OPINIONS INCLUDED IN MOODY’S PUBLICATIONS ARE NOT STATEMENTS OF securities (including corporate and municipal bonds, debentures, notes and commercial paper) and preferred stock rated by Moody’s Investors Service, Inc.
CURRENT OR HISTORICAL FACT. MOODY’S PUBLICATIONS MAY ALSO INCLUDE QUANTITATIVE MODEL-BASED ESTIMATES OF CREDIT RISK have, prior to assignment of any credit rating, agreed to pay to Moody’s Investors Service, Inc. for credit ratings opinions and services rendered by it fees
AND RELATED OPINIONS OR COMMENTARY PUBLISHED BY MOODY’S ANALYTICS, INC. AND/OR ITS AFFILIATES. MOODY’S CREDIT RATINGS, ranging from $1,000 to approximately $2,700,000. MCO and Moody’s investors Service also maintain policies and procedures to address the independence
ASSESSMENTS, OTHER OPINIONS AND PUBLICATIONS DO NOT CONSTITUTE OR PROVIDE INVESTMENT OR FINANCIAL ADVICE, AND of Moody’s Investors Service credit ratings and credit rating processes. Information regarding certain affiliations that may exist between directors of MCO
MOODY’S CREDIT RATINGS, ASSESSMENTS, OTHER OPINIONS AND PUBLICATIONS ARE NOT AND DO NOT PROVIDE RECOMMENDATIONS and rated entities, and between entities who hold credit ratings from Moody’s Investors Service and have also publicly reported to the SEC an ownership
TO PURCHASE, SELL, OR HOLD PARTICULAR SECURITIES. MOODY’S CREDIT RATINGS, ASSESSMENTS, OTHER OPINIONS AND interest in MCO of more than 5%, is posted annually at www.moodys.com under the heading “Investor Relations — Corporate Governance — Director and
PUBLICATIONS DO NOT COMMENT ON THE SUITABILITY OF AN INVESTMENT FOR ANY PARTICULAR INVESTOR. MOODY’S ISSUES ITS Shareholder Affiliation Policy.”
CREDIT RATINGS, ASSESSMENTS AND OTHER OPINIONS AND PUBLISHES ITS PUBLICATIONS WITH THE EXPECTATION AND
UNDERSTANDING THAT EACH INVESTOR WILL, WITH DUE CARE, MAKE ITS OWN STUDY AND EVALUATION OF EACH SECURITY THAT IS Additional terms for Australia only: Any publication into Australia of this document is pursuant to the Australian Financial Services License of MOODY’S
UNDER CONSIDERATION FOR PURCHASE, HOLDING, OR SALE. affiliate, Moody’s Investors Service Pty Limited ABN 61 003 399 657AFSL 336969 and/or Moody’s Analytics Australia Pty Ltd ABN 94 105 136 972 AFSL
383569 (as applicable). This document is intended to be provided only to “wholesale clients” within the meaning of section 761G of the Corporations Act
MOODY’S CREDIT RATINGS, ASSESSMENTS, OTHER OPINIONS, AND PUBLICATIONS ARE NOT INTENDED FOR USE BY RETAIL INVESTORS 2001. By continuing to access this document from within Australia, you represent to MOODY’S that you are, or are accessing the document as a
AND IT WOULD BE RECKLESS AND INAPPROPRIATE FOR RETAIL INVESTORS TO USE MOODY’S CREDIT RATINGS, ASSESSMENTS, OTHER representative of, a “wholesale client” and that neither you nor the entity you represent will directly or indirectly disseminate this document or its contents to
OPINIONS OR PUBLICATIONS WHEN MAKING AN INVESTMENT DECISION. IF IN DOUBT YOU SHOULD CONTACT YOUR FINANCIAL OR OTHER “retail clients” within the meaning of section 761G of the Corporations Act 2001. MOODY’S credit rating is an opinion as to the creditworthiness of a debt
PROFESSIONAL ADVISER. obligation of the issuer, not on the equity securities of the issuer or any form of security that is available to retail investors.
ALL INFORMATION CONTAINED HEREIN IS PROTECTED BY LAW, INCLUDING BUT NOT LIMITED TO, COPYRIGHT LAW, AND NONE OF SUCH Additional terms for Japan only: Moody's Japan K.K. (“MJKK”) is a wholly-owned credit rating agency subsidiary of Moody's Group Japan G.K., which is
INFORMATION MAY BE COPIED OR OTHERWISE REPRODUCED, REPACKAGED, FURTHER TRANSMITTED, TRANSFERRED, DISSEMINATED, wholly-owned by Moody’s Overseas Holdings Inc., a wholly-owned subsidiary of MCO. Moody’s SF Japan K.K. (“MSFJ”) is a wholly-owned credit rating
REDISTRIBUTED OR RESOLD, OR STORED FOR SUBSEQUENT USE FOR ANY SUCH PURPOSE, IN WHOLE OR IN PART, IN ANY FORM OR agency subsidiary of MJKK. MSFJ is not a Nationally Recognized Statistical Rating Organization (“NRSRO”). Therefore, credit ratings assigned by MSFJ
MANNER OR BY ANY MEANS WHATSOEVER, BY ANY PERSON WITHOUT MOODY’S PRIOR WRITTEN CONSENT. are Non-NRSRO Credit Ratings. Non-NRSRO Credit Ratings are assigned by an entity that is not a NRSRO and, consequently, the rated obligation will not
qualify for certain types of treatment under U.S. laws. MJKK and MSFJ are credit rating agencies registered with the Japan Financial Services Agency and
MOODY’S CREDIT RATINGS, ASSESSMENTS, OTHER OPINIONS AND PUBLICATIONS ARE NOT INTENDED FOR USE BY ANY PERSON AS A their registration numbers are FSA Commissioner (Ratings) No. 2 and 3 respectively.
BENCHMARK AS THAT TERM IS DEFINED FOR REGULATORY PURPOSES AND MUST NOT BE USED IN ANY WAY THAT COULD RESULT IN THEM
BEING CONSIDERED A BENCHMARK. MJKK or MSFJ (as applicable) hereby disclose that most issuers of debt securities (including corporate and municipal bonds, debentures, notes and
commercial paper) and preferred stock rated by MJKK or MSFJ (as applicable) have, prior to assignment of any credit rating, agreed to pay to MJKK or
All information contained herein is obtained by MOODY’S from sources believed by it to be accurate and reliable. Because of the possibility of human or MSFJ (as applicable) for credit ratings opinions and services rendered by it fees ranging from JPY125,000 to approximately JPY250,000,000.
mechanical error as well as other factors, however, all information contained herein is provided “AS IS” without warranty of any kind. MOODY'S adopts all
necessary measures so that the information it uses in assigning a credit rating is of sufficient quality and from sources MOODY'S considers to be reliable MJKK and MSFJ also maintain policies and procedures to address Japanese regulatory requirements.
including, when appropriate, independent third-party sources. However, MOODY’S is not an auditor and cannot in every instance independently verify or
validate information received in the rating process or in preparing its Publications.
To the extent permitted by law, MOODY’S and its directors, officers, employees, agents, representatives, licensors and suppliers disclaim liability to any
person or entity for any indirect, special, consequential, or incidental losses or damages whatsoever arising from or in connection with the information
contained herein or the use of or inability to use any such information, even if MOODY’S or any of its directors, officers, employees, agents, representatives,
licensors or suppliers is advised in advance of the possibility of such losses or damages, including but not limited to: (a) any loss of present or prospective
profits or (b) any loss or damage arising where the relevant financial instrument is not the subject of a particular credit rating assigned by MOODY’S.
IFRS9You can also read