Disrupting Education? Experimental Evidence on Technology-Aided Instruction in India - BREAD
←
→
Page content transcription
If your browser does not render page correctly, please read the page content below
Disrupting Education? Experimental Evidence on
               Technology-Aided Instruction in India∗

 Karthik Muralidharan†                     Abhijeet Singh‡                        Alejandro J. Ganimian§
    UC San Diego                      University College London                           J-PAL

                                              January 23, 2017

                                                    Abstract

           We present experimental evidence on the impact of a technology-aided after-school
       instruction program on learning outcomes in middle school grades in urban India, using a lottery
       that provided students with a voucher to cover program costs. A key feature of the program was
       its ability to individually customize educational content to match the level and rate of progress
       of each student. We find that lottery winners had large increases in test scores of 0.36σ in
       math and 0.22σ in Hindi over just a 4.5-month period. IV estimates suggest that attending the
       program for 90 days would increase math and Hindi test scores by 0.59σ and 0.36σ respectively.
       We find similar absolute test score gains for all students, but the relative gain was much greater
       for academically-weaker students because their rate of learning in the control group was close
       to zero. We show that the program was able to effectively cater to the very wide variation in
       student learning levels within a single grade by precisely targeting instruction to the level of
       student preparation. The program was highly cost-effective, both in terms of productivity per
       dollar and unit of time. Our results suggest that well-designed technology-aided instruction
       programs can sharply improve productivity in delivering education.

JEL codes: C93, I21, J24, O15

Keywords: computer-aided learning, productivity in education, personalized learning, teaching at
the right level, post-primary education, middle school, secondary school
   ∗
      We thank Abhijit Banerjee, Peter Bergman, Prashant Bharadwaj, Gordon Dahl, Roger Gordon, Heather Hill,
Priya Mukherjee, Chris Walters and several seminar participants for comments. We thank the staff at Educational
Initiatives (EI)—especially, Pranav Kothari, Smita Bardhan, Anurima Chatterjee, and Prasid Sreeprakash—for their
support of the evaluation. We also thank Maya Escueta, Smit Gade, Riddhima Mishra, and Rama Murthy Sripada
for excellent research assistance and field support. Finally, we thank J-PAL’s Post-Primary Education initiative for
funding this study. The operation of Mindspark centers by EI was funded by the Central Square Foundation, Tech
Mahindra Foundation and Porticus. All views expressed are those of the authors and not of any of the institutions
they are affiliated with.
    †
      Dept. of Economics, University of California San Diego (UCSD); NBER; J-PAL. E-mail: kamurali@ucsd.edu.
    ‡
      Dept. of Economics, University College London (UCL). E-mail: abhijeet.singh@ucl.ac.uk.
    §
      Abdul Latif Jameel Poverty Action Lab (J-PAL); E-mail: aganimian@povertyactionlab.org.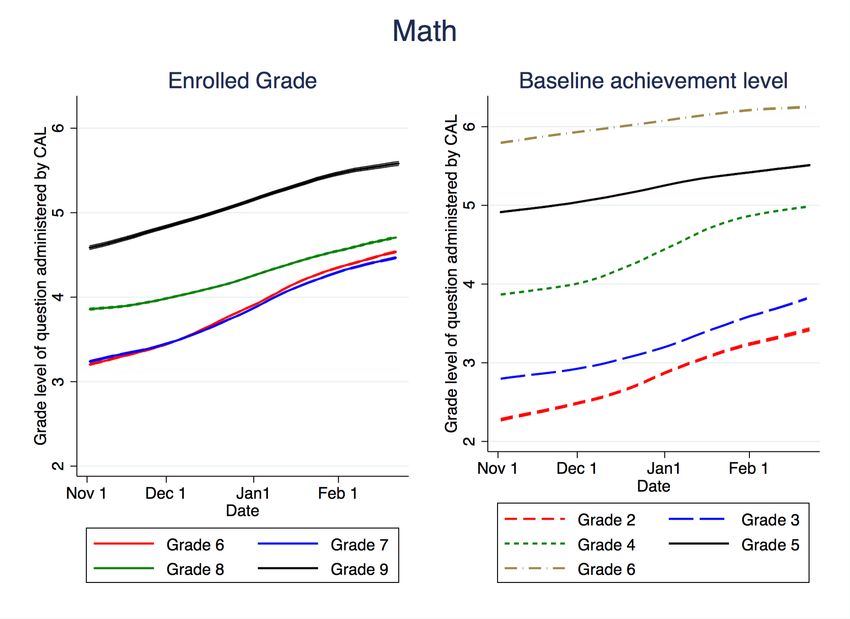
1       Introduction
Developing countries have made impressive progress in improving school enrollment and
completion in the last two decades. Yet, their productivity in converting education investments
of time and money into human capital remains very low. For instance, in India, over 60% of
children aged 6-14 cannot read at the second grade level, despite primary school enrollment
rates over 95% (ASER, 2014). Further, there have been very limited improvements in learning
outcomes in the past decade despite substantial increases in education spending in this period
(Muralidharan, 2013). More generally, even in developed countries, productivity growth
in the education sector lags the rest of the economy, perhaps because the ‘technology’ of
schooling (classroom-based instruction) has changed very little over time compared to rapid
technological progress in other fields (Bosworth, 2005; Pritchett, 2013).
Thus, it is not surprising that increasing the use of technology in instruction is seen as a leading
candidate for ‘disrupting’ the status quo and improving productivity in education (Negroponte
et al., 2006; Khan, 2012; Mead, 2016).1 Yet, the evidence to date appears rather mixed:
A recent review of evidence from high-quality studies on the impact of using technology in
education globally reports “mixed evidence with a pattern of null results” (Bulman and Fairlie,
2016). Overall, the evidence thus far suggests that realizing the potential of technology-aided
education to improve education will require paying careful attention to the details of the
specific intervention, and the extent to which it alleviates binding constraints to learning.
In this paper, we present experimental evidence on the impact of a technology-led instructional
program (called Mindspark) that aimed to leverage technology to improve education by paying
sustained attention to such design details. Developed by a leading Indian education firm, the
Mindspark software reflects over 10 years of product development; it has been used by over
400,000 students, has a database of over 45,000 test questions, and administers over a million
questions across its users every day. A key feature of the software is its ability to use these
data to finely benchmark the learning level of every student and dynamically customize the
material being delivered to match the level and rate of progress made by each individual
student. A second noteworthy feature is its ability to analyze these data to identify patterns
of student errors, and precisely target content to alleviate conceptual ‘bottlenecks’ that may
be difficult for teachers to diagnose or address at the individual student level in a classroom
setting. Mindspark can be delivered in a variety of settings (in schools, in after-school centers,
or through self-guided study); it is platform-agnostic (can be deployed through computers,
tablets, or smartphones); and it can be used both online and offline.
    1
    A non-exhaustive list of posited channels of impact include using technology to consistently deliver
high-quality content that may circumvent limitations in teachers’ own knowledge; delivering engaging (often
game-based) interactive content that may improve student attention; delivering individually customized
content for students; reducing the lag between students attempting a problem and receiving feedback; and,
analyzing patterns of student errors to precisely target content to clarify specific areas of misunderstanding.

                                                      1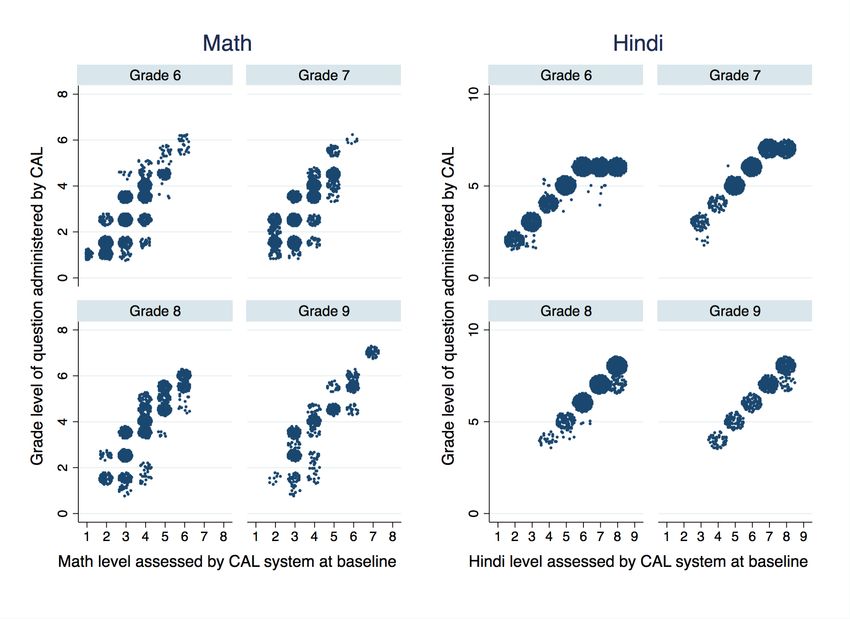
We evaluate the after-school Mindspark centers in this paper. The centers scheduled six days
of instruction per week, for 90 minutes per day; each session was divided into 45 minutes
of individual self-driven learning on the Mindspark software and 45 minutes of instructional
support from a teaching assistant in groups of 12-15 students.2 The centers aimed to serve
students from low-income neighborhoods in Delhi, and charged a modest fee.3 Our evaluation
was carried out in a sample of 619 students recruited for the study from public middle schools
in Delhi. Around half of these students were randomly selected to receive a voucher offering
free attendance at the centers. We measure program impacts using independently-conducted
paper-and-pencil tests of student learning in math and Hindi (language) before and after the
4.5-month long intervention. These tests were linked using item response theory (IRT) to be
comparable on a common scale across both rounds of testing and across different grades.
We report five main sets of results. First, the dynamic computer-based assessments allow us to
provide a more granular description of student learning levels, their distribution within grades,
and their evolution over grades than the literature to date. Using these data, we show that
student learning levels in our sample are several grade-levels behind their grade-appropriate
standard, and that this gap grows by grade. The average grade 6 student is around 2.5 grade
levels below sixth grade standards in Math; by grade 9, this deficit increases to 4.5 grade levels.
Thus, the default of classroom instruction based on grade-appropriate textbooks is likely to be
considerably above the preparation level of most students (especially the lower-achieving ones).
Consistent with this, we find that the absolute value-added on our independently-administered
tests is close to zero for the bottom-third of students in the control group, and we cannot reject
that these students made no academic progress through the school year.
Second, we find that students winning a program voucher scored 0.36σ higher in math and
0.22σ higher in Hindi relative to students who applied for but did not win the lottery. Relative
to the control group, lottery winners experienced twice the test score value-added in math
and 2.5 times that in Hindi during the study period of 4.5 months. These are intent-to-treat
estimates reflecting an average attendance rate of 58%. Using the lottery as an instrumental
variable for attendance (and additional assumptions discussed in Section 4.6), we estimate
that attending the Mindspark centers for 90 days (which corresponds to 80% attendance for
half a school year), would raise math and Hindi test scores by 0.59σ and 0.36σ respectively.
   2
      The teaching assistant focused on helping students with completing homework and with exam preparation,
while the instruction was mostly provided by the Mindspark software.             Our results may therefore
under-estimate the full-potential impact of 90-minutes of “blended” technology-aided learning because teacher
time was not optimized for instruction (see sections 2.1.1 and 5.2 for details).
    3
      The online and school-based models require fees that are not affordable for low-income families. The
Mindspark centers were set up with philanthropic funding to make the platform more widely accessible, and
were located in low-income neighborhoods. However, the funders preferred that a (subsidized) fee be charged,
reflecting a widely-held view among donors that cost-sharing is necessary to avoid wasting subsidies on those
who will not value or use the product (Cohen and Dupas, 2010). The subsidized fee of Rs. 200 per month
(USD 3 per month) was benchmarked to that charged by providers of private tutoring in the vicinity.

                                                     2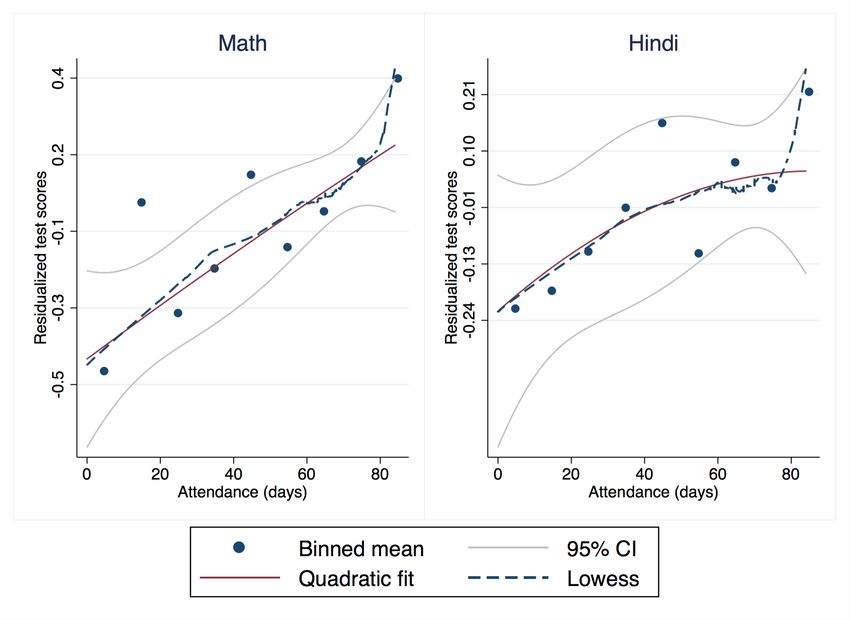
Third, we find that the impact of winning a voucher does not vary significantly by baseline
test scores, gender, or household socioeconomic status. Thus, consistent with the promise
of customized technology-led instruction, the intervention was equally effective at improving
test scores for all students. However, while the absolute impact was similar at all parts of
the initial test score distribution, the relative impact was much greater for weaker students
because the ‘business as usual’ rate of progress in the control group was close to zero for
students in the lower third of the initial test score distribution.
Fourth, using detailed electronic records of every question presented to students in the
treatment group by the Mindspark software, we document that: (a) there is considerable
variation in students’ initial preparation for grade-appropriate work, with students enrolled
in the same grade typically spanning five to six grade levels in their readiness; and (b) the
software targets instruction very precisely to each student’s learning level, and updates this
targeting in response to changes in student learning. Thus, the ability of the software to
handle the heterogeneity in student preparedness spanning several grades appears to be an
important (though not exclusive) mechanism of impact.
Fifth, the program was highly cost effective. The test score value-added in the treatment
group (even based on ITT estimates) was over 100% greater than that in the control group,
and was achieved at a lower expenditure per student than incurred in the public schooling
system. Our results are particularly striking when considered in terms of productivity per unit
of time. For instance, Muralidharan (2012) finds that providing individual-level performance
bonuses to teachers in India led to test score gains of 0.54σ and 0.35σ in math and language
for students exposed to the program for five years. This is one of the largest effect sizes seen
to date in an experimental study on education in developing countries. Yet, we estimate that
regularly attending Mindspark could yield similar gains in one tenth the time (half a year).
Our first contribution is to the literature on computer-aided learning (CAL), where the
evidence to date has often been characterized as mixed (Bulman and Fairlie, 2016).
Nevertheless, our reading of the evidence suggests that some clear patterns are starting to
emerge (see Appendix B for our synthesis). Hardware-focused interventions that provide
computers at home or at school seem to have no positive impact on learning outcomes (Angrist
and Lavy, 2002; Barrera-Osorio and Linden, 2009; Beuermann et al., 2015; Cristia et al., 2012;
Malamud and Pop-Eleches, 2011).4 Pedagogy-focused CAL programs that allow students
to review grade-appropriate content at their own pace do better, but the gains are modest
and range from 0.1σ to 0.2σ.5 Finally, interventions that use technology to also personalize
instruction seem to deliver substantial gains. For instance, Banerjee et al. (2007) find math
   4
      These disappointing results are likely explained by the fact that hardware-focused interventions have done
little to change instruction, and at times have crowded out student time for independent study.
    5
      See, for example, Carrillo et al. (2010); Lai et al. (2015a, 2013, 2012); Linden (2008); Mo et al. (2014b);
Barrow et al. (2009); Rouse and Krueger (2004). Anecdotal evidence suggests that pedagogy-focused CAL

                                                       3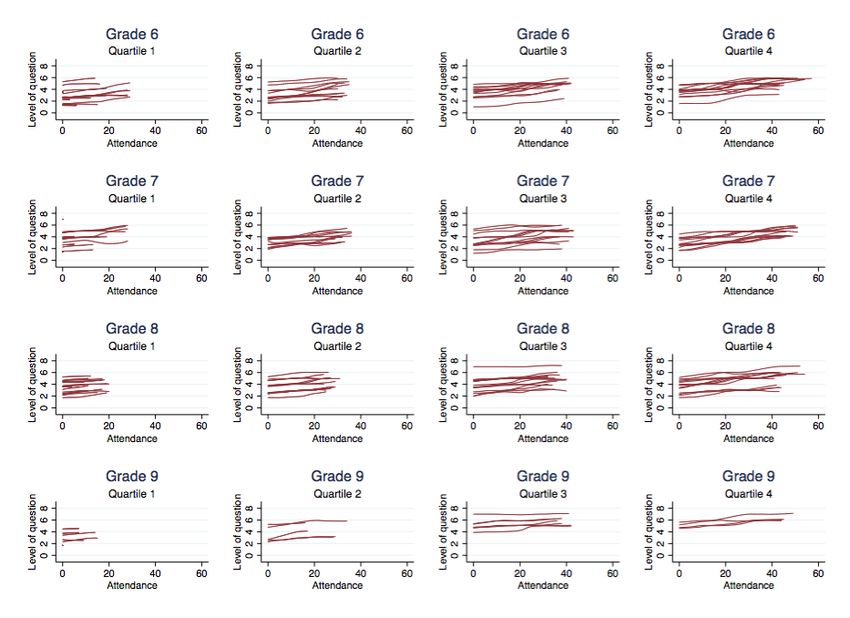
test score gains of 0.47σ in two years from a CAL program that allowed some personalization.
Our results finding large test-score gains for voucher winners, combined with question-level
data showing how the Mindspark software addressed the considerable heterogeneity in student
preparation are consistent with this idea, and suggest that personalization may be a key
ingredient for achieving the full potential of technology-aided instruction.
Second, we contribute three key facts to the literature on education in developing countries.
Prior work has posited with indirect evidence that a likely reason for low education
productivity in these settings may be the combination of curricula designed for high-achieving
students, increasing heterogeneity in student preparation resulting from rapid expansion of
education access, and curricular instruction therefore being at a level and pace that may be too
high for most students (Glewwe et al., 2009; Banerjee and Duflo, 2012; Pritchett and Beatty,
2015). We provide direct evidence in support of this hypothesis by documenting (a) large gaps
between student preparation and grade-level standards that grow by grade, (b) considerable
heterogeneity in student preparation in the same grade, and (c) a lack of progress in learning
under the status quo for students with low initial learning levels.
Third, we contribute to the evidence on policy options to address the challenge of variation
in student preparation. The most promising approaches to date have involved either explicit
tracking of early grade classrooms (Duflo et al., 2011) or grouping primary school students by
their level of preparation and teaching them basic skills (Banerjee et al., 2007, 2016). However,
it is not clear if this approach can be extended to secondary grades where the content is
more advanced and complex, and the heterogeneity in student preparation is much higher
(exacerbated by “automatic grade promotion” policies in many countries). These conditions
of large variation in within-classroom student preparation make the effective delivery of any
curriculum challenging even for highly motivated and trained teachers (in both developed and
developing countries), and our results suggest that personalized technology-aided instruction
may be a promising option for improving student learning in such settings.
Finally, our results speak more broadly to the potential for new technologies to enable
low-income countries to leapfrog constraints to development. Examples from other sectors
include the use of mobile telephones to circumvent the lack of formal banking systems (Jack
and Suri, 2014), the use of electronic voting machines for better enfranchisement of illiterate
citizens in democracies (Fujiwara, 2015) and the use of biometric authentication to circumvent
literacy constraints to financial inclusion (Muralidharan et al., 2016). Our results point to
the possibility that technology-aided instruction could help accelerate the improvement of
education quality in developing countries, by enabling them to circumvent constraints to
human capital creation in low-income settings such as low teacher and parent human capital.
interventions have typically focused on grade-appropriate content in response to schools’ and teachers’
preference for CAL software to map into the topics being covered in class and reinforce them.

                                                  4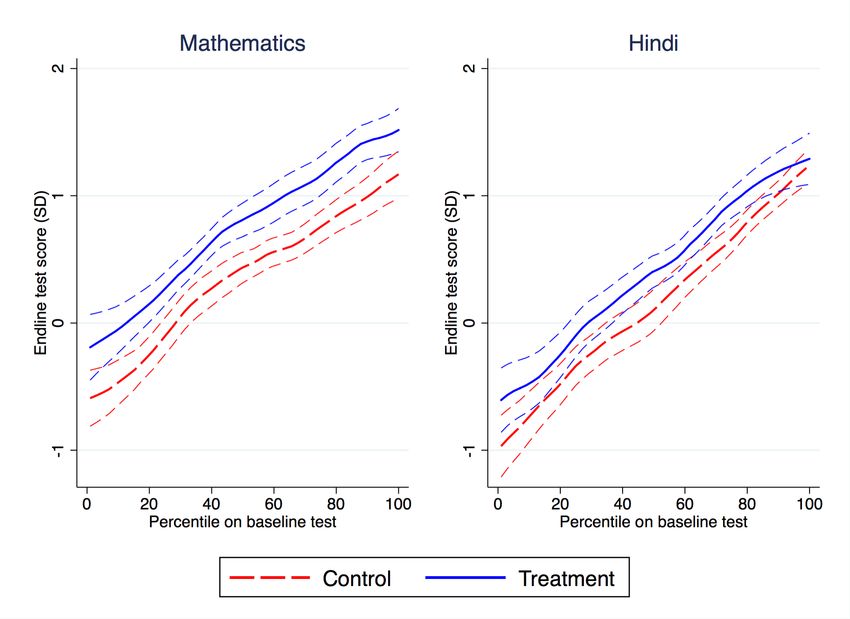
The rest of this paper is organized as follows. Section 2 describes the intervention, and
experimental design. Section 3 describes our data. Section 4 presents our main results.
Section 5 discusses cost-effectiveness, and policy implications. Section 6 concludes.
2 Intervention and Study Design
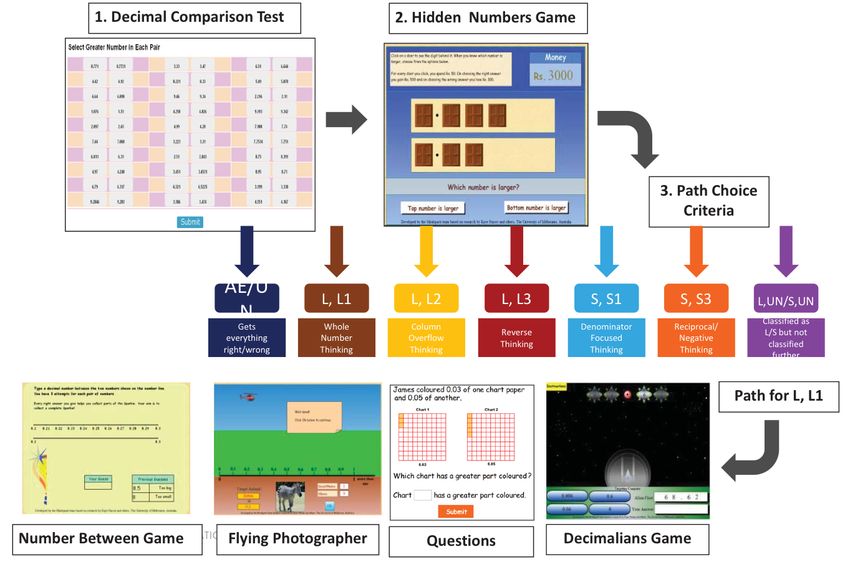
2.1 The Mindspark CAL software
The Mindspark CAL software, developed by Educational Initiatives (a leading Indian
education firm), is the central component of the program we study. The software is
interactive and includes continuous student assessment alongside instructional games, videos,
and activities from which students learn through explanations and feedback. It reflects over
a decade of product development and aims to leverage several posited channels by which
education technology may improve pedagogy. We highlight some of the key design features
of the software here, and provide a more detailed description with examples for each of the
points below in Appendix C.
First, it is based on an extensive corpus of high-quality instructional materials, featuring
an item bank of over 45,000 test questions, iterated over several years of design and field
testing. The design of the content tries to reflect current research in effective pedagogy that
is relevant to low-income settings, such as the use of same-language subtitling for teaching
literacy (Kothari et al., 2002). Further, the software allows this material to be delivered with
uniform consistency to individual students, thereby circumventing both limitations in teacher
knowledge as well as heterogeneity in knowledge and teaching ability across teachers.
Second, the content is adaptive, with activities presented to each student being based on that
student’s performance. This adaptation is dynamic, occurring both at the beginning based
on a diagnostic assessment, and then with every subsequent activity completed. Thus, while
the Mindspark content database is mapped into the grade-level curricular standards of the
education system, an essential feature of the software is that the content presented to students
is not linked to the curriculum or textbook of the grade that the student is enrolled in. In
other words, it enables dynamic “Teaching at the right level” for each individual student and
can cater effectively to very wide heterogeneity in student learning levels that may be difficult
for even highly trained and motivated teachers to achieve in a classroom setting.
Third, even students at approximately similar levels of understanding of a topic, may have
very different specific areas of conceptual misunderstanding. Thus, the pedagogical approach
needed to alleviate a student-specific conceptual ‘bottleneck’ may be different across students.
Mindspark aims to address this issue by using its large database of millions of student-question
level observations to identify patterns of student errors and to classify the type of error and
target differentiated remedial instruction accordingly (see Appendix C.4.2 for examples). This
5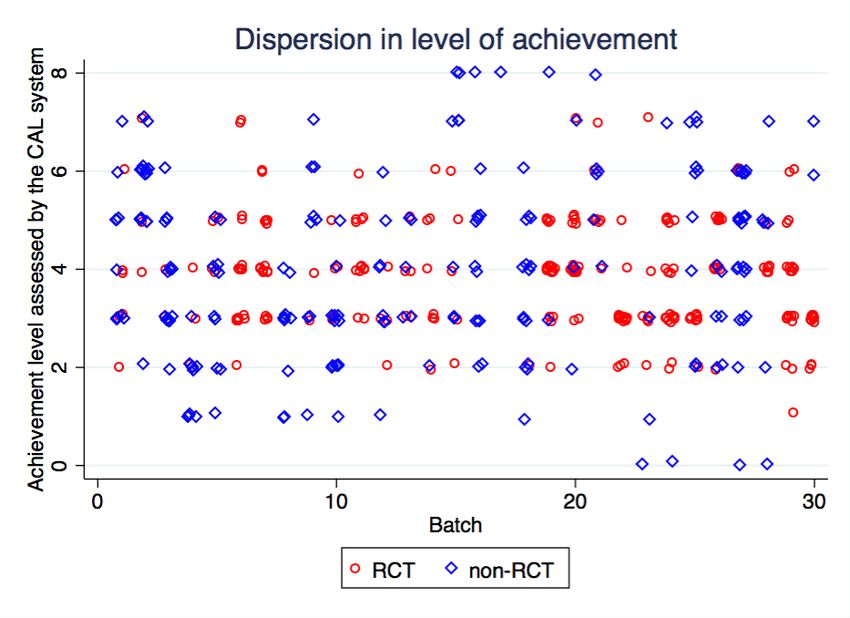
attention to understanding patterns in student errors builds on an extensive literature in
education that emphasizes the diagnostic value of error analysis in revealing the heterogeneous
needs of individual students (see Radatz 1979 for a discussion). However, while the value of
error analysis is well-known to education specialists, implementing it in practice in classroom
settings is non-trivial and the use of technology sharply reduces the cost of doing so.6
Finally, the interactive user interface, combined with the individualization of material for
each student, facilitates children’s continuous engagement with the material. The software
makes limited use of instructional videos (where student attention may waver and cannot
be monitored), choosing instead to instruct with steps that require students to constantly
interact with the system. This approach aims to boost student attention and engagement, to
provide feedback at the level of each intermediate step in solving a problem, and to shorten
the feedback loop between students attempting a problem and learning about their errors and
how to correct them.

2.1.1    The Mindspark centers intervention
The Mindspark CAL software has been deployed in various settings: private and government
schools, after-school instructional centers and individual subscription-based use at home. Here,
we evaluate the supplementary instruction model, delivered in stand-alone Mindspark centers
that target students from low-income households. Students sign up for the program by
selecting a 90-minute slot, outside of school hours, which they are scheduled to attend six
days per week. The centers charged a (subsidized) fee of INR 200 (USD 3) per month.7
Scheduled daily instruction in Mindspark centers is divided into 45 minutes of computer-based
instruction and 45 minutes of supervised instructor-led group-based study. In the time allotted
to the computer-based instruction, each child is assigned to a Mindspark-equipped computer
with headphones that provides him/her with activities on math, Hindi and English. Two of
the days of the week are supposed to be devoted to math activities, two days to Hindi, one
day to English, and one day in which the child can choose the subject.
The group-based instruction component includes all students in a given batch (typically
around 15 students) and is supervised by a single instructor. Instructors are locally hired
and are responsible for monitoring students when they are working on the CAL software,
providing the group-based instruction, facilitating the daily operation of the centers, and
   6
     The emphasis on error analysis reflects EI’s long experience in conducting similar analyses and providing
diagnostic feedback to teachers based on paper-and-pen tests (Muralidharan and Sundararaman, 2010). Thus,
the Mindspark development process reflects the aim of EI to use technology to improve productivity in
implementing ideas that are believed by education specialists to improve the effectiveness of pedagogy.
   7
     The intensity of the program, as well as the fee charged, was designed to be comparable to after-school
private tutoring, typically conducted in groups of students, which is common in India. According to the 2012
India Human Development Survey, 43% of 11-17 year olds attended paid private tutoring outside of school.

                                                      6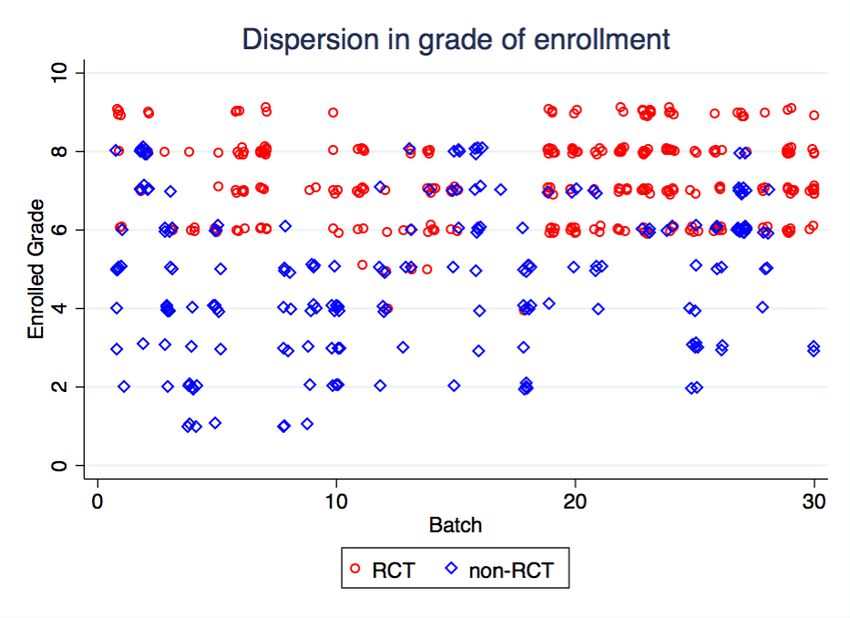
encouraging attendance and retention of enrolled students.8 Instruction in the group-based
component consists of supervised homework support and review of core concepts of relative
broad relevance for all children without individual customization.
The intervention is, thus, a blended learning model that includes personalized one-on-one
computer-aided instruction along with additional group academic support by an instructor.
As a result, all our estimates of program impact and cost effectiveness are based on this
composite program. However, in section 5.2, we present several pieces of descriptive evidence
suggesting that most of the gains in test scores we find are likely to be attributable to the
CAL component rather than the group instruction. We also argue that our results are likely to
under-estimate the full potential of a blended learning model because the Mindspark centers
did not optimize the use of the instructor for pedagogy.

2.2     Sample
The intervention was administered in three Mindspark centers in Delhi focused on serving
low-income neighbourhoods. The sample for the study was recruited in September 2015 from
five public middle schools close to the centers. All five schools had grades 6-8, three of these
schools had grade 9, and only two had grades 4-5. Three were girls-only schools and the
other two were boys-only secondary schools. Therefore, our study sample has a larger share
of girls in grades 6-8. In each school, with authorization from the school principals, staff from
EI and from J-PAL South Asia visited classrooms from grades 4-9 to introduce students to
the Mindspark centers intervention and the study and to invite them and their parents to a
scheduled demonstration at the nearby center. Students were provided flyers to retain this
information and to communicate with their parents.
At the demonstration sessions, students and their parents were introduced to the intervention
by staff from EI and basic background information was collected. Parents were told that,
if their child wanted to participate in the study, he/she would need to complete a baseline
assessment and that about half of the students would be chosen by lottery to receive a voucher
which would waive the usual tuition fees of INR 200 per month until February 2016 (i.e. for
nearly half of the school year). Students who were not chosen by lottery were told that would
be provided free access to the centers after February 2016, if they participated in an endline
assessment in February 2016. However, lottery losers were not allowed to access the program
during the study period. These two design features helped to reduce attrition, and increase
statistical power respectively.
   8
    These instructors are recruited based on two main criteria: (a) their potential to interact with children;
and (b) their performance on a very basic test of math and language. However, they are not required to
have completed a minimum level of education at the secondary or college level, or have any teacher training
credentials. They receive an initial training, regular refresher courses, and have access to a library of guiding
documents and videos. They are paid much lower salaries than civil-service public-school teachers.

                                                       7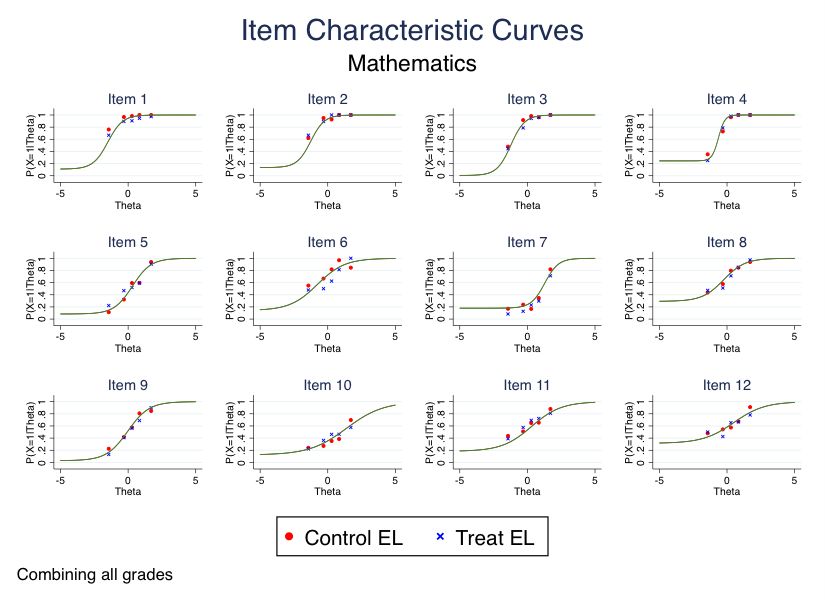
Our study sample comprises the 619 students who completed the baseline tests and surveys.
About 97.5% of these students were enrolled in grades 6-9.9 To assess the representativeness of
our self-selected study sample (and potential limitations to the external validity of our results),
we compare the test score mean and distribution of study participants, and that of the full
population of students in the same schools using administrative data on final exam scores in the
preceding school year (2014-15). While study participants have modestly higher pre-program
test scores (of around 0.15σ) than non-participants (Table A.1), there is substantial common
support in the range of achievement across participants and non-participants (Figure A.1),
suggesting that our results are likely to extend to other students in this setting.

2.3     Randomization and Compliance
The 619 participants were individually randomized into treatment and control groups with
305 students in the control and 314 in the treatment group. Randomization was stratified
by center-batch preferences.10 The treatment and control groups did not differ significantly
on any observable dimension at baseline (Table 1, Panel A). Of the 314 students offered
a voucher for the program, the mean attendance rate was 58% (around 50 days out of a
maximum possible of 86 days). The full distribution of attendance among lottery-winners is
presented in Figure A.3, and we present both ITT estimates of winning the lottery and IV
estimates of the dose-response relationship as a function of days of attendance in Section 4.
Of the 619 students who participated in the baseline test, 533 also attended the endline test
(270 control and 263 treatment students). The follow-up rate was 84% in the treatment
group, and 88% in the control group, but the difference was not significant at the 5% level.
We also find no significant difference between treatment and control groups in mean student
characteristics (age, gender, SES, or baseline test scores) of those who attend both the baseline
and endline test, and comprise our main study sample (Table 1, Panel B).

3       Data
3.1     Student achievement
The primary outcome of interest for this study is student test scores. Test scores were
measured using paper-and-pen tests in math and Hindi prior to the randomization (September
2015, baseline) and near the end of the school year (February 2016, endline).11 Tests were
    9
     589 students were enrolled in grades 6-9, 15 were enrolled in grades 4-5 and, for 15 students, the enrolled
grade was not reported. Our focus on Grades 6-9 reflects our funding from the JPAL Post Primary Education
Initiative, which prioritized studying interventions to improve post-primary education (after fifth grade).
  10
     Students were asked to provide their preferred slots for attending Mindspark centers given school timings
and other commitments. Since demand for some slots was expectedly higher than others, we generated the
highest feasible slot for each student with an aim to ensure that as many students were allocated to their first
or second preference slots as possible. Randomization was then carried out within center-by-batch strata.
  11
     It was important to test students in a pen-and-paper format, rather than computerized testing, to avoid
conflating true test score gains with greater familiarization with computer technology in the treatment group.

                                                       8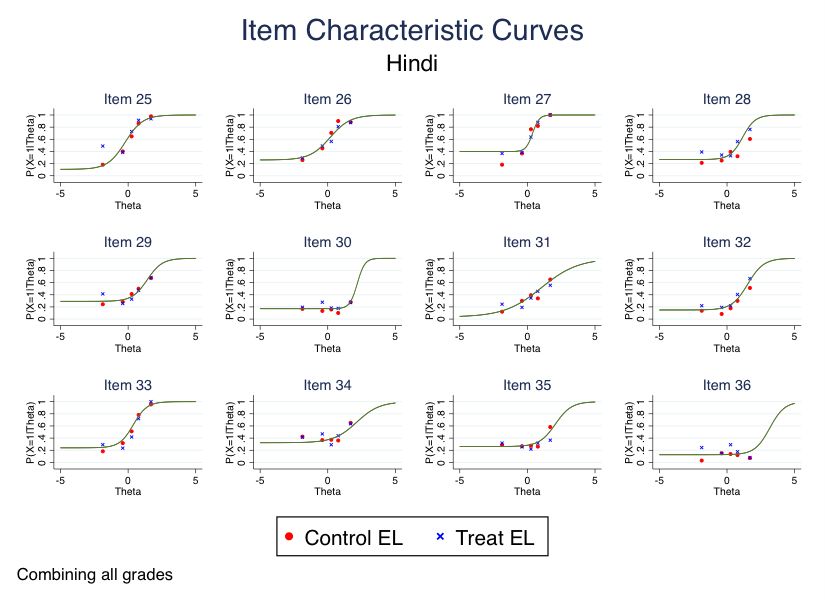
administered centrally in Mindspark centers at a common time for treatment and control
students with monitoring by J-PAL staff to ensure the integrity of the assessments.
The tests were designed independently by the research team and intended to capture a
wide range of student achievement. Test items ranged in difficulty from “very easy”
questions designed to capture primary school level competencies much below grade-level
to “grade-appropriate” competencies found in international assessments. Test scores were
generated using Item Response Theory models to place all students on a common scale across
the different grades and across baseline and endline assessments. The common scale over time
allows us to characterize the absolute test score gains made by the control group between
the two rounds of testing. The assessments performed well in capturing a wide range of
achievement with very few students subject to ceiling or floor effects. Details of the test design,
scoring, and psychometric properties of individual test questions are provided in Appendix D.

3.2    Mindspark CAL system data
The Mindspark CAL system collects detailed logs of all interactions that each student has
with the software platform. This includes, for example, daily attendance, the estimated grade
level of student achievement as determined by the Mindspark system, the record of each
question that was presented to the child and whether he/she answered correctly, as well as
other details such as time taken to answer or enter keystrokes to measure engagement with
content. These data are available (only) for the treatment group for the duration of the
intervention. We use these data in three ways: to describe the mean and distribution of
learning gaps relative to curricular standards in each grade at baseline; to demonstrate the
personalization of instruction at the core of the Mindspark system; and to characterize the
evolution of student achievement in the treatment group over the period of the treatment.

3.3    School records
At the school level, we collected administrative records on test scores on school exams of all
study students and their peers in the same schools and classrooms. This was collected for both
the 2014-15 school year (to compare the self-selected study sample with the full population of
students in the same schools) and the 2015-16 school year (to evaluate whether the treatment
affected test scores on school exams).

3.4    Student data
At the time of the baseline assessment, students answered a self-administered written
student survey which collected basic details about their socio-economic status, and household
characteristics. A shorter survey of time-varying characteristics was also administered at
endline. Additionally, we also conducted a brief telephone survey of parents in July 2016
to collect information on use of private tutoring during the prior academic year, and their
opinion of the Mindspark program.
                                               9
4 Results
4.1 Business-as-usual academic progress
Our first set of results use the rich CAL data on student achievement to present a more
granular characterization of the variation in learning levels within a typical classroom than
has been possible so far. Specifically, the data from the Mindspark CAL system provides an
assessment of the actual grade-level of each student’s learning level regardless of grade enrolled
in. The main results are presented in Figure 1, which shows the full joint distribution of the
grades students were enrolled in and their assessed learning level at the start of treatment.12
We highlight three main patterns in Figure 1. First, most children are already much below
grade level competence at the beginning of post-primary education. In grade 6, the average
student is about 2.5 grades behind in math and about half a grade behind in Hindi.13 Second,
although average student achievement is higher in later grades, indicating some learning
over time, the slope of achievement gains (measured by the line of best fit) is considerably
flatter than the line of equality between curricular standards and actual achievement levels.
This suggests that average student academic achievement is progressing at a lower rate than
envisaged by the curriculum — by grade 9, students are (on average) nearly 4.5 grades behind
in math and 2.5 grades behind in Hindi. Third, the figure presents a stark illustration of the
very wide dispersion in achievement among students enrolled in the same grade: students in
our sample span 5-6 grade levels in each grade. Characterizing this variation is essential for
designing effective instructional strategies, and the CAL data allow us to do this more clearly
than the literature to date, by precisely characterizing the learning level of each student.
Our second descriptive result uses the IRT-linked student-level panel data from our
independent tests to investigate heterogeneity in the ‘business as usual’ academic progress
in the control group. Specifically, we present the value-added of test scores for the bottom,
middle, and top third of the within-grade achievement distributions in our sample in both
math and Hindi. We estimate the following regression (without a constant term):
Yis2 = γ.Yis1 + αj .tercjs1 + is2 (1)
12
Note that these data are only available for students in the treatment group. However, Figure 1 uses data
from the initial diagnostic test, and does not reflect any instruction provided by Mindspark.
13
These figures are likely to underestimate the gap relative to curricular standards at the end of primary
school (grade 5), because weaker students are less likely to have made the transition to post-primary school
enrolment and will not be in our sample. Also, the allocation of test questions to grade levels is more robust in
math than language (where competencies are less well-delineated across grades). Thus, although most patterns
across grades are similar in the two subjects, the computer system’s assessment on grade-level competence of
children is likely to be more reliable for math. Baseline test scores on our independent tests in both subjects are
consistently higher for students assessed by the CAL program as being at a higher grade level of achievement,
which helps to validate the grade-level bench-marking by the CAL program. Further details of the diagnostic
test and bench-marking by the software are presented in Appendix C.
10where Yist is student i’s test score on our independent assessment in subject s at period t
(normalized to µ=0, σ=1 on the baseline test), tercjs1 is a vector of indicator variables for
the within-grade terciles (j) of baseline score in subject s, and is2 is the error term.
Coefficients from the vector αj represent the absolute value-added in each tercile j. Such an
interpretation is made feasible by the comparable measurement of test scores across baseline
and endline tests on a common scale, which is done here by linking test scores using IRT.
These coefficients are presented in Figure 2, and we see considerable heterogeneity in student
progress by initial learning level. While students in the top third of the baseline test-score
distribution show significant academic progress between baseline and endline, it is striking
that we cannot reject the null of no increase in test scores for the bottom-third of students in
the control group over the same period (with coefficients close to zero in both subjects).
Figures 1 and 2 highlight that a vast majority of students in this setting are left behind the
curriculum, and that this gap grows by grade. Further, lower-performing students appear to
make no academic progress at all. To the best of our knowledge, we are the first to present
direct evidence on these patterns in developing countries. However, they are consistent with
evidence on slow test score growth within cohorts over time in repeated cross-sections in India
(Pritchett, 2013), and with the patterns of results observed in experimental evaluations of
education interventions in developing countries in the past decade (Glewwe et al., 2009; Duflo
et al., 2011; Banerjee and Duflo, 2012). Thus, although our sample is not representative and
we present these results mainly to set the context for the intervention, the patterns presented
here are likely to be similar to those in other developing country settings.
4.2 Program Effects (Intent-to-treat estimates)
The main treatment effects can be seen visually in Figure 3, which presents mean test scores
in the baseline and endline assessments in math and Hindi for lottery-winners and losers.
While test scores improve over time for both groups, endline test scores are significantly and
substantially higher for the treatment group in both subjects.
We estimate intent-to-treat (ITT) effects of winning the lottery (β) using:
Yis2 = α + γ.Yis1 + β.T reatmenti + φ + is2 (2)
where Yist is student i’s test score in subject s at period t (normalized to µ=0, σ=1 on the
baseline test); T reatment is an indicator variable for being a lottery-winner; φ is a vector of
stratum dummy variables to reflect the randomization design; and it is the error term.14
14
We use robust Huber-White standard errors throughout the paper rather than clustered standard errors
because of the individual (as opposed to group) randomization of students to treatment status. Further,
common shocks from test day and venue effects are netted out by the inclusion of strata fixed effects since all
students in the same stratum (both treatment and control), were tested on the same day in the same location.
11We find that students who won the lottery to attend Mindspark centers scored 0.36σ higher
in math and 0.22σ higher in Hindi compared to lottery losers after just 4.5 months (Table 2:
Cols. 1-2). In Cols. 3 and 4, we omit strata fixed effects from the regression, noting that
the constant term α in this case provides an estimate of the absolute value-added (VA) in the
control group over the course of the treatment.15 Expressing the VA in the treatment group
(α+β) as a multiple of the control group VA (α), our results indicate that lottery-winners made
twice the progress in math, and 2.5 times the progress in Hindi, compared to lottery-losers.
These are ITT results based on an average attendance of about 58% among lottery-winners.
We present IV results and estimates of a dose-response relationship in Section 4.6.
In addition to presenting impacts on a normalized summary statistic of student learning, we
also present impacts on the fraction of questions answered correctly on different domains of
subject-level competencies (Table 3). The ITT effects are positive and significant across all
domains of test questions. In math, these range from a 12% increase on the easiest type
of questions (arithmetic computation) to a 36% increase on harder competencies such as
geometry and measurement. Similarly, in Hindi, ITT effects range from a 7% gain on the
easiest items (sentence completion) to a 19% gain on the hardest competence (answering
questions based on interpreting and integrating ideas and information from a passage).
4.3 Heterogeneity
We investigate whether ITT effects vary by gender, socio-economic status, or initial test
scores, using a linear interaction specification and find no evidence of heterogeneity on these
dimensions (Table 4). Since baseline test scores are a good summary statistic of prior inputs
into education, we also present non-parametric estimates of the ITT effect as a function of
baseline scores. We do this by plotting kernel-weighted locally-smoothed means of the endline
test scores at each percentile of the baseline test-score distribution, separately for the treatment
and control groups (Figure 4). In both math and Hindi, we see that the test scores in the
treatment group are higher than those in the control group at every percentile of baseline test
scores, and that the gains appear similar at all percentiles.
Next, we formally test for equality of treatment effects at different points of the within-grade
test-score distribution. We do this by regressing endline test scores on the baseline test scores,
indicator variables for treatment and for within-grade terciles at baseline, and interaction
terms between the treatment variable and two terciles (the regression is estimated without a
constant). We see no evidence of heterogeneity here as well (Table 5). The coefficient on the
15
Again, note that this interpretation is possible because the baseline and endline tests are linked to a
common metric using Item Response Theory: α in Eq. 2 is the mean of the (αj ) coefficients estimated in
Eq. 1 and shown in Figure 2. This would not be possible if scores were normalized within grade/period as is
common practice. However, treatment effects are very similar (0.36σ in math and 0.21σ in Hindi) when test
scores are normalized relative to the within-grade distribution in the control group at the endline (Table A.2).
12treatment dummy itself is statistically significant, but the interaction terms of treatment with
the tercile at baseline are statistically indistinguishable from zero.
Thus, winning a voucher appears to have benefited students at all parts of the achievement
distribution significantly and relatively equally, suggesting that the Mindspark software could
teach all students equally well. Recall, however, that students in the lowest tercile of the
within-grade baseline test score distribution did not make any academic progress in the control
group on either subject (Figure 2; Table 5: Row 1). Thus, while the absolute test score gain
from winning a Mindspark voucher was similar for all lottery winners, the relative gains from
the treatment (measured as a multiple of what students would have learnt in the absence of
treatment) was much larger for the weaker-performing students.
4.4 Personalization
These large test score gains reflect the composite effects of multiple features of Mindspark
(as described in Section 2), and our experiment was not designed to separately identify the
effects of these channels. However, the detailed question-level data available in the system for
individual students in the treatment group allow us to closely examine a potentially important
component for the program’s effectiveness: the delivery of personalized instruction which is
able to target student preparedness precisely and update instruction appropriately.
We first present direct evidence that the software precisely targeted instructional material at
an individual student’s level. Figure 5 shows, separately by each grade of school enrolment,
the actual grade level of students’ academic preparedness as estimated by the Mindspark CAL
system and the grade-level difficulty of the questions that students were presented.16 Across
the horizontal axis on each subgraph, we see the wide dispersion in academic preparedness
within each grade, reiterating our interpretation of Figure 1. On the vertical axis, we
see that the software was able to precisely target instruction to student preparedness and
that the typical student is presented items, either at their grade level or at adjacent grade
levels. Thus, the software was able to simultaneously accommodate variation in student
preparation spanning five to grade levels for students enrolled in the same grade. This degree
of personalization is considerably more precise than would be feasible for a single teacher to
deliver to all students in a standard classroom setting.
Second, we show that the CAL system accommodates variation, not just in the incoming
levels of student preparedness, but also in their pace of learning and individual trends in
student achievement. Figure 6 presents non-parametric plots of the average difficulty level
of the math items presented to students over the course of the intervention, documenting
16
In both math and Hindi, we use data from a single day which is near the beginning of the intervention, after
all students would have completed their initial assessment, and when Mindspark computer-aided instruction
in the relevant subject was scheduled in all three centers.
13that the software updates its estimate of student achievement levels in real time and modifies
instruction accordingly.17 In the first figure, separate lines are plotted by the grade students
are enrolled in and, in the second figure, by their initial level of achievement. As can be seen,
this estimated level of difficulty increases for all groups of students continuously indicating
that students were making regular progress during the study period, and that the software
was able to customize instruction to their increasing achievement. The individualization of
the dynamic updating of content is highlighted further in Figure A.2 where we use the rich
individual data on student achievement to plot similar trajectories separately for each student
in the treatment group.
In summary, Mindspark seems to be able to deliver customized instruction at a level that
is unlikely to be feasible under most current models of classroom-based instruction. This
personalization is likely to be especially important for academically weaker students whose
preparation is several grade levels behind their enrolled grade, and who (likely as a result)
appear to make no progress under regular classroom-based instruction as seen earlier. Note
that the CAL interventions reviewed in Appendix B—with the exception of Banerjee et al.
(2007)—typically featured grade-appropriate instruction. These grade-linked CAL programs
find only modest effects despite combining most other advantages of CAL such as high-quality
content delivered in a standardized way, interactive content to promote student engagement,
and immediate feedback. We conjecture therefore that a likely reason for the large effects we
find is the ability of the software to finely personalize instruction and “Teach at the Right
Level” to all students, especially in this context of widespread learning deficits.18
4.5 Grade-level impact decomposition, and impacts on school tests
One consequence of the substantial deficits in student preparation (Figure 1), is that even
large absolute increases in learning may not be sufficient for raising test scores on grade-level
assessments since the gains in learning could be taking place below grade-level. We therefore
use the CAL system data to directly examine the grade-level distribution of content presented
by the software to students in the treatment group (see Figure 7). Consistent with the pattern
of improvement in math test scores over time seen in the left panel of Figure 6 (which take
place far below the level of the enrolled grade), we see that in math, most of the content
presented to students by Mindspark was below grade level, with very little content at the level
17
We study dynamic updating only in math because the algorithms for updating are more finely developed,
and differ importantly from Hindi. In math, the software moves students to a harder question in the same
competence after answering initial question(s) correctly but in Hindi the software ensures that a student has
mastered all competencies at a grade level before being presented questions at the next grade level.
18
In future work, we hope to work with EI to run micro-experiments on the Mindspark platform to try
to isolate the impact of personalization on learning outcomes. However, from the perspective of improving
productivity in the delivery of education, we are more interested in the composite “full potential” impact of
technology-aided learning in improving education outcomes, which is what we focus on in this paper.
14of the grade the student is enrolled in. However, in Hindi, in addition to lower-grade content,
a substantial portion of the Mindspark instruction in each grade was at grade level.
Next, we examine the extent to which the treatment effects on our independent tests map
into the grade-level patterns of content presented by the CAL system by separately presenting
treatment effects on the proportion of test questions answered correctly at and at below grade
level.19 We present these results in Table 6 and see that while there were large treatment
effects in math on items below grade level, there was no impact on grade-level questions. In
Hindi, on the other hand, we find that the treatment effect is significant for both questions at
and below grade level.
These patterns in our data are also replicated in the independent data we collected on test
scores on school exams. Table 7 presents the treatment effect of being offered a voucher on
scores on the annual end of year school exams held in March 2016.20 Mirroring the results
on grade-level items on our own tests, we find a significant increase in test scores of 0.19σ in
Hindi but no significant effect on math. We also do not find significant effects on the other
subjects (science, social science, or English), although all the point estimates are positive.
Both sets of results (on our tests and on the school tests) are consistent with the data on
grade-level distribution of questions presented by Mindspark shown in Figure 7, and highlight
the importance of careful test construction for education research in settings with a wide
distribution of student learning levels. In particular, relying on grade-level assessments
would have led to erroneous inference regarding program impacts (especially in math). See
Appendix D for further details on test design for our study, and Muralidharan (2017) for a
detailed discussion on test construction for education research in general.
4.6 IV estimates of dose-response relationship
All the results presented so far are ITT estimates, which are based on an average attendance
of about 58% among lottery-winners.21 In this section, we present LATE estimates of the
impact of actually attending the Mindspark centers, and (with further assumptions) estimates
of predicted treatment effects at different levels of program exposure. We estimate the
dose-response relationship between days of attendance and value-added using:
Yis2 = α + γ.Yis1 + µ1 .Attendancei + ηis2 (3)
19
Items on our tests, which were designed to capture a wide range of achievement, were mapped into
grade-levels with the help of a curriculum expert.
20
In Delhi, test papers for the annual exam are common across schools for each subject in each grade. In
our regressions, we normalize test scores to µ=0, σ=1 in each grade/subject in the control group.
21
About 13% of lottery-winners attended for one day or less. The mean attendance among the rest was 57
days (around 66%). Figure A.3 plots the distribution of attendance among lottery winners, and Table A.3
presents correlations of attendance among lottery winners with various baseline characteristics.
15where Yist is defined as previously, Attendance is the number of days a student logged in to
the Mindspark system (which is zero for all lottery-losers) and ηist is the error term. Since
program attendance may be endogenous to expected gains from the program, we instrument
for Attendance with the randomized offer of a voucher.
The IV estimates suggest that, on average, an extra day of attending the Mindspark centers
increased test scores by 0.0065σ in math and 0.004σ in Hindi (Table 8: Cols. 1-2). These
estimates identify the average causal response (ACR) of the treatment which “captures a
weighted average of causal responses to a unit change in treatment (in this case, an extra
day of attendance), for those whose treatment status is affected by the instrument” (Angrist
and Imbens, 1995). Using these IV estimates to predict the effect of varying the number of
days attended requires further assumptions about (a) the nature of heterogeneity in treatment
effects across students (since the ACR is only identified over a subset of compliers, and not
the full sample) and (b) the functional form of the relationship between days attended and the
treatment effect (since the ACR averages causal effects over different intensities of treatment).
We present three pieces of suggestive evidence that constant treatment effects across students
may be a reasonable assumption in this setting. First, the ITT effects were constant across
the full distribution of initial achievement, which is a good summary measure for relevant
individual-specific heterogeneity (Figure 8, Tables 3, 4). We also found no significant evidence
of treatment heterogeneity across observed pre-treatment characteristics (Table 3).
Second, we cannot reject the equality of the IV estimates of Eq.(3) and the OLS estimates using
a value-added (VA) specification (Table 8: Cols. 3-4), which suggests that the ATE and the
LATE may be similar here. For both math and Hindi, the p-value from the difference-in-Sargan
test (similar to a Hausman test, but allowing for heteroskedasticity) testing equivalence of OLS
and IV results is substantially greater than 0.1 (Cols. 1-2).22
Finally, the constant term in the OLS VA specifications (corresponding to zero attendance)
is identical when estimated using the full sample and when estimated using only the data
in the treatment group (Table 8: Cols. 3-6). The constant term is identified using both
the control group and “never-takers” when using the full sample, but is identified over only
the “never-takers” when the sample is restricted to lottery-winners. Thus, the outcomes for
the “never takers” are similar to those for the control group, suggesting equality of potential
outcomes across different compliance groups.23
22
Note that this close correspondence between the OLS VA and IV estimates is consistent with much recent
evidence that VA models typically agree closely with experimental and quasi-experimental estimates (see, for
instance Chetty et al. (2014); Deming et al. (2014); Singh (2015); Angrist et al. (2016)
23
This test is similar in spirit to tests suggested by Bertanha and Imbens (2014) and Brinch et al. (2016),
for extending the validity of RD and IV estimates beyond LATE to average treatment effects.
16We next explore the functional form of the relationship between days attended and the
treatment effect directly by plotting value-added against attendance using data for the lottery
winners (Figure 8). The relationship seems entirely linear in math and, even in Hindi, although
there are some signs of diminishing returns, we cannot reject a linear dose-response relationship
(see Table A.4). A linear dose-response is additionally plausible when considering the adaptive
nature of the intervention which allows it to be equally effective regardless of the starting point
of the student (thus alleviating possible concerns of diminishing returns to treatment, at least
over the relatively short duration of treatment in this study).
Under the assumptions of constant treatment effects and a linear dose-response relationship,
both of which appear reasonable in this context, our IV results suggest that attending
Mindspark centers for 90 days, which roughly corresponds to half a school year with 80%
attendance, would lead to gains of 0.59σ in math and 0.37σ in Hindi (last row of Table 8).
We extrapolate results to 90 days, rather than a full school year, to keep the predictions near
the range of the program exposure provided by our experiment (the maximum was 86 days).
These estimates are conservative and likely to understate the dose-response relationship
because the Attendance variable includes time spent in the Mindspark centers on instruction
in other subjects that we do not test (especially English).24 In Table A.5, we present analogous
IV and value-added estimates which only account for days spent by students on the subjects
that we test (math and Hindi). Using these results, and the same assumptions as above, we
estimate that 90 days of Mindspark attendance, split equally between the two subjects, would
lead to test score gains of 0.76σ in math and 0.5σ in Hindi.
4.7 Robustness
4.7.1 Attrition
Since the difference in attrition between the treatment and control groups is significant at the
10% level (Table 1), we test the robustness of our results to attrition by modeling selection
into the endline based on observed characteristics, and present inverse probability weighted
treatment effects: the estimated ITT effects are substantively unchanged (Table A.6). We
also compute Lee (2009) bounds for the ITT effect: although bounds are wide, the treatment
effects are always positive and significant (Table A.7).
4.7.2 Familiarity with test questions
Our independent tests used items from several external assessments, some of which (in
the Indian setting) were designed by EI; this raises the possibility that results on our
assessments are overstated due to duplication of items between our tests and the Mindspark
24
See Muralidharan and Sundararaman (2015) for an illustration of the importance of accounting for patterns
of time use across subjects for inference regarding the productivity of education interventions.
17You can also read