DO NOT CITE OR QUOTE WITHOUT PERMISSION - George A. Kaplan, Ph.D. Thomas Francis Collegiate Professor of Public Health
←
→
Page content transcription
If your browser does not render page correctly, please read the page content below
DO NOT CITE OR QUOTE WITHOUT PERMISSION

                           George A. Kaplan, Ph.D.
                    Thomas Francis Collegiate Professor of Public Health
               Director, Center for Social Epidemiology and Population Health
                                   University of Michigan
                                     gkaplan@umich.edu
                                                                                    1
  ©Ken Light                                                                    CSEPH
“[poverty] projects its nagging, prehensile tentacles in lands and
villages all over the world…. This problem of poverty is not only
seen in the class division between the highly developed industrial
nations and the so-called underdeveloped nations; it is seen in the
great economic gaps within the rich nations themselves….
          The corrosive character of inequality
…it is obvious that if man is to redeem his spiritual and moral "lag",
he must go all out to bridge the social and economic gulf between
the "haves" and the "have nots" of the world. Poverty is one of the
most urgent items on the agenda of modern life.

…In the final analysis, the rich must not ignore the poor because
both rich and poor are tied in a single garment of destiny. All life is
interrelated, and all men are interdependent. The agony of the poor
diminishes the rich, and the salvation of the poor enlarges the rich. “

Martin Luther King Jr., Nobel Prize Address, 1964
                                                                     2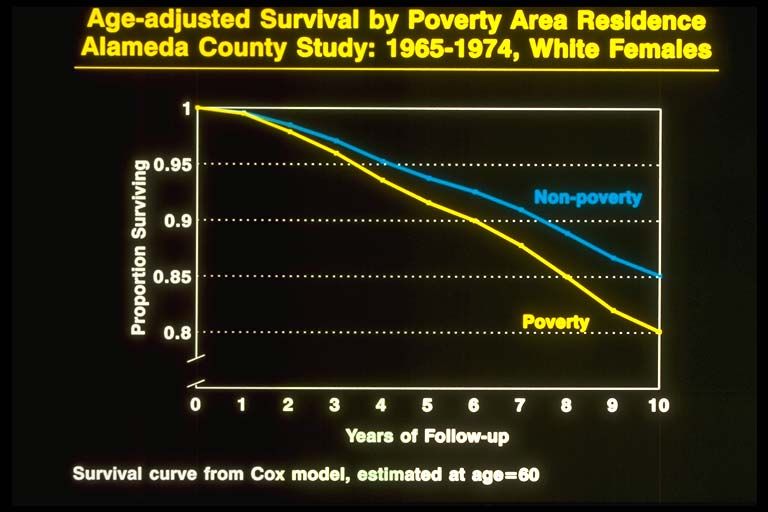
% living
< $1/day

Life
expectancy
at birth
             3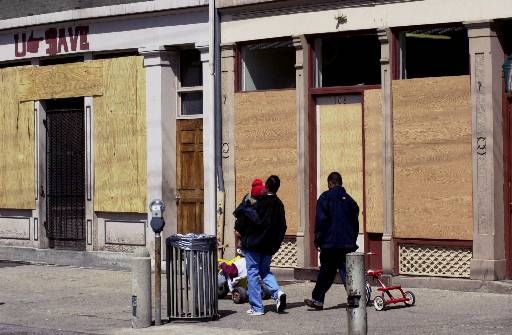
Number of publications per month with social class,
                                 socioeconomic factors, income or poverty listed as
                                 descriptors: MEDLINE search, 1969 through 2006
                                700
                                600
     P u b lica tio n s/M o n

                                500
                                400
                                300
                                200
                                100
                                      1969- 1973- 1977- 1981- 1985- 1989- 1993- 1997- 2001- 2004-
                                       72    76    80    84    88    92    96 2000 2003 2006

                                                                 Year                               4
Kaplan and Lynch, AJPH, 1997; updated 4/07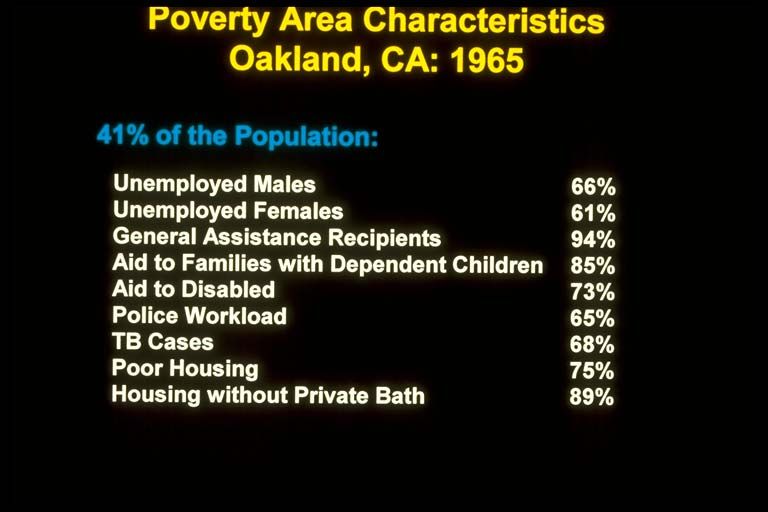
Socioeconomic Position and Health

•   Widespread
•   All age groups affected
•   Affects multiple organs
•   Not fixed in time
•   Most risk factors patterned by SEP

                                          5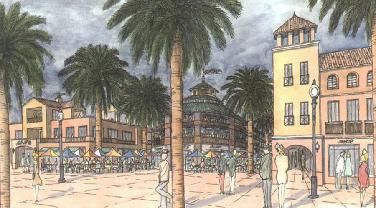
Risk of death at income “X” compared
                                 to risk at mean income
         2.0

                                   Population Density
                               Population
                                Density Function
Relative risk

                                                               RR = 1

                                                         Relative Risk (RR) +/-
                     Mean                                  95% Confidence
                    Income                                 Interval for beta

                0            50,000        100,000       150,000            200,000

                                                Income               Wolfson, et al., (1999)
                                                                                       6
Socioeconomic Position is Related to Many
   Diseases and Causes of Death (e.g.)
         • Low birth weight, and prematurity
         • Childhood injuries
         •Diabetes
                                               Across
         • Asthma
                                               many
         • Depression                          organ
         • Oral health                         systems
         • Heart Disease                       and stages
                                               of life
         • Most cancers
         • Stroke
         • Vision and Hearing impairment
         • Dementia
                                                     7
         • etc.
Trends in Life Expectancy by County Deprivation Decile: United States, 1980-2000
80
79
1 (worst)
78 2
3
77 4.5 4
5
76
6
7
75
8
2.8
9
74
20
73
72
80-82 89-92 98-2000
Deprivation index: education, occupation, wealth, income distribution, unemployment, poverty, housing quality
Singh and Siahpush, International Journal of Epidemiology 2006 35(4):969-979Many Behavioral, Social, and Environmental Risk Factors
are Patterned by Socioeconomic Position (e.g.)
• smoking
• physical inactivity
•obesity
• excessive alcohol use
• illegal drug use
• other risky behaviors
• social isolation
• lack of access to health care
• poor indoor and outdoor air quality
• dangerous work and residential settings
• etc.
9Determinants of Population Health
and Health Inequalities
Social and Economic Policies
Institutions (including medical care)
Living Conditions
Social Relationships
urse
Individual Risk Factors
co
Life
Genetic/Constitutional
Factors
Pathophysiologic e nt
pathways nm
ir o
nv
a l E
Individual/Population
ys ic
Health
Ph 10Myra– An American (and elsewhere) Tragedy Myra is now 12 years old. Her parents have been unemployed on and off for most of her life, including the entire year before she was born. They move from apartment to apartment as one health or job crisis follows another and are evicted because they are unable to pay the rent on time. Often they reach the end of the month with little money to spend on food or other necessities. An occasional treat following a payday for one of her parents is a fast food hamburger, fries, and 32 oz. soft drink. They live in a neighborhood bereft of parks but with a surplus of abandoned buildings and crime. School is a refuge for Myra—it is safe and she has friends there, but the teachers are burdened by too many students, too few books, too little pay, and too little training. There is no recess, physical or health education, school nurse or counselor, or computer 11 training. (continued next slide)
Myra– An American (and elsewhere) Tragedy,
                      cont.
Some days she just doesn’t feel like getting out of bed
and going to school, so she just stays home and
watches television. Her mother has a minimum wage
cleaning job in a mall an hour’s ride away by bus, with a
work schedule that changes unpredictably from day to
day. She is employed on an hourly basis by a
subcontractor to the mall and receives no health,
retirement, or other benefits. Her father is a non-union
carpenter, but works only intermittently due to the poor
economy and because he had been previously injured in
a fall from unsafe scaffolding. Because of the fall and
lack of proper medical treatment he has lost some
mobility. Needless to say, her parents do not have any
health insurance and have to rely on public clinics and
emergency rooms for care.                                12
Myra’s Life up to Age 12
• Parental Unemployment & Poverty
• Vulnerable Occupational Status for Parents
• Residential Instability & Poor Housing
• Inadequate Schooling
• Food Insufficiency and “Binging” on Fast/Junk Food
• “Under-endowed” & Dangerous Neighborhoods
• Poor Access to and Poor Quality Health Care
13Myra’s Health (Current)
• Current (at increased risk for, at least)
– Obese
– Poor oral health
– Asthma
– Increased susceptibility to communicable diseases
– Injuries
– Depression
– Type II diabetes
– Early sexual activity and associated risks
– Early illegal and legal substance use
– Other behavioral and social risks (gang membership,
aggression, victimization, social isolation, etc.)
14Myra’s Health (Future)
• Future (at increased risk for)
– Early pregnancy and IUGR births
– Hypertension
– Obesity
– Cardiovascular disease
– Diabetic complications
– COPD
– Musculoskeletal disorders and mobility limitations
– Depression
– Abuse
– Behavioral & Social (illegal involvements, victimization,
adverse occupational trajectories, etc.)
15What Can be Done to Close the Gap
between Myra’s Health and that of
those Better Off Socioeconomically?
Upstream Policies to:
1. Reduce “Child” Poverty and Increase
Opportunity
2. Education and Training
3. Invest in Healthy Communities
4. Reduce Marginalization by Race. Ethnicity, and
Nativity
5. Increase Access to Quality Health Care
6. End Compound Dis-interest 16What Can be Done to Close the Gap
between Myra’s Health and that of
those Better Off Socioeconomically?
Upstream Policies to:
1. Reduce “Child” Poverty and Increase
Opportunity
2. Education and Training
3. Invest in Healthy Communities
4. Reduce Marginalization by Race. Ethnicity, and
Nativity
5. Increase Access to Quality Health Care
6. End Compound Dis-interest 17Mean annual earning (wages & salaries) by quintile
men and women ages 25-64, 1973 and 2003
140000
$117,622 Lowest
120000
Middle
Highest
100000
80000 $88,368 $74,845
60000
38254
$43,187
40000 45010
26152
20000 12461
17976 6601
16301
2475
0
1973 2003 1973 2003
18
Danziger, 2005Rainwater & 19 Smeeding, 2003
Low
Wages
 and
 Child
Poverty

          20
Impact of Taxes and Transfers on Child Poverty
(defined as 50% of median post-tax and transfer income)
30
25
20
15
10
5
0
DK FI NO SW SW CZ FR BG HU NL GE AU GR PO CA UK IR NZ US MX
21The peaks are those “caught” in poverty and
affluence
• 31% of sons in the lowest decile as children will
end up as adults in the lowest decile, 50% will end
up in lowest quintile, and 1.2% end up in top decile
• 23% starting in top decile will end up in top decile,
41% in top quintile, and 2.4% in the lowest decile
• Downward mobility from the top quartile to the
bottom quartile is 5 X greater for Blacks vs Whites
• Wealth?
22
Hertz (2002) in Bowles and Gintis (2002)What Can be Done to Close the Gap
between Myra’s Health and that of
those Better Off Socioeconomically?
Upstream Policies to:
1. Reduce “Child” Poverty and Increase
Opportunity
2. Education and Training
3. Invest in Healthy Communities
4. Reduce Marginalization by Race. Ethnicity, and
Nativity
5. Increase Access to Quality Health Care
6. End Compound Dis-interest 23In 2001, only an estimated 68% of all students who
enter 9th grade will graduate with a regular diploma
in 12th grade.
74.9% for White students
50.2% for Black students
51.1% for Native American students
53.2% for Hispanic students
24Percentage of students in grades 9-12 who reported being threatened or
injured with a weapon on school property during the previous 12 months
25
CDC, Youth Risk Behavior Survey” (YRBS), 1993-2003.Combined Mathematics Literacy Scores by Country
15 year olds, PISA 2003
MEX
TUR
GRE
ITA
POR
USA
SPA
HUN
POL
LUX
NOR
SLO
IRE
GER
AUS
SWE
FRA
DEN
ICE
CZE
NZE
AUS
SWI
BEL
CAN
JAP
NET
KOR
FIL
300 350 400 450 500 550 600
Lemke et al., 2004 26Funding of Education
State governments provide > 90% of funds for K-12 education
53% comes from property taxes (83.9% NM to 38.2% NE)
Local funds provide from 90% (NH) to 21% (AL) of funding
Significant Disparities Exist in Funding/student (1st vs 4th quartile)*
by poverty status- $1,436
by minority status - $ 964
These Number Add Up
Σ for class of 25 Σ for school of 400 Σ for HS of 1500
New York $57,000 $912,000 $3,420,000
Pennsylvania$17,900 $286,400 $1,074,000
27
http://www2.edtrust.org/NR/rdonlyres/31D276EF-72E1-458A-8C71-E3D262A4C91E/0/FundingGap2005.pdfWhat Can be Done to Close the Gap
between Myra’s Health and that of
those Better Off Socioeconomically?
Upstream Policies to:
1. Reduce “Child” Poverty and Increase
Opportunity
2. Education and Training
3. Invest in Healthy Communities
4. Reduce Marginalization by Race. Ethnicity, and
Nativity
5. Increase Access to Quality Health Care
6. End Compound Dis-interest 2829
30
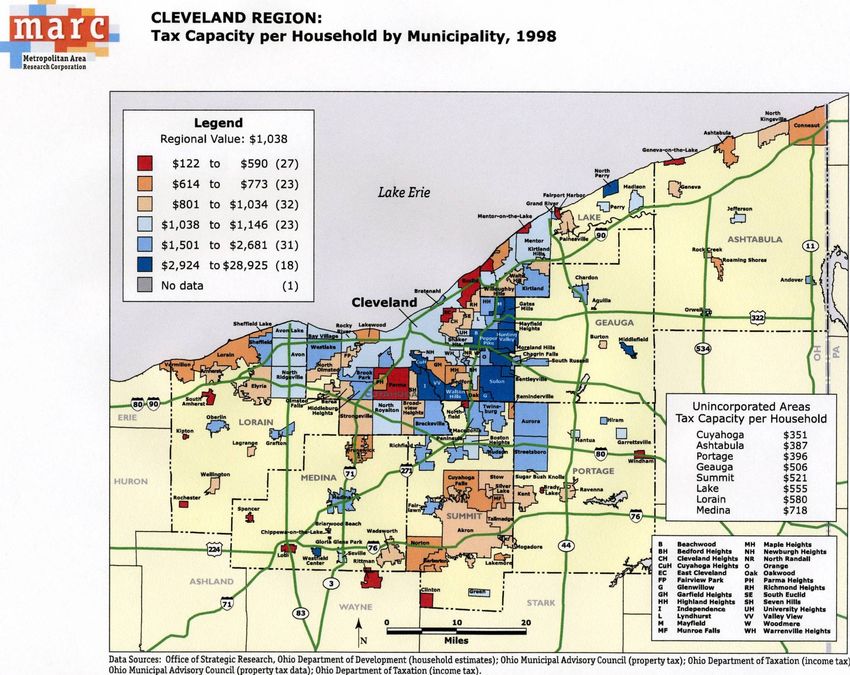
31
Haan, Kaplan & Camacho, 1987
Suburban poor now outnumber poor in the cities
Berube & Kneebone (2006)

                                                 32
What Can be Done to Close the Gap
between Myra’s Health and that of
those Better Off Socioeconomically?
Upstream Policies to:
1. Reduce “Child” Poverty and Increase
Opportunity
2. Education and Training
3. Invest in Healthy Communities
4. Reduce Marginalization by Race. Ethnicity,
and Nativity
5. Increase Access to Quality Health Care
6. End Compound Dis-interest 33What Can be Done to Close the Gap
between Myra’s Health and that of
those Better Off Socioeconomically?
Upstream Policies to:
1. Reduce “Child” Poverty and Increase
Opportunity
2. Education and Training
3. Invest in Healthy Communities
4. Reduce Marginalization by Race. Ethnicity, and
Nativity
5. Increase Access to Quality Health Care
6. End Compound Dis-interest 34“The childhood shows the man, As the morning shows the day”
John Milton. Paradise Lost (1667), Line 220-221.
Adult Health Birth Outcomes
Risk Factors &
Environment
Child Health
35Parental
Gestational
Infancy
Early Childhood
Middle Childhood
Adolescence
Early Adulthood
Middle Age
Old Age
36Compound Dis-interest • Myra’s life (and others like her) represents a policy of “compound dis-interest.” • Time after time, system after system, there has been a failure to sustain and nourish the capacity for health and development. It is not difficult to envision how the fragility of her parent’s situation in an unstable economy that has stripped away many social protections, neighborhoods bereft of resources and oversupplied with problems, an over- burdened and under-resourced educational system, and a failed social, public health and social insurance system could put Myra’s health and development at risk. Nor is it hard to imagine that these forces played out over a life course could act synergistically, compounding the threats to Myra’s development and health over her life course and even acting on subsequent generations. 37
Compound Dis-interest
Myra, her parents, and perhaps her future children are but a
thread in the unraveling quilt created by compound
dis-interest and consequent health disparities. With little
imagination one can visualize a society filled with Myras and
Maxes, where there is a compounding of dis-interest that
blankets current and future generations, where a vision of
healthy and productive lives for all is blocked by exponentially
expanding disadvantage and blocked capability. Where the
gap between what is possible and what is realized grows
larger and larger.

If we mind this gap, and if we pay attention to the social and
economic policies that produce it, we just might improve
health and reduce disparities in health.
                                                            38
You can also read