Dramatic global decrease in the range and reproduction rate of the European hamster Cricetus cricetus - Inter-Research Science Publisher
←
→
Page content transcription
If your browser does not render page correctly, please read the page content below
Vol. 31: 119–145, 2016                 ENDANGERED SPECIES RESEARCH
                                                                                                    Published October 6
     doi: 10.3354/esr00749                      Endang Species Res

                                                                                                    OPEN
                                                                                                    ACCESS
 FEATURE ARTICLE
 REVIEW

Dramatic global decrease in the range and reproduction
   rate of the European hamster Cricetus cricetus
         Alexey Surov1, Agata Banaszek2, Pavel Bogomolov1, Natalia Feoktistova1,
                                  Stefanie Monecke3,*
     1
      Severtsov Institute of Ecology and Evolution, Russian Academy of Science, Leninsky pr. 33, Moscow, 119071, Russia
                   2
                    Institute of Biology, University of Białystok, Ciołkowskiego 1J, 15-245 Białystok, Poland
                                3
                                 Institute of Chronoecology, Bismarckstr. 1, 77694 Kehl, Germany

 ABSTRACT: Although the European hamster is probably
 the fastest-declining Eurasian mammal, its IUCN Red
 List status is still Least Concern. In addition to the huge
 distribution area, this categorization is based on the as-
 sumptions (1) that the decline affects only Western Europe,
 where (2) modern agriculture has led to (3) an increase in
 the mortality of the species. Since mortality-reducing
 protection measures in Western Europe have been un-
 able to stop the decline, we reviewed the literature from
 1765 to the present and reappraised the situation. We
 found support for none of these assumptions. The species
 has also vanished from more than 75% of its range in
 Central and Eastern Europe. In 48 of 85 Russian, Be-
 larussian, Ukrainian and Moldovan provinces, its relative
 occurrence has decreased. It is now rare in 42 provinces
 and extinct in 8. Mortality has not increased, but the re-
 production rate has shrunk since 1954 throughout the
 distribution area. Today the reproduction rate is only         Adult female European hamster Cricetus cricetus.
 23% of that between 1914 and 1935. Taking into account
                                                                                                         Photo: Holger Fuchs
 the mortality of this prey species, 1 female today raises
 only 0.5 females for next year’s reproduction. The extra-
 polation of the literature data points to an extinction of
 the species between 2020 and 2038. We strongly recom-                              INTRODUCTION
 mend (1) changing the status of the European hamster on
 the IUCN Red List from Least Concern at least to Vulner-         Until the 1970s, European hamsters were a much
 able or even Endangered and (2) supporting scientific re-      feared agricultural pest throughout their distribution
 search on the reproduction of European hamsters as a           area. In ‘normal’ years, densities of 10 to 80 individu-
 protection measure. Global threats such as climate
                                                                als per hectare were common (Ružić 1977, N echay
 change, light pollution or (in the past) fur trapping are
                                                                2000). During pest outbreak years, which were fre-
 more likely to be the ultimate reason for the decline of
 this species than modern agriculture.                          quent until the 1980s, population densities could in-
                                                                crease to more than 2000 individuals per hectare as
 KEY WORDS: Cricetus cricetus · Distribution · Repro-           counted in Slovakia in 1971 (Grulich 1980, N echay
 duction · Climate change · Light pollution · Global threats    2008). Thereafter, populations experienced a remark-
                                                                able decline, which was first reported in Western Eu-
                                                                © The authors 2016. Open Access under Creative Commons by
 *Corresponding author:                                         Attribution Licence. Use, distribution and reproduction are un-
  stefanie.monecke@institute-chronoecology.com                  restricted. Authors and original publication must be credited.
                                                                Publisher: Inter-Research · www.int-res.com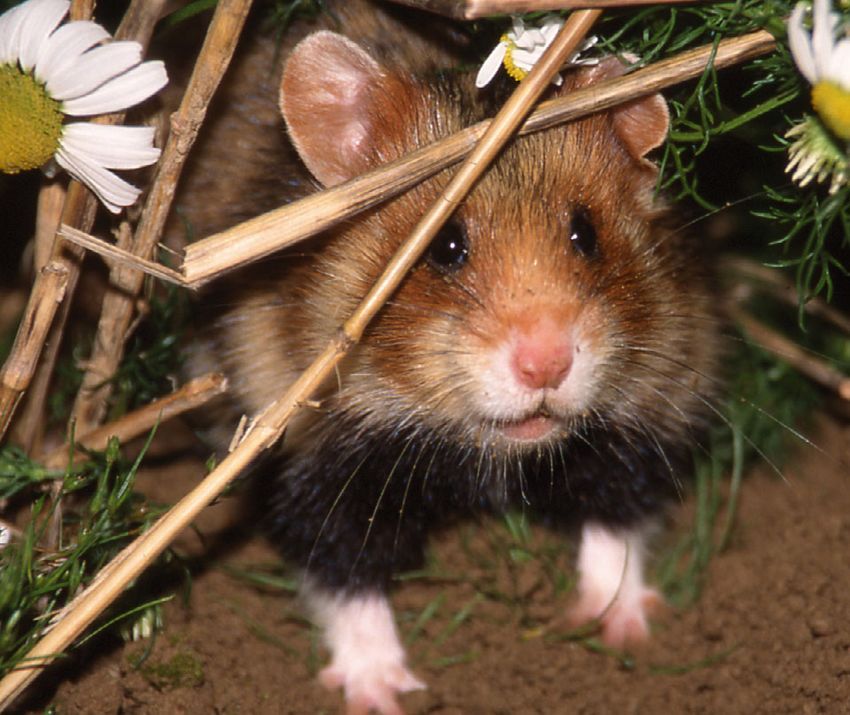
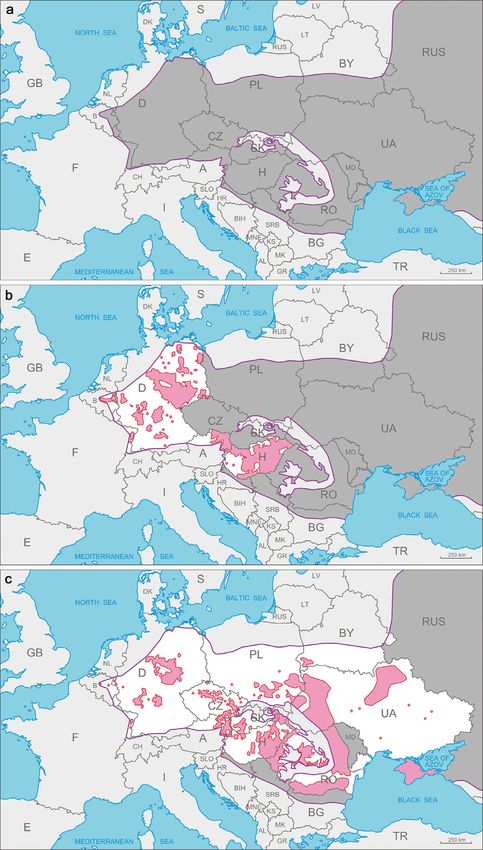
120                                     Endang Species Res 31: 119–145, 2016

rope. In areas where the European hamster still             with only hamster-friendly management. In the
exists, densities are often lower than 1 to 2 individuals   Netherlands, population size increased (Kuiters et al.
per hectare (Kayser et al. 2003a, Kuiters et al. 2011).     2011), and in Germany (U. Weinhold pers. comm.)
The species was included in Appendix II (strictly pro-      and France (Amand et al. 2012), populations could be
tected species) of the 1979 Bern Convention on the          stabilized to very low levels. However, if the number
Conservation of European Wildlife and Natural Habi-         of reintroduced animals is lowered, the populations
tats, and since 1992, it has been listed in Appendix IV     break down immediately (Kuiters et al. 2011).
of the Habitats Directive, which provides strict legal        The protection of the European hamster is as yet
protection in all European Union countries (Ziomek &        not sufficient, suggesting that the reasons for its de-
Banaszek 2007). In France, Belgium, the Netherlands         cline are not fully understood. Moreover, the IUCN
and Germany, protection measures have been imple-           still classifies the European hamster as Least Con-
mented for at least 15 yr. Since European hamsters          cern (Kryštufek et al. 2008). This classification and
prefer agricultural areas as habitat, farmers are com-      current measures are based on 3 assumptions: (1) the
pensated by 450 to 2250€ per year and hectare (Lauss-       decline is restricted to Western Europe, where (2)
mann & Fabry 2008, Amand et al. 2012, MKULN V               modern industrial agriculture has led to an increase
2013) for so-called hamster-friendly field manage-          in the mortality of European hamsters. Focussing on
ment. This type of management aims to reduce mor-           this argumentation, we reviewed literature from
tality (Villemey et al. 2013) presumably caused by          across the distribution area. Moreover, by reviewing
industrialized agriculture and includes small-scale         historical literature from 1765 to the present, we
cultures, restricted ploughing and late or no harvest       explored other reasons for the decline, such as fecun-
to provide year-long food and cover for hamsters            dity. We added our own data on present distribution
(Kayser & Stubbe 2002, Köhler et al. 2014, La Haye et       and reproduction. Based on these results, we define
al. 2014). The French national action plan for the Eu-      properties of the potential factors impairing the sur-
ropean hamster for 2012 to 2016 provided 4 400 000€         vival of the species and finally discuss additional fac-
just for this purpose (Amand et al. 2012).                  tors that merit consideration. The aim of this study is
   The latest census data have revealed that this ham-      to contribute to a better understanding of the decline
ster-friendly management has thus far not had the           of the European hamster.
desired effect. In spite of protection measures, the
European hamster has vanished from 75% of the
Alsatian sites (France) that were still inhabited in          DECLINE OF EUROPEAN HAMSTERS IS NOT
1997 (Amand et al. 2012, Reiners et al. 2014). In Ger-           RESTRICTED TO WESTERN EUROPE
many, the species has been lost from one-third of the
inhabited grid-squares since 1998 (compare Weid-              The original distribution area of European ham-
ling & Stubbe 1998 and the national Fauna-Flora-            sters (between 42 and 55° N and between 5 and
Habitat Report of Germany 2013, Bundesamt für               95° E; N echay 2000) covered nearly the whole tem-
N aturschutz 2013); however, in some regions, the           perate zone of Eurasia and extended roughly from
animal vanished from 90% of the areas (compared to          the Rhine River in the West to the Yenissei River in
1990; Meyer 2009). Moreover, hamster densities have         the East (Nechay et al. 1977).
declined dramatically within the still-inhabited areas,       In Western Europe, i.e. the Netherlands, Belgium,
for example by 90% from 250−280 animals in 2006 to          France, Germany and Switzerland, the decline of
ca. 25 in 2015 (D. Geiger-Roswora pers. comm.) or by        European hamster populations was noticed first (for a
97% from 9292 active burrows in 2002 to 283 in 2011         review, see Nechay 2000) (Fig. 1a,b and see Table S1
(Mammen 2011a). Moreover, we could not find any             in the Supplement at www.int-res.com/articles/suppl/
report which indicates that hamster-friendly field          n031p119_supp.pdf), and thus it was assumed that
management increases the numbers of European                this problem concerned only the western limit of the
hamsters. If at all, it stabilizes the populations, but     species’ distribution. However, it soon became clear
most often hamster numbers continue to decrease             that the range reduction also dramatically affected
(Martens 2005, Mammen 2011b, Walz 2011, Wein-               many Central European countries (Fig. 1c, Table S1).
hold 2011). Since 2001, European hamsters have              In almost all countries in which monitoring was per-
been bred in captivity for reintroduction programmes        formed recently, the species has lost large parts of its
to hamster-friendly areas in 3 regions (Alsace/France,      original territory so that today its range is usually
Limburg/the N etherlands, Mannheim/Germany).                fragmented (Ambros et al. 2003, Bihari 2003, Ziomek
This measure was more successful than the approach          & Banaszek 2007, Tkadlec et al. 2012). Even in East-

Surov et al.: Global decline of European hamsters                                121

                                                                                  ern Europe, for example in Ukraine,
                                                                                  where it was common belief that the
                                                                                  hamster was abundant all over the
                                                                                  country, recent studies confirmed only
                                                                                  3 areas of occurrence: Western Ukraine,
                                                                                  Northeastern Ukraine and the Crimea
                                                                                  (Korbut et al. 2013, Rusin et al. 2013).
                                                                                  The species became extinct in most
                                                                                  parts of the steppe zone and declined
                                                                                  within the forest−steppe zone (Rusin
                                                                                  et al. 2013). In summary, the European
                                                                                  hamster has lost more than 75% of its
                                                                                  range in most European countries. Ex-
                                                                                  ceptions are Hungary, where two-
                                                                                  thirds of the range remain but popula-
                                                                                  tions are decreasing (Bihari 2003), and
                                                                                  Romania, in which the range seems to
                                                                                  be largely unchanged (Hegyeli et al.
                                                                                  2015).
                                                                                     In the Western European part of the
                                                                                  range, where conservationists and gov-
                                                                                  ernments have been aware of the de-
                                                                                  cline of European hamsters for at least
                                                                                  20 yr, populations are observed care-
                                                                                  fully. Such intense monitoring is not
                                                                                  possible across the entire Eurasian
                                                                                  range, especially since in many coun-
                                                                                  tries, the species, although legally pro-
                                                                                  tected, does not receive any active pro-
                                                                                  tection on the governmental level. The
                                                                                  studies in Central and Eastern Europe,
                                                                                  on which Fig. 1 is based, used several
                                                                                  sources of information (Table S2 in the
                                                                                  Supplement) which were verified by
                                                                                  careful fieldwork.
                                                                                     There are only a few European
                                                                                  countries for which no recent data
                                                                                  exist (Fig. 1c). However, in the light of
                                                                                  the present data, it is unreasonable to
                                                                                  expect that the distribution and num-
                                                                                  bers of European hamsters are un-
                                                                                  changed in unsearched parts of the
                                                                                  range. Likewise, since searching for
                                                                                  hamsters in thousands of hectares of
Fig. 1. Distribution of European hamsters Cricetus cricetus in Europe, exclud-    agriculture fields is akin to looking for
ing Russia. (a) Range before 1982 according to Niethammer (1982) (dark grey,      a needle in the proverbial haystack, it
violet borders; also applies to panels b and c). (b) Updates (Weidling & Stubbe   is possible that in some areas consid-
1998, Nechay 2000, Weinhold 2008) as of 1998 (red) show a strong decline in
hamster populations in Western Europe. (c) Current (status as of 2015) distri-
                                                                                  ered not inhabited any more, the ham-
bution in Europe according to literature given in Table S1 in the Supplement      sters may still be present in extremely
at www.int-res.com/articles/suppl/n031p119_supp.pdf, with further declines        low numbers. In Poland, an active
in Western Europe and remarkable declines in Central and Eastern Europe.          locality was found in Lower Silesia
Where no recent data are available, the distribution is left unchanged (dark
                                                                                  (Auguścik & Ziomek 2013), which was
grey). Further literature used to create this figure is listed in the Appendix.
A: Austria, B: Belgium, BG: Bulgaria, BY: Belarus, CH: Switzerland, CZ: Czech     thought to be abandoned by the spe-
Republic, D: Germany, F: France, HR: Croatia, H: Hungary, MD: Moldova,
N L: the N etherlands, PL: Poland, RO: Romania, RUS: Russia, SK: Slovakia,
                    SRB: Serbia, SLO: Slovenia, UA: Ukraine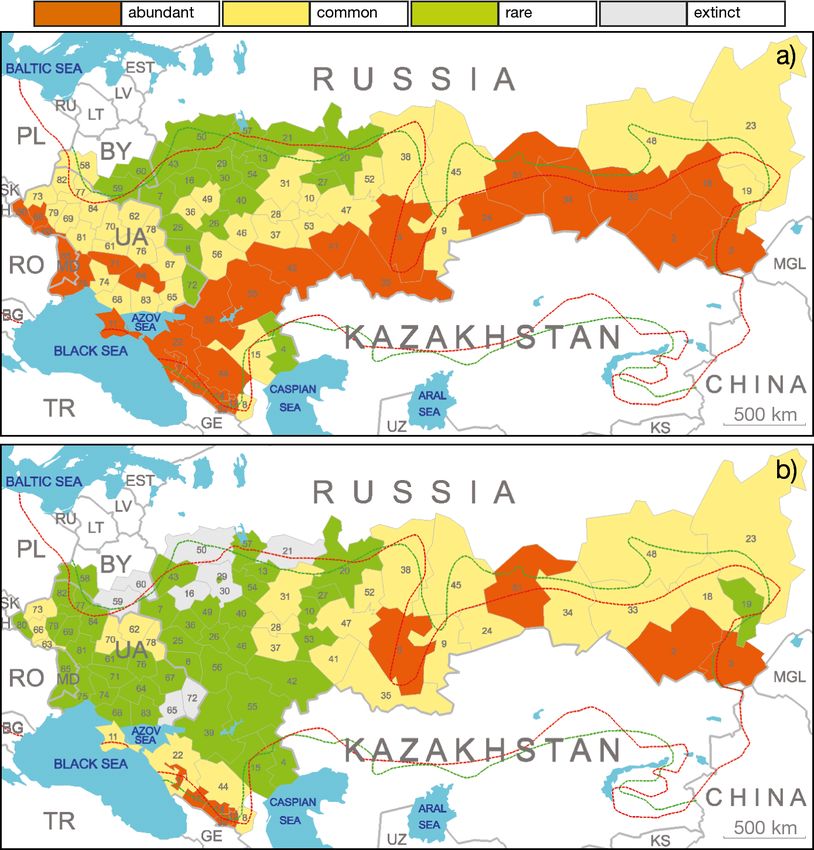
122                                        Endang Species Res 31: 119–145, 2016

cies (Ziomek & Banaszek 2007). How-
ever, such findings do not change the
general picture of the dramatic distri-
bution decline, as small isolated popu-
lations are subjected to random demo-
graphic and genetic processes and
may disappear at any moment (Banas-
zek et al. 2011).
   Mapping an exact distribution is
even more difficult when it comes to
the hamster’s huge eastern and Asiatic
distribution area. For Russian, Bela-
russian, Ukrainian and Moldavian pro-
vinces, we thus compiled data on the
relative occurrence of European ham-
sters before and after 1970. To make
them comparable, we used 4 cate-
gories: extinct, rare, common and abun-
dant. The information is based on the
literature, museum data and a historic
map of intense fur harvesting of Euro-
pean hamsters (N eronov 1965) (see
Table S3 in the Supplement). ‘Extinct’
was assigned to a province when it
was explored in numerous locations
and the species was absent every-
where. This term was used with great
care and was not assigned to a region         Fig. 2. Relative abundance (orange: abundant, yellow: common, green: rare,
                                              grey: extinct) of European hamsters Cricetus cricetus in their eastern range (a)
when the slightest doubt existed. ‘Rare’
                                              before and (b) after 1970. Numbers replace the names of provinces, which are
was assigned to a province if we had          listed in Table S3 in the Supplement. The red line indicates the historical spe-
reports about the species’ presence in        cies range in the 1940s and 1950s according to Kucheruk (1959) and the green
1, 2 or 3 locations or if the studies did     line in the 1960s according to Neronov (1965). Sources are given in Table S3
not satisfy the strict criteria for extinct.  and in the Appendix. BG: Bulgaria, BY: Belarus, EST: Estonia, GE: Georgia, H:
                                              Hungary, KS: Kyrgyzstan, LV: Latvia, LT: Lithuania, MD: Moldova, MGL: Mon-
‘Common’ was used when species was            golia, PL: Poland, RO: Romania, RU: Russia, SK: Slovakia, TR: Turkey, UA:
reported from numerous localities in a                                   Ukraine, UZ: Uzbekistan
province, but the numbers of individu-
als in these localities were low. The
same accounts for ‘abundant’, but here the species’              Europe), but in others (Caucasus and Siberia) the
presence in the reported localities was notable. In              species is still abundant. We did not observe an in-
this case, locals often reported hamsters in agricul-            crease in the relative occurrence in any province. In
tural areas, in natural conditions and even in human             37 regions, the category did not change (0). Deterio-
settlements.                                                     ration by 1 category (−1) was found in a total of 39
   The density of European hamsters declined in most             provinces. A severe deterioration by 2 categories (−2)
of the 85 provinces in this part of the distribution area        occurred in 9 provinces. The decline predominantly
(Fig. 2). Before 1970, the European hamster was                  affected provinces in the west and in the south, with
abundant in 28 provinces, common in 37 and rare in               provinces in the southwest being most affected. This
20. Today, the species is abundant only in 8 and com-            development suggests a fragmentation of popula-
mon in 27 provinces, but it is rare in 42 and extinct in         tions in this part of the distribution area. When con-
8 provinces.                                                     sidering only areas in which the European hamster
   The rate of decline of the European hamster in                has the best chances for survival, i.e. where it is (i)
Ukraine, Belarus, Moldova and Russia differs be-                 common or abundant and (ii) has not declined, the
tween regions (Fig. 3). In some regions we see dra-              maps suggest that populations will separate into 7
matic changes and even full extinction (Eastern                  fragments (Fig. 4). Two are in Ukraine in the western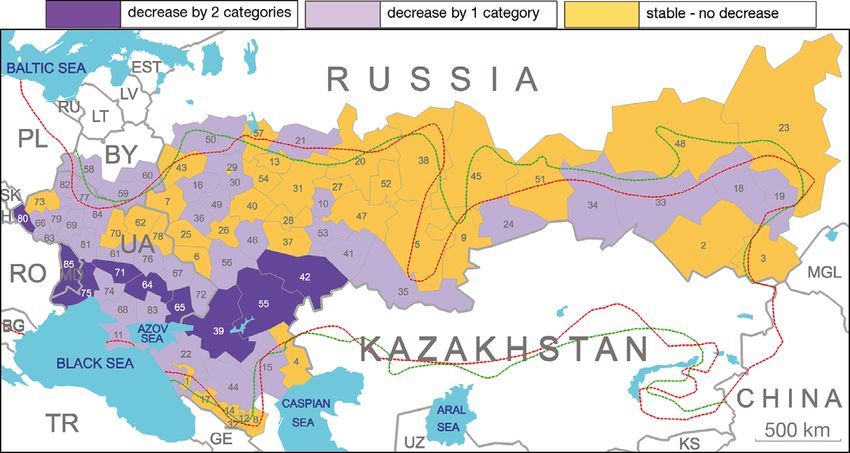
Surov et al.: Global decline of European hamsters                                   123

                                                                                     for a short increase between 1988 and
                                                                                     1990, after which the species became
                                                                                     extremely rare. Moreover, the number
                                                                                     of suitable habitats declined. N ever-
                                                                                     theless, the European hamster is not in
                                                                                     the Red Book of Kazakhstan and is not
                                                                                     considered threatened (A. Shmalenko
                                                                                     pers. comm.) In Kostanai oblast of Ka-
                                                                                     zakhstan, the European hamster is
                                                                                     quite common in wet biotopes within
                                                                                     natural and grazed steppe areas (A.
                                                                                     Shmalenko pers. comm., Oct 2015).
                                                                                     More data on the recent distribution of
                                                                                     European hamsters in Kazakhstan are
Fig. 3. Rate of decline in the relative occurrence of European hamsters Crice-       needed.
tus cricetus in their eastern range based on the comparison of historic (before
                                                                                        According to Kucheruk (1959), the
1970) and recent (since 1970) sources (see Table S3 in the Supplement). Liter-
ature used to create this figure is listed in the Appendix. We distinguish be-       European     hamster was present in
tween densities (0), moderate declines by 1 category (–1) or dramatic declines       northeastern China in the region of
                 by 2 categories (–2). For further details see Fig. 2                Xinjiang. Today the species is catego-
                                                                                     rized as near threatened on the Chi-
                                                                                     nese Red List, although it nearly meets
                                                                                     the criteria for vulnerable (Smith & Xie
                                                                                     2008).
                                                                                        Despite the declines of European
                                                                                     hamsters in rural areas, stable popula-
                                                                                     tions were found in cities across the
                                                                                     distribution area, including Brno, Koš-
                                                                                     ice, Lublin, Moscow, N alchik, Omsk,
                                                                                     Simferopol and Vienna (Feoktistova et
                                                                                     al. 2013, Feoktistova et al. 2016) where
                                                                                     synurbanization is observed. This
                                                                                     shows that the factors affecting popu-
                                                                                     lation dynamics are still unclear and
Fig. 4. Likely future occurrence of European hamsters Cricetus cricetus in           must be studied in more depth.
Eastern Europe and Russia based on past changes in the relative abundance
                                                                                        In summary, except for very few
(see Table S3 in the Supplement). In provinces marked in yellow, hamsters are
presently (i) common or (ii) abundant and not declining and should thus have         countries   such as Romania and very
better chances of survival than in other provinces. For further details see          few regions in Ukraine and Russia, a
Fig. 2. For literature used to create this figure see the Appendix and Table S3      dramatic decline in range and/or rela-
                                                                                     tive occurrence of the European ham-
(province 73) and northern parts (provinces 70, 62,                   ster has occurred throughout its distribution area.
78), which fits well with the distribution data (see                  Consequently, there is a high probability of inter-
Fig. 1). Of the 5 remaining fragments, 1 is mainly in                 rupted gene flow, which has already been confirmed
the North Caucasus (provinces 17, 11, 12, 32, 8), 1 is                in many European areas (N eumann et al. 2005,
in the western Volga region (provinces 31, 28, 37), a                 Banaszek et al. 2011, La Haye et al. 2012b) where
large fragment is in the eastern Volga and Ural                       population fragments are separated by hundreds of
region (provinces/republics 5, 47, 52, 38, 45, 9), and 2              kilometers. Highly fragmented urban areas can
are in Siberia (provinces 48, 23 and province/                        impair gene flow over distances as short as 2 km
republic 2, 3) (Fig. 4).                                              (Feoktistova et al. 2016), and this can lead to a re-
  From Kazakhstan we only have density data for the                   duction in variability; for example, colour variants of
past (Neronov 1965) but not for the present. Accord-                  the European hamster such as flavistic, piebald,
ing to Lindeman et al. (2005), hamsters were abun-                    albinistic and melanistic variants have decreased
dant in Western Kazakhstan up to the mid-1970s.                       since the 1950s and are now seldom reported (Kayser
The number declined dramatically thereafter, except                   & Stubbe 2000).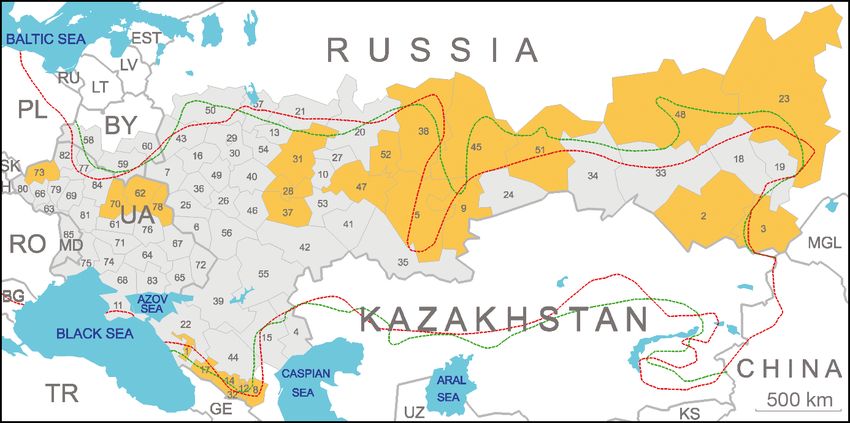
124                                      Endang Species Res 31: 119–145, 2016

      ‘Modern agriculture’ seems unlikely to be              and 1967 (Traue 1970) to 0 to 15% between 1992 and
          the main reason for the decline                    2010 (Allert & Löw 2011) in East Germany. In a Hun-
                                                             garian study of the eastern imperial eagle Aquila
  Originally, ‘modern agriculture’ seemed to be the          heliaca it declined from ca. 20% between 2005 and
most obvious reason for the decline of European              2008 to 4% in the years 2011 and 2013 (Szabó 2013);
hamsters (for a review, see Weinhold 2008). How-             moreover, many predators are also in decline.
ever, the fact that the species declined all over the           In contrast, historically the extrinsic mortality of
distribution area, with different landscapes, field sizes,   European hamsters due to fur trapping and pest con-
main crops, agricultural philosophies, and under             trol was exorbitant. Early reports of fur trapping in
both conventional and organic or under traditional           Germany date from the 16th to the 19th century
and modern farming, makes it unlikely that ‘modern           (Hofmeister 1965, Stubbe & Stubbe 1998). Between
agriculture’ is the main reason. Moreover, we could          the early 20th century and the 1970s, the number of
not find literature which defines the term ‘modern           hamsters trapped annually reached hundreds of
agriculture’ or which relates different agricultural         thousands or even millions in many regions across
practices to population densities. Experiences from          Eurasia (see Table S4 in the Supplement). Fur hunt-
hamster-friendly field management, which includes            ing alone killed more hamsters in a region than are
profound changes in the agricultural practices, are          presently estimated to inhabit the whole of Europe.
thus the only source of information. However, after          In addition, intensely targeted pest control actions
the implementation of hamster-friendly practices, no         against European hamsters, such as poisoning,
increase in hamster numbers could be ascertained             gassing or drowning, were implemented throughout
(Martens 2005, Mammen 2011b, Walz 2011, Wein-                the range (Hofmeister 1965, Hubert 1968, Nechay et
hold 2011, Amand et al. 2012). Finally, the onset of         al. 1977, Adler & Zimmermann 2013), which killed
the decline of the European hamster also makes it            additional high but undefined numbers of hamsters.
appear highly unlikely that modern agriculture is            To our knowledge, fur hunting ceased in most coun-
one of the main causes, since modern farming meth-           tries at the latest in the 1990s, since low hamster
ods started much later than the decline of European          numbers rendered trapping uneconomical. In Hun-
hamsters. In Germany, hamsters declined as early as          gary it lasted longer, although today it is very rare (G.
the 1920s (Eisentraut 1928, Petzsch 1933, Stubbe &           N echay pers. comm.). In Russia, harvesting sharply
Stubbe 1998, Monecke 2013); in Hungary between               decreased after 1970−1972. It continues to the pres-
1960 and 1980 (Bihari 2003); and in the Omskaya              ent only in 8 regions on a very small scale. Targeted
oblast in Siberia in the late 1950s (Sidorov et al.          pest control actions against European hamsters have
2011).                                                       largely ceased because there is no further need.
                                                             Even though European hamsters may still succumb
                                                             to general rodenticides, it seems safe to assume that
        No literature evidence for increased                 the 2 most severe causes of mortality in European
                 extrinsic mortality                         hamsters are no longer present.
                                                                Due to increasing vehicle traffic, road mortality
   We could not find any literature showing that in          might have gained in importance as a reason for the
European hamsters, the extrinsic mortality by preda-         decline in numbers of European hamsters. High traf-
tion or anthropogenic factors has increased. The             fic mortality was already reported in the 1960s when
monthly mortality rate of adults is currently rather         streets were covered with hamster cadavers in mass-
low and is similar in both hamster-friendly (3−17%,          outbreak years (for a review, see Grulich 1980). In
La Haye et al. 2014; 5−19%, Kuiters et al. 2011, both        such a mass-outbreak year, Kemper (1967) counted
for the N etherlands) and intensely farmed large             2400 dead hamsters per week on a 12 km long road
fields (depending on culture, mortality ranges from          stretch in Austria. In contrast, between 2001 and
2−7 to 3−18% in eastern Germany, Kayser et al.               2007, a total of only 197 hamster carcasses were
2003a). Only in 1 area in western Germany did it             found on ca. 50 km of country lanes in Thuringia, the
increase temporarily to 43% directly after harvest           region with the highest population density of Euro-
(Kayser et al. 2003a). These numbers are surprisingly        pean hamsters in Germany (Zimmermann 2008). As
low for a prey species.                                      Grulich (1980) suggested, the number of road-killed
   Furthermore, the percentage of European ham-              hamsters seems to reflect the population densities,
sters in the diet of birds of prey such as the red kite      and thus traffic is considered to be of minor impor-
Milvus milvus decreased from 49.5% between 1962              tance as a mortality factor today.
Surov et al.: Global decline of European hamsters 125
The only indication of increased mortality is linked (Górecki 1977b). The consistency between historic
to the eastward shift of the oceanic−continental cli- and recent data of litter size (see Fig. 7) shows that
mate gradient leading to increasing oceanic climate the potential losses are similar with all techniques.
in Western Europe. Historically in Germany, snow Data on maculae cyanae, uterine scars that indicate
covered the ground in winter, but due to higher win- a previous implantation of an embryo, were not in-
ter temperatures, soils are now saturated from huge cluded, since it is unknown how long they stay. Their
quantities of rain, which affects hibernacula and food number typically ranges between 1 and 45 and might
stores. In Germany, European hamsters are thus in- reach up to 140 (Weber & Stubbe 1984, Grulich
creasingly reported by locals as being active above 1986).
ground in winter with their fur soaked (U. Weinhold, Mean embryo number, assessed from dead-trapped
M. Görner pers. comm. 2015). Thus, rising winter tem- females (historic data, Table S5 in the Supplement) or
peratures in precipitation-rich areas such as Western by palpation of living females (recent data, Table S6
Europe might increase mortality. in the Supplement), was stable until 1986: between
In summary, the literature suggests that the extrin- 1925 and 1950 it was 12.00 ± 1.08 (± SEM, n = 8 stud-
sic mortality of European hamsters is much lower at ies), between 1951 and 1975, it was 12.02 ± 1.12 (n = 6),
present than historically. To what extent a climatic and between 1976 and 1986, it was 12.61 ± 1.12
shift has affected mortality in recent years remains to (n = 7). After 2000, it decreased slightly to 9.95 ± 0.83
be studied. It appears unlikely that modern farming (n = 4; Fig. 5). This decrease might be attributed to
practices are killing European hamsters on a larger the different methods used. Moreover, the data show
scale than fur trapping and pest control did in the high variance, which might result from counting
past. embryo numbers at various unknown ages of females
and embryos. Embryo resorption reduces their num-
ber with increasing prenatal age (Weber & Stubbe
Reproduction rate has dramatically decreased 1984). Moreover, embryo numbers are higher in
older females (Gyurkó 1975). Females which gestate
A population is stable when the reproduction rate in their birth year have, on average, 5 embryos while
compensates the mortality rate. Since the extrinsic older females have 10 (Nechay et al. 1977).
mortality of European hamsters does not seem to Data on number of litters and litter size are clearer.
have increased, we reviewed literature on their Literature sources and details are given in Tables S7−
reproduction rate published since 1765 from across S10 in the Supplement. Some articles give several
the distribution area, i.e. embryo numbers, litter size data, e.g. Grulich (1980) indicated a litter number of
(pups per litter) and the number of litters a female 3 for young females and 4 to 5 for old females. In such
has in a year. Data until 1986, i.e. before the decline cases, both values, 3 and 4.5, were included in the
was noticed in Western Europe, are summarized as graph.
historic data, while later data are called recent data.
Most historical data came from field guides, ency-
clopaedias or from ‘natural histories’, i.e. detailed
monographs on European hamsters. The recent data
for number of litters and litter size come from scien-
tific articles in which the reproduction rate of focal
females was observed. Historic and recent litter num-
bers and litter sizes might have been measured by
different techniques. Today, exact litter numbers are
determined by the observation of focal females,
while in historic works, farmers, who knew the local
fauna, were probably the source of information. In
historic times, litter size was often determined by
digging out or floating a burrow. More recently, pups
are counted only when they leave the maternal bur- Fig. 5. Mean number of embryos in European hamsters Cri-
row, i.e. at an older age, reducing the chances that cetus cricetus in various regions of their distribution area
plotted against the publication year of the original studies
the litter is still complete. However, in historic stud- (see Tables S5 & S6 in the Supplement). (D) Historic data
ies, pups might have been overlooked in the burrow (n = 23); (s) recent data (n = 4). Literature used to create this
or drowned before they appeared at the surface figure is listed in the Appendix126 Endang Species Res 31: 119–145, 2016
Before 1986, a female produced mostly 2 to 2.5 lit- gradient in the yearly litter number as previously
ters per year (Fig. 6), but there was a large range assumed (Leirs 2002). Mean litter numbers from
from 1.5 to 4.5 between 1925 and 1985. From a mod- historical data are: France 2.5 ± 0.3, Germany 2.3 ±
ern point of view, a mean litter number of 4.5 0.1, Czech/Slovakia/Czechoslovakia 2.8 ± 0.3, USSR
(Nechay et al. 1977, Grulich 1980, Sládek & Mošan- 2.2 ± 0.1.
ský 1985) might appear too high, although 5 gesta- The litter size before 1910 was ca. 8 (5.5−11) pups
tions per year have been reported for females in cap- per litter (Fig. 7a). Between 1914 and 1955, a litter
tivity (Samosh 1975) and are thus within the possible usually had 10 to 11 pups, but after this period, litter
range. The overall mean yearly litter number from size decreased dramatically (Fig. 7a, Tables S9−S11
historic data was 2.46 ± 0.1 (n = 59; mean ± SEM). In in the Supplement). To estimate the start of the de-
contrast, recent litter numbers are considerably cline, we performed a segmented regression analysis
lower, at 1.64 ± 0.1 (n = 6) and their range is reduced in Sigma Plot (SPSS) from the past 100 yr. This proce-
(between 1.4 and 1.9, Fig. 6). There was no east−west dure is based on a change-point model, in which the
linear relationship may change at a point that is not
fixed in advance (Vieth 1989):
fx = Ax ≤ t
(1)
fx = A + b (x − t) x > t
where fx is the predicted value of the nth data point, x
is the nth time point, and A is the amplitude of the
plateau. Constant b describes the slopes of the de-
crease, and t is the abscissa of the change point. For
further details see Monecke et al. (2006). The regres-
sion revealed that the decline started in 1954 ±
4.03 yr (± SE, Fig. 7b). The data strongly suggest that
this decline is ongoing. The extrapolation of the re-
gression line points towards a litter size of 0, i.e. an
Fig. 6. Mean number of litters produced per year by Euro- extinction of the species, in 2038; however, when the
pean hamsters Cricetus cricetus across their distribution range of the data is considered, extinction could oc-
area plotted against the publication year of the literature cur as early as 2020 (Fig. 7b). Theoretically, the ex-
source (Tables S7 & S8 in the Supplement). (D) Historic data
from 1765 until 1985 (n = 59); (s) recent data after 1996 tinction could also occur as late as 2050 (Fig. 7b),
(n = 6). Literature used to create this figure is listed in the although we consider this possibility unlikely, since
Appendix the reproduction rate is so low that in any year with a
Fig. 7. Mean litter sizes in European hamsters Cricetus cricetus plotted against the publication year of the respective literature
sources (Tables S9 & S10 in the Supplement). (D) Historic data from 1765 until 1985; (s) recent data after 1995. Data are from
across the distribution area. Literature used to create this figure is listed in the Appendix. (a) All data, (b) results of the seg-
mented regression analysis. Data points from 1914 and thereafter were fitted with a regression consisting of 2 straight lines
(solid) with a correlation coefficient of r = 0.84. Their crossing point (t) gives the beginning of the decline in litter size, which is
in 1954 ± 4.03 yr (± SE). The x-axis crossing of the extrapolation of the regression line and its parallel translations through the
upper and lower limit of the data (dashed lines) show the time frame during which the extinction of the species can be expectedSurov et al.: Global decline of European hamsters 127
reproduction rate below average, regional populations Ukrainian, Belarussian and Moldavian provinces
might be so weakened that random unfavourable cir- (Fig. 4), since the data cover an enormous geograph-
cumstances could lead to spontaneous extinction at ical range. Indeed, a recent review (Sidorov et al.
any moment. 2011) (which was not included in the graphs on re-
When data are split into different geographical production because it does not constitute original
regions, it becomes evident that this dramatic de- work on focal females and it is not clear whether the
crease in litter size affects most, if not all, regions of data originated from recent studies) gives a yearly lit-
the distribution area (Fig. 8). Except for the former ter number of 2 (Russia, midlands) or even 3 (south-
USSR, the decline rate was similar in all regions, as ern Russia) and a mean litter size of 10.5 pups (Siberia).
were the litter sizes at any given time. The extent of the data exceeds by far all recent data
That this effect is less clear in the former USSR from studies on focal females, but the data originate
might be due to the short time span covered by the from regions in which the occurrence of the Euro-
available data. However, it might also reflect a differ- pean hamster is mainly stable and high (Figs. 2 & 3).
ence in the reproduction rate between stable, declin- A confirmation of these data and a comparison of the
ing and rapidly shrinking populations in Russian, reproduction rate between declining and stable
Fig. 8. Litter sizes of European hamsters Cricetus cricetus in
different regions of their distribution area. For further de-
tails see ‘Reproduction rate has dramatically decreased’)
and Fig. 7128 Endang Species Res 31: 119–145, 2016
populations as well as between phylogeographical sharply reduced litter number after 1986 (Fig. 6)
lineages (Neumann et al. 2005, Banaszek et al. 2010, closely mimics the decrease in hamster occurrence
Banaszek et al. 2012) would be highly desirable. and range recorded over the past decades (see Figs. 1
The yearly reproduction rate of a female is given in & 2) and can thus be considered as the proximate
Table 1. Between 1914 and 1935, a female raised ~25 reason for the decline of this species. The ultimate
pups per year. Between 1965 and 1985, it was only reasons causing this decrease in reproduction must
21, due to a clear reduction in litter size, which was now be identified.
partly compensated by a slightly increased litter The data on the reproduction rate show that the
number. Between 1996 and 2015, both litter size and European hamster is very close to extinction. If the
litter number were so reduced that a female now reproduction rate, especially the litter size, for only a
raises only slightly more than half of the offspring in single year is lower than average, the species will
1 year (5.6) than it did in a single litter during the become extinct. This is certainly true on a regional
1914–1935 period (10.2). The calculated yearly off- level, but it might also affect the whole distribution
spring number of 5.6 is supported by several field area. Studies on hamster pests revealed (1) that in
studies following focal females: Franceschini-Zink & outbreak years the reproduction rate and/or the
Millesi (2008b) found 6.3 pups, Hufnagl et al. (2011) duration of the reproductive phase was increased
reported 6.9 and 3.7 pups, and Albert (2013) found (Sládek & Mošanský 1985, Grulich 1986) and that (2)
5.4 pups per year and female. Recapture studies such years occurred simultaneously over huge parts
showed that no more than 20% of the pups survive (300−4000 km) of the distribution area (Nechay 2008).
until the following spring (Karaseva 1962, Górecki Thus, the opposite scenario, viz. a high synchrony of
1977a, Kayser & Stubbe 2002, Franceschini-Zink & bad years with low reproduction, might be possible,
Millesi 2008a). Given that the sex ratio is balanced and as a result, could cause a widespread breakdown
(Vohralík 1974, Grulich 1986, Monecke & Wollnik of hamster populations.
2008), half of the pups are females, of which roughly
15% fail to reproduce (Weber & Stubbe 1984,
Franceschini & Millesi 2004, Franceschini-Zink & IUCN STATUS OF THE EUROPEAN HAMSTER
Millesi 2008b, Albert 2013). Consequently, a female NEEDS TO BE CHANGED
effectively raises only 0.5 females for next year’s
reproduction (Table 1). Surprisingly, the IUCN Red List status of the Euro-
European hamsters can only survive as a species if pean hamster is Least Concern (LC) (Kryštufek et al.
each female effectively produces at least 1 female for 2008). This categorization is mainly based on the
next year’s reproduction. This is no longer the case. very wide European-Asiatic range and on the as-
Moreover, since in recent years the life span of Euro- sumption that the species is abundant in the eastern
pean hamsters has barely exceeded the yearling part of the range, especially in Russia and Ukraine
state (Kayser & Stubbe 2002, Franceschini-Zink & (Kryštufek et al. 2008). However, this assumption
Millesi 2008a), most animals have only 1 reproduc- was in no way based on any literature or research,
tive phase in their lifetime. The strong negative trend but on personal communications and simple assump-
in litter size since 1954 (Fig. 7) accompanied by a tions. For example, one of the authors (I. Zagorod-
nyuk pers. comm. in Kryštufek
et al. 2008) stated personally
Table 1. Mean annual reproduction rates of female European hamsters Cricetus cricetus that the species is abundant in
and the resulting number of reproducing females in the next year
Ukraine. However, this is quite
surprising, as Gorban et al.
1914−1935 1965−1985 1996−2015 (1998) published several years
Mean no. of litters per year and female 2.43 2.56 1.63 earlier that the hamster had
Mean no. of pups per litter 10.17 8.24 3.43 become rare or disappeared
Mean no. of offspring per female and year 24.69 21.11 5.58 from some parts of the country.
No. of pups that survive until the next 4.94 4.22 1.12 These data were later con-
spring (20%a)
a firmed by Rusin et al. (2013).
No. of survivors that are female (50% ) 2.47 2.11 0.56
No. of surviving females that reproduce (85%a) 2.10 1.79 0.47 Similarly, opinions on the spe-
a
cies’ status in Russia are simply
Percentages according to literature given under ‘Reproduction rate has dramati-
cally decreased’ assumptions, demonstrated in
statements like:Surov et al.: Global decline of European hamsters 129
Less is known about the status of the species in eastern or Critically Endangered (Table S3). N one of these
Europe and Russia, but it is certainly more abundant data support the global IUCN status of Least Concern
there than in the west (Kryštufek et al. 2008, p. 4)
(LC). In many of the other countries or regions the
even though data showing a decrease in hamster status is Data Deficient or Not Evaluated or unknown.
populations in several Russian provinces were al- For the sake of the species’ protection it is imperative
ready available (see Table S3). Our review shows that these countries, as well as Kazakhstan and China,
with well established and new data that the assump- evaluate the range and densities of the European
tions for the present Red List categorization of the hamster in their area.
European hamster are not valid. The range and/or
relative abundance of the species is rapidly shrinking
all over the huge Eurasian range. The inhabited area POSSIBLE REASONS FOR THE DECLINE IN
is, or is quickly becoming, fragmented, and the num- REPRODUCTION
ber of populations is decreasing. Moreover, we have
also shown a dramatic decrease in reproduction, This review shows that the original assumptions for
which may cause the complete collapse of the species the decline in European hamster populations are not
within a few years. supported by the literature. Instead, it revealed that
Although further research is needed, the findings since about 1954, a dramatically declining reproduc-
on the decrease in range and relative abundance tion rate has increasingly impaired survival of the
suggest that the global status of European hamsters species throughout its distribution area. The repro-
should at least be Vulnerable (VU) according to crite- duction rate is already so low that it alone is sufficient
rion A2 of the IUCN Red List (minimum 30% of de- to cause extinction, even if anthropogenic mortality
cline within 10 yr; IUCN 2012), especially since the is reduced to 0. Research is urgently needed to iden-
IUCN criterion is matched that tify the causes.
In general, our data suggest that the reasons for the
the reduction or its causes may not have ceased or may
not be understood or may not be reversible (IUCN 2012, decline in the hamsters’ reproduction apply (1) all over
p. 21). Eurasia (2) since ca. 1954 (3) with increasing impor-
tance and (4) that they are most likely not directly
The reduction in population size is based on A1 a and related to modern agriculture. The significance of
c criteria (direct observation and decline in area of oc- these factors might differ between regions. Some
cupancy, extent of occurrence and/or quality of habi- possible hypotheses which fit these characteristics
tat). If the low reproduction rate, which suggests a are discussed in the following.
shrinking of the population by 50% each year in large
parts of the distribution area, is also incorporated,
then the status of Endangered (EN ) criterion A4 Reproductive cycle of European hamsters
might be considered:
To identify what might impair reproduction in wild
A projected or suspected population size reduction of
≥50% over any 10 year period, […] where the time European hamsters, a summary of the neuroendo-
period must include both the past and the future, AND crine processes controlling reproduction is helpful. In
where the reduction or its causes may not have ceased this species, the seasonal reproductive cycle is driven
OR may not be understood OR may not be reversible
by an endogenous timing mechanism, the circannual
(IUCN 2012, p. 19)
clock, which times the onset and end of hibernation
In Europe, the species is present in 18 countries, 9 and reproduction and initiates the necessary physio-
of which currently consider the European hamster to logical changes, even if the animals have no informa-
be Vulnerable (VU), Endangered (EN ), Critically tion about the season (for a review, see Monecke et
Endangered (CR) or Extinct (EX) at the national level al. 2014b). This circannual clock ticks only approxi-
(Table S1). Moreover, despite reports on a severe mately but not exactly in a 365 d stroke and thus
decrease in Poland and Ukraine (Ziomek & Banaszek needs to be reset once per year to maintain syn-
2007, Rusin et al. 2013), which also suggest the status chrony with the environmental cycle (Gwinner 1986).
of Endangered, the species there is still considered This is achieved by an interaction of the circannual
Data Deficient (DD) and Not Evaluated (NE), respec- clock and the circadian clock, which drives daily
tively. Furthermore, 14 Russian and Belorussian rhythms, for example the activity rhythm. The circa-
provinces or regions consider the European hamster dian clock is located in the hypothalamic suprachias-
as N ear Threatened (N T), Vulnerable, Endangered matic nuclei (SCN) (Dunlap et al. 2004), and one of its130 Endang Species Res 31: 119–145, 2016 tasks is to measure the length of day or photoperiod mid-April as the onset of the reproductive phase for the circannual clock, since this is the most reliable (Table S12). Such a delay severely reduces the possi- environmental signal for seasons (Gorman et al. ble number of yearly litters. Moreover, late-repro- 2001). In mammals, the SCN receives the information ducing females have smaller litters (Hufnagl et al. about light or darkness from special photoreceptors 2011) so that the total number of offspring they pro- in the retina, the ganglion cells, which perceive light duce in a year is lower than in early females, even if of wavelengths around 500 nm (Dunlap et al. 2004). both spend the same amount of time (from the first The synchronization process in European hamsters conception to the last weaning) on reproduction is based on a so-called sensitive phase to short pho- (Franceschini-Zink & Millesi 2008b). toperiods, from mid-May to mid-July, when the shortening of photoperiod after the summer solstice is perceived (Saboureau et al. 1999). N ormally, the Fur harvesting European hamster has an arrhythmic activity pattern that is highly unpredictable for predators, but during One possible reason for a delay in reproduction the sensitive phase it is very precise (and risky; Mon- might be fur trapping, although this practice ended ecke & Wollnik 2005). During this period, activity several decades ago. More critical than the number starts in the late afternoon several hours before sun- of hamsters which were trapped was probably the set, at exactly the same time each day. This precise timing of trapping, which occurred early in the year, activity onset is a stable reference to measure the tiny since fur quality is best directly after hibernation. advances of sunset (Monecke et al. 2006) after the Thus, each year, the part of the population which ter- summer solstice. When in mid-July the shortening of minated hibernation and started reproduction early the photoperiod is detected, the animals initiate go- was trapped, and this occurred over centuries. nadal regression (visible only 4 wk later; Saboureau These early-emerging animals represent the most et al. 1999), the activity pattern switches back to the valuable part of the population, since they have the default arrhythmic pattern (Monecke & Wollnik 2005), chance to raise 3 litters in a year instead of 2. More- and the circannual clock, which times the onset of over, they are the only animals which would repro- the next year’s reproductive phase by a complex neu- duce early enough in the year for their offspring to roendocrine pathway (Sáenz de Miera et al. 2014), is become reproductive in their year of birth at an age reset (Monecke et al. 2009). of a few weeks, while later-born animals reach puberty To survive in a seasonally varying environment, only after months, i.e. after hibernation (Kirn 2004, very precise timing is essential. The circannual clock Monecke et al. 2014a). The probability that these allows the animals to anticipate the upcoming sea- early-born animals survive until they are able to re- sonal changes in the environment, so that all neces- produce is thus much higher than that of late-born sary physiological changes (at least 73 are known; animals, of which only 20% reach the age of sexual Monecke et al. 2014b) from the hibernation state maturity (Table 1). Animals which reproduce in their (Waßmer & Wollnik 1997) to the reproductive state birth year have seldom been observed in recent are completed in early spring, allowing the animals years. to raise their offspring during the most favourable Early fur trapping may also have had an evolution- seasons. It also allows them to anticipate the harsh ary effect. It is very likely that analogous to circadian winter conditions by preparing a winter stock in late rhythms (Ralph & Menaker 1988, Monecke et al. summer when food abundance is high. 2011b), the timing of circannual rhythms has a heri- The above timing process might be disturbed at table component with early- and late-reproducing different points, potentially resulting in the impair- genotypes (Monecke 2013). In this case, fur trapping ment of the reproduction rate in European hamsters would have caused a strong selection pressure as observed since 1954. Indeed, several studies have against early-reproducing animals, which may have reported a delay in the onset of reproduction. In a led to a progressive decline of animals carrying the population in Austria, conception of the first litter early-reproducing genotype. Since late-reproducing occurred only in early to late May (Hufnagl et al. females raise fewer offspring (Franceschini-Zink & 2011), in the N etherlands from early May to early Millesi 2008b), a continuous decline in the mean lit- June (La Haye et al. 2014) and in Germany from early ter size since 1954 and finally a reduction in the mean May to mid-June (Kayser & Stubbe 2002, Weinhold & number of litters might be the consequence of having Kayser 2006). This is a delay of 0.5 to 2 mo compared removed early-reproducing individuals over decades to older literature, which in general indicates in the past. Thus, a reason for the decline in the re-
Surov et al.: Global decline of European hamsters                                131

production rate may well derive from the past. If this        cides, and might interfere, with the hamsters’ phase of
hypothesis is true, individual monitoring of the tim-         sensitivity to the short photoperiod and thus the reset-
ing of reproduction in the wild and in breeding pro-          ting of their circannual clock which determines the
grammes and protection of the early-reproducing               onset of reproduction in the following spring. A case
phenotype/genotype might be an effective protec-              study showed that European hamsters become com-
tion measure, particularly since these animals may            pletely nocturnal after harvest due to a lack of cover
become crucial in the adaptation of the species to cli-       (Wendt 1989). If they leave the burrow only at night in
mate change.                                                  the summer, they would not see the advances in sun-
                                                              set, which are the resetting signal for the circannual
                                                              clock (Monecke et al. 2006). Instead, they experience
                   Climate change                             constant darkness — in the burrow during the day,
                                                              and outside at night — which could be interpreted as
   Following this argument, climate change induces            an (extremely) short photoperiod during the sensitive
high selection pressure against late-reproducing              phase. Such a false short day signal would be per-
European hamsters. Since harvest timing has ad-               ceived too early compared to the endogenous season
vanced due to increasing temperatures, the second             of the animal, resulting in a slightly premature go-
litter is born around harvest (Albert 2013), so that the      nadal regression (Saboureau et al. 1999), which is
pups are challenged with a food shortage early in             supported by field data (Kayser & Stubbe 2002, Wein-
life when energy requirements are high. Survival              hold & Kayser 2006). Such a false short day signal per-
chances of these late-born animals are considered             ceived too early in the season also causes a profound
low (Deutsche Wildtierstiftung 2014).                         delay of the circannual clock and thus of the onset of
   In general, offspring should be born when food             the next reproductive phase (Monecke et al. 2009),
abundance is highest. However, the increasing tem-            which is also confirmed by field data (Kayser &
peratures due to climate change induce an advance             Stubbe 2002, Hufnagl et al. 2011, La Haye et al. 2014).
in the peak seasons of food resources, i.e. plants and        Climate change could therefore account for the delay
insects, resulting in a temporal mismatch with the            in reproduction and thus the reduction in litter num-
breeding phenology in vertebrates such as mammals             bers after 1986, since temperature has increased since
and birds (Both et al. 2006). This occurs because the         the 1980s (Hartmann et al. 2013).
former use temperature and the latter use the unal-
tered seasonal changes in photoperiod as seasonal
timetellers (Dunlap et al. 2004). Bird species which                               Light pollution
fail to advance their breeding phenology in adapta-
tion to the advanced food abundance peak are in                  Artificial light is a global factor which is increas-
decline (Both et al. 2006, Møller et al. 2008, Husby et       ingly becoming a threat for animals. The decline in
al. 2010, Saino et al. 2011). Some mammals have suc-          range (Fig. 1) and relative abundance (Fig. 3) of the
ceeded in advancing their phenology (Réale et al.             European hamster shows a remarkable coincidence
2003, Moyes et al. 2011). For example, an advanced            with highly light-polluted areas (Fig. 9). Both decline
spring emergence in recent years due to climate               in range and relative abundance are predominantly
change has led to a strong increase in the number of          observed in Europe and western Russia, and farther
the hibernating yellow-bellied marmots Marmota                east in a stretch at the southern border of Russia.
flaviventris (Ozgul et al. 2010). In contrast, 2 other        European hamsters are not only subjected to light
hibernators, Columbian ground squirrels Urocitellus           pollution from nearby villages and street lights but
columbianus (Lane et al. 2012) and European ham-              also to the bright headlights of cars, which shine at
sters (Kayser & Stubbe 2002), have delayed their              eye level of these animals. Moreover, there is not
reproduction phenology and are experiencing rapid             only a spatial but also a temporal coincidence of
population declines.                                          increased light pollution and declining hamster pop-
   Although climate change induces selection pressure         ulations, since the use of artificial light and its inten-
against late-reproducing animals, it might ironically         sity increased rapidly after the Second World War.
cause the disadvantageous delay in reproduction of            Finally, light pollution matches the criteria for identi-
European hamsters. Climate change has advanced                fying potential causes for the decrease in the repro-
cereal harvests; for example, in many French, Belgian         duction rate: It has affected huge parts of Eurasia
and German regions, the harvest has advanced to               since the 1950s with increasing importance, and it is
June or early July. At least in these regions, it coin-       not related to agriculture.
132 Endang Species Res 31: 119–145, 2016
In other species, light pollution ini-
tially seems advantageous, but after
longer exposure it leads to profound
impairment of seasonal physiology.
Birds interpret light pollution as an
increase in day length (Dominoni &
Partecke 2015); consequently, it ad-
vances the reproductive phase includ-
ing the lay date (Kempenaers et al.
2010, Dominoni et al. 2013a, Dominoni
& Partecke 2015) and increases the
extra-pair siring success (Kempenaers
et al. 2010). However, after long-term
exposure over 2 yr, the reproductive
Fig. 9. Light-pollution across Eurasia. (Earthlights dmsp 1994−1995; data cour-
system of the birds fails to develop
tesy of Marc Imhoff [NASA GSFC] and Christopher Elvidge [NOAA NGDC].
Image by Craig Mayhew and Robert Simmon [NASA GSFC]: http://eoimages. (Dominoni et al. 2013b). Likewise,
gsfc.nasa.gov/ve//1438/land_lights_16384.tif. Licensed under Public Domain Siberian hamsters Phodopus sungorus
via Wikimedia Commons: https://commons.wikimedia.org/wiki/File:Earthlights initially adapted their physiology faster
_dmsp.jpg#/media/File:Earthlights_dmsp.jpg; image has been modified to show
to a shortening of the photoperiod
only Eurasia)
under dim-light nights versus dark
nights (Gorman & Elliott 2004); how-
Today, the brightness of the night sky around ever, they failed to switch completely to the winter
most urban settlements is greater than in a full phenotype (Ikeno et al. 2014). In Siberian hamster
moon night or than at nautical twilight (Cinzano et pups, a brief nightly illumination of only 15 min on
al. 2001). Thus, such areas never experience true postnatal Day 18 induced gonadal growth (Spears et
nightfall. Light pollution is known to severely affect al. 1990) even though the animals were maintained
physiology and behaviour through endocrine and under a short photoperiod and should have been in a
neurobiological processes (N avara & N elson 2007). winter state.
Across taxa, light pollution can induce cancer or In European hamsters, artificial light during 2
impair immunity, it can alter circadian rhythms, be- nights in winter shifted the circannual reproductive
haviour, energy metabolism, reproductive state and cycle by 3 to 4 wk (Monecke et al. 2010). Outdoors,
foraging/eating behaviour, and it can influence pre- they showed a slightly modified activity pattern in an
dation and migration (for a review, see N avara & urban versus a rural area in July and August (Kaim et
Nelson 2007, Gaston et al. 2013). Moreover, the spec- al. 2013). Since the activity pattern changes pro-
tral composition of street light types has changed foundly at this time of the year, it might indicate a dif-
from predominantly orange sodium-based lighting ference in the seasonal timing of reproduction and
in the 1960s over metal halide lamps to high-bright- thus its success. Light pollution may therefore pres-
ness, light-emitting diodes (LEDs) with a broader ent a hitherto underestimated threat for European
spectrum of wavelengths (Gaston et al. 2013). In con- hamsters and other species.
trast to the sodium-based lighting, the light emitted
by metal halide lamps and LEDs includes wave-
lengths around 500 nm, which are perceived by the Fragmentation of the landscape
retinal ganglion cells, which in turn project to the
circadian clock in the suprachiasmatic nuclei (Dun- Highly light-polluted areas are usually highly
lap et al. 2004). These wavelengths are thus also fragmented by streets, highways and railway tracks.
relevant for the correct resetting of the circannual The coincidence between the maps showing the
clock. In European hamsters, they might increas- decline of European hamsters (Figs. 1 & 3) and the
ingly impair the perception of the natural shortening light-pollution map (Fig. 9) might thus be a result of
of the photoperiod after the summer solstice and the coincidence of population decline and habitat
consequently the timing of the reproductive cycle. fragmentation, which has been discussed to be a
Moreover, this environmental signal might be fur- reason for the decline of many species (Hanski 1998),
ther blurred by the continuously increasing nightly including European hamsters (Weinhold 2008).
light intensities. Besides a risk for increased mortality due to trafficYou can also read