Durham-Chapel Hill, North Carolina - COMPREHENSIVE HOUSING MARKET ANALYSIS U.S. Department of Housing and Urban Development, Office of Policy ...
←
→
Page content transcription
If your browser does not render page correctly, please read the page content below

COMPREHENSIVE HOUSING MARKET ANALYSIS

    Durham-Chapel Hill,
        North Carolina
U.S. Department of Housing and Urban Development,
Office of Policy Development and Research
As of June 1, 2019

Share on: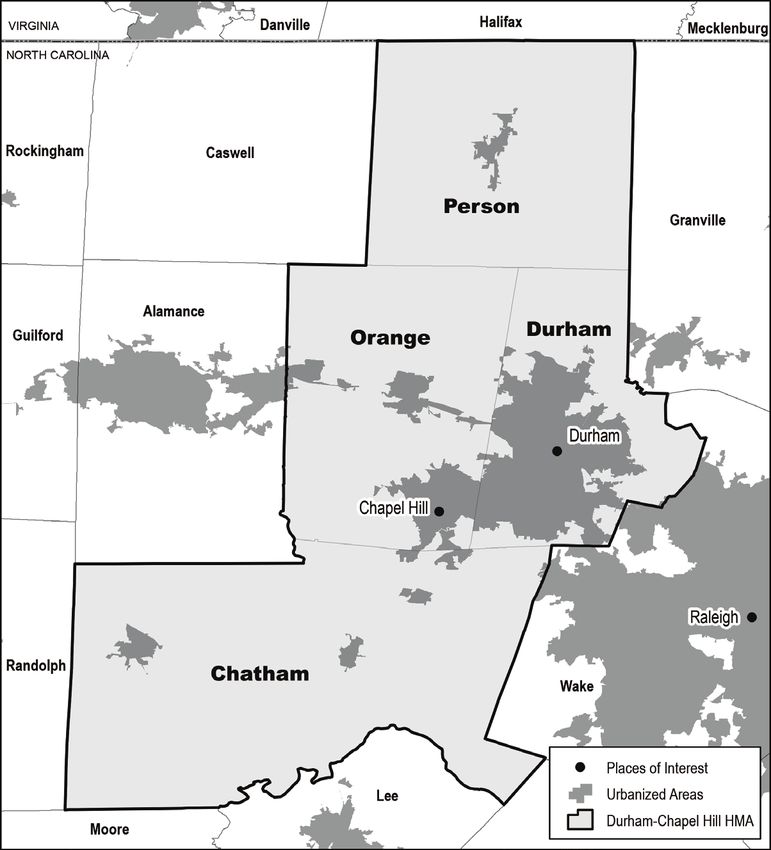
Durham-Chapel Hill, North Carolina Comprehensive Housing Market Analysis as of June 1, 2019                                                                              Executive Summary 2

Executive Summary
Housing Market Area Description
The Durham-Chapel Hill Housing Market Area (HMA) includes
Chatham, Durham, Orange, and Person Counties in central North
Carolina and is coterminous with the Durham-Chapel Hill, NC
Metropolitan Statistical Area (MSA). The HMA and the nearby city of
Raleigh are often referred to as the “Research Triangle” because of
the presence of large research universities in Durham, Chapel Hill,
and Raleigh. Duke University and the University of North Carolina
at Chapel Hill (UNC-Chapel Hill) are both located in the HMA.

                                                                                                  Tools and Resources

                                                                                                   Find interim updates for this metropolitan area, and select geographies nationally,
                                                                                                   at PD&R’s Market-at-a-Glance tool.
                                                                                                   Additional data for the HMA can be found in this report’s supplemental tables.
                                                                                                   For information on HUD-supported activity in this area, see the Community Assessment Reporting Tool.

                                                                                              Comprehensive Housing Market Analysis Durham-Chapel Hill, North Carolina
                                                                                              U.S. Department of Housing and Urban Development, Office of Policy Development and Research
Durham-Chapel Hill, North Carolina Comprehensive Housing Market Analysis as of June 1, 2019 Executive Summary 3
Market Qualifiers
Economy Sales Market Rental Market
Strong. Nonfarm payrolls increased Slightly Tight. A 2.6-month supply Balanced. Rent growth has averaged
1.3 percent during the 12 months of available inventory was for sale 5 percent annually from 2015
ending May 2019. during May 2019, unchanged from through 2018.
May 2018.
The economy has expanded strongly since 2011, Existing home sales totaled 9,875 during the 12 Rental housing market conditions in the HMA are
with nonfarm payrolls increasing an average of months ending May 2019, down 3 percent from the currently balanced, with an overall estimated
2.1 percent, annually, from 2012 through 2017. previous 12-month period, while the average sales vacancy rate of 6.5 percent, down from 9.5
By comparison, national payroll growth averaged price increased 7 percent to $274,500. During the percent in April 2010. The apartment market is also
1.8 percent during the same period. During the same time, new home sales decreased 12 percent balanced, with an average vacancy rate of 5.0
12 months ending May 2019, nonfarm payrolls to 2,275, and the average price was down 4 percent percent during the second quarter of 2019, while
increased by 3,900 jobs, or 1.3 percent, to to $348,500. During the next 3 years, demand is average rent increased 6 percent on an annual
315,600 jobs while the unemployment rate expected for 8,900 new homes. The 930 homes basis, following an increase of 5 percent annually
decreased from 3.7 to 3.5 percent. Job growth under construction are expected to meet a portion from 2015 through 2018. During the forecast period,
is expected to continue at an average annual rate of demand. demand is estimated for 5,125 new apartment units.
of 1.4 percent during the 3-year forecast period. The 2,400 units under construction will satisfy a
portion of this demand.
TABLE OF CONTENTS
Economic Conditions 4 3-Year Housing Demand Forecast
Population and Households 8 Sales Units Rental Units
Total Demand 8,900 5,125
Home Sales Market Conditions 10 Durham-Chapel Hill HMA
Under Construction 930 2,400
Rental Market Conditions 14
Notes: Total demand represents the estimated production necessary to achieve a balanced market at the end of the forecast period. Units under
Terminology Definitions and Notes 17 construction as of June 1, 2019. The forecast period is June 1, 2019, to June 1, 2022.
Source: Estimates by the analyst
Comprehensive Housing Market Analysis Durham-Chapel Hill, North Carolina
U.S. Department of Housing and Urban Development, Office of Policy Development and ResearchDurham-Chapel Hill, North Carolina Comprehensive Housing Market Analysis as of June 1, 2019 Economic Conditions 4
Economic Conditions and averaged 3.5 percent during the 12 months ending May 2019, down from 3.7
percent during the previous 12 months. By comparison, the national rate averaged
Largest sector: Education and Health Services 3.8 percent during the most recent 12 months, down from 4.1 percent during the 12
months ending May 2018 and from a peak of 9.7 percent in 2009.
The education and health services sector has accounted for almost
60 percent of all job growth in the HMA since 2000. Table 1. 12-Month Average Nonfarm Payroll Jobs (1,000s)
in the Durham-Chapel Hill HMA, by Sector
Primary Local Economic Factors 12 Months 12 Months Absolute Percentage
Ending Ending
The foundation of the Durham-Chapel Hill HMA economy is a highly educated May 2018 May 2019 Change Change
workforce. The percentage of adults in the HMA with a bachelor’s degree or higher Total Nonfarm Payroll Jobs 311.7 315.6 3.9 1.3
is 46.9 percent, well above the 32.0-percent rate for the nation, and the sixth Goods-Producing Sectors 36.2 36.6 0.4 1.1
highest percentage when ranking the 100 largest MSAs in the nation (2017 American Mining, Logging, & Construction 8.3 8.8 0.5 6.0
Manufacturing 27.8 27.8 0.0 0.0
Community Survey, 1-year data). Duke University and UNC-Chapel Hill are in the cities
Service-Providing Sectors 275.5 279.0 3.5 1.3
of Durham and Chapel Hill, respectively, and are both premier research universities. Wholesale & Retail Trade 32.7 32.5 -0.2 -0.6
U.S. News and World Report ranked Duke University, with an enrollment of 15,900 Transportation & Utilities 4.5 4.8 0.3 6.7
students, the 8th-best national university in the country; and UNC-Chapel Hill, with Information 4.3 4.3 0.0 0.0
an enrollment of 29,900, ranked 30th. Financial Activities 15.1 15.1 0.0 0.0
Professional & Business Services 43.5 45.9 2.4 5.5
The population and economy of the HMA is closely tied to the adjacent Raleigh Education & Health Services 69.1 70.3 1.2 1.7
MSA; approximately 65,150 residents of the Raleigh MSA commute to jobs in the Leisure & Hospitality 28.1 28.1 0.0 0.0
HMA, while 33,300 residents of the HMA commute to the Raleigh MSA (2011–2015 Other Services 11.2 10.9 -0.3 -2.7
Government 67.1 67.1 0.0 0.0
American Community Survey, 5-year data, most recent data available).
Notes: Based on 12-month averages through May 2018 and May 2019. Numbers may not add to totals due to
rounding. Data are in thousands.
Current Conditions—Nonfarm Payrolls Source: U.S. Bureau of Labor Statistics
Economic conditions in the HMA have improved each year since 2011 and are Figure 1. 12-Month Average Unemployment Rate
currently strong. During the 12 months ending May 2019, nonfarm payrolls increased in the Durham-Chapel Hill HMA and the Nation
by 3,900 jobs, or 1.3 percent, to 315,600 jobs, down from a gain of 5,400 jobs, or
Durham-Chapel Hill HMA Nation
1.8 percent, during the 12 months ending May 2018 (Table 1). Almost all job growth
during the 12 months ending May 2019 occurred in the professional and business 10.0
9.0
Unemployment Rate
services and education and health services sectors, which expanded by 2,400 8.0
and 1,200 jobs, or 5.5 and 1.7 percent, respectively. 7.0 8.1
6.0
(%)
Current Conditions—Unemployment 5.0
4.0
The unemployment rate in the HMA has been lower than that of the nation since 3.0
2000 and has declined significantly since the early 2010s (Figure 1). Due in large part 2.0
to job losses during the past recession, the unemployment rate in the HMA averaged
Ma 00
Ma 06
Ma 5
Ma 8
Ma 09
Ma 04
Ma 02
Ma 03
Ma -07
Ma -01
Ma 10
9
Ma 15
Ma 16
Ma 8
Ma 12
Ma 14
Ma 13
Ma -17
Ma -11
y-0
y-0
y-1
y-1
y-
y-
y-
y-
y-
y-
y-
y-
y-
y-
y-
y-
y
y
y
y
8.1 percent in 2010, more than double the previous low of 3.9 percent in 2006
Ma
and 2007. The unemployment rate in the HMA has declined each year since 2010 Source: U.S. Bureau of Labor Statistics
Comprehensive Housing Market Analysis Durham-Chapel Hill, North Carolina
U.S. Department of Housing and Urban Development, Office of Policy Development and ResearchDurham-Chapel Hill, North Carolina Comprehensive Housing Market Analysis as of June 1, 2019 Economic Conditions 5
Economic Periods of Significance
2000 Through 2010 2011 Through 2017
The Durham-Chapel Hill HMA began the 21st century with job losses; nonfarm The HMA added 2,500 jobs in 2011, or 0.9 percent, before job growth accelerated
payrolls declined an average of 2,900, or 1.1 percent, annually during 2002 and to an average annual increase of 5,900 jobs, or 2.1 percent, from 2012 through 2017.
2003 because of long-term declines in the local manufacturing sector and layoffs By comparison, national payroll growth averaged 1.8 percent from 2012 through
in the information sector related to the collapse of the dot-com bubble. From 2017. Payroll growth in the HMA during this period was broad-based, with all payroll
2004 through 2008, the HMA economy expanded, adding an average of 5,800 sectors except the manufacturing sector growing at least 1 percent annually. The
payrolls, or 2.2 percent, annually. During this period, the education and health education and healthcare services, professional and business services, and leisure
services, government, and financial activities sectors led job growth, adding an and hospitality sectors led job growth from 2012 through 2017, adding an average of
average of 1,800, 1,200, and 800 jobs, or 4.0, 2.0, and 7.8 percent, respectively. 2,000, 1,200, and 900 jobs annually, or 3.2, 3.0, and 3.5 percent, respectively. Duke
Economic growth during the period supported high levels of in-migration, which University Health System, a part of the larger Duke University and Duke University
catalyzed further economic growth through increased residential construction and Health System, led job growth in the education and health services sector, adding
demand for local goods and services. Subsequently, nonfarm payrolls declined approximately 3,000 employees between 2013 and 2018.
by an average of 5,800 jobs, or 2.1 percent, a year during 2009 and 2010 as a
result of the national recession and housing crisis (Figure 2). During this period, Universities, Healthcare, and Corporate Collaboration
manufacturing jobs declined an average of 3,800, or 10.4 percent and reduced The two largest employers in the HMA are Duke University and Duke University
residential and commercial construction caused payrolls in the mining, logging, Health System and UNC-Chapel Hill (Table 2). Duke University and Duke University
and construction sector to decline an average of 1,400 jobs, or 14.9 percent, Health System employs 38,525 people and had an estimated statewide economic
annually. The 2009 bankruptcy of Nortel, a telecommunications manufacturer,
led to an estimated 2,000 lost jobs during 2009 and 2010. Table 2. Major Employers in the Durham-Chapel Hill HMA
Figure 2. 12-Month Average Nonfarm Payrolls in the Durham-Chapel Hill HMA Name of Employer Nonfarm Number of
Payroll Sector Employees
National Recession Nonfarm Payrolls
Duke University and Duke University Health System Education & Health Services 38,525
Nonfarm Payrolls (in Thousands)
325
University of North Carolina at Chapel Hill Government 12,741
300 International Business Machines Corporation Information 8,000
Cisco Systems, Inc. Information 5,000
275 Blue Cross and Blue Shield of North Carolina Financial Activities 4,700
IQVIA Professional & Business Services 4,570
250
Fidelity Investments Financial Activities 3,600
225 Durham Veterans Affairs Health Care System Government 3,000
Credit Suisse Financial Activities 2,700
Ma 0
Ma 6
Ma 5
Ma 8
Ma 9
Ma 4
Ma 2
Ma 3
Ma 07
Ma 01
Ma 0
Ma 4
Ma 5
Ma 6
Ma 8
9
Ma 2
Ma 3
Ma 7
Ma 1
y-0
y-0
y-0
y-0
y-0
y-0
y-0
y-0
y-1
y-1
y-1
y-1
y-1
y-1
y-1
y-1
y-1
y-1
y-
y-
Cree, Inc. Manufacturing 2,500
Ma
Note: 12-month moving average. Note: Excludes local school districts and retailers.
Sources: U.S. Bureau of Labor Statistics; National Bureau of Economic Research Sources: Triangle Business Journal; estimates by the analyst
Comprehensive Housing Market Analysis Durham-Chapel Hill, North Carolina
U.S. Department of Housing and Urban Development, Office of Policy Development and ResearchDurham-Chapel Hill, North Carolina Comprehensive Housing Market Analysis as of June 1, 2019 Economic Conditions 6
impact of $5.8 billion during 2015, and UNC-Chapel Hill employs 12,741 people and financial services company, is building a $71 million campus expansion at RTP
had a statewide economic impact of $5.1 billion during 2015 (Economic Modeling that is expected to open in the summer of 2019 and will expand their local
Specialists Report). The nonfarm payroll sector that includes Duke University and employment by 1,200.
Duke University Health System, education and health services, is the largest in The three economic sectors most closely linked to RTP, education and health
the HMA (Figure 3). services, professional and business services, and financial activities are three
Figure 3. Current Nonfarm Payroll Jobs of the four fastest growing sectors in the HMA since 2001 (Figure 4). Since 2001,
in the Durham-Chapel Hill HMA, by Sector almost 90 percent of all nonfarm payrolls added in the HMA have been in one of
Local 6% Mining, Logging, & Construction 3%
these three sectors. Education and health services, which has added an average
Manufacturing 9%
of 1,900 jobs annually, or 3.8 percent, since 2001, accounted for 58 percent of job
State 13%
growth in the HMA.
Wholesale 3%
Retail 8% Figure 4. Sector Growth in the Durham-Chapel Hill HMA, 2001 to Current
Federal 2% Government
21% Total Nonfarm Payroll Jobs
Other Services 3% Trade 10%
Transportation & Utilities 2% Goods-Producing Sectors
Total Information 1% Mining, Logging, & Construction
315.6 Manufacturing
Leisure & Financial Activities 5% Service-Providing Sectors
Hospitality 9% Education
& Health
Wholesale & Retail Trade
Services Transportation & Utilities
22% Information
Financial Activities
Professional & Professional & Business Services
Business Services 15% Education & Health Services
Health 14% Leisure & Hospitality
Education 8%
Other Services
Government
Notes: Total nonfarm payroll is in thousands. Percentages may not add to 100 percent due to rounding. -40.0 -20.0 0.0 20.0 40.0 60.0 80.0 100.0
Source: U.S. Bureau of Labor Statistics Change in Jobs (%)
Most of the university’s economic impact did not result from direct spending Note: The current period is the 12-month average ending May 2019.
Source: U.S. Bureau of Labor Statistics
or hiring but in human capital development and knowledge production. The
economy of the HMA benefits from the partnership of educational, corporate, and In addition to the education and health services sector, a significant portion of the
government organizations exemplified in the Research Triangle Park (RTP), one of professional and business services sector is related to health care. The HMA and
the premier research and development corporate parks in the nation. RTP, which the neighboring Raleigh MSA have the largest concentration of contract research
is in an unincorporated area east of the city of Durham in parts of the HMA and the organizations (CROs) in the nation. CROs are companies that conduct and analyze
neighboring Raleigh MSA, is home to more than 200 organizations that employ a clinical trials for pharmaceutical manufacturers. IQVIA, the largest CRO in the world
combined 50,000 people. Four of the 10 largest employers in the HMA are tenants by trial volume, was founded at UNC-Chapel Hill and is still headquartered in the
at RTP: International Business Machines Corporation (IBM), Cisco Systems, Inc., city of Durham, while Syneos Health and Pharmaceutical Product Development, LLC,
Fidelity Investments, and Credit Suisse. Credit Suisse, an investment bank and employ 2,100 and 2,000 in the HMA, respectively.
Comprehensive Housing Market Analysis Durham-Chapel Hill, North Carolina
U.S. Department of Housing and Urban Development, Office of Policy Development and ResearchDurham-Chapel Hill, North Carolina Comprehensive Housing Market Analysis as of June 1, 2019 Economic Conditions 7
Employment Forecast
During the 3-year forecast period, nonfarm payroll growth is expected to remain utilities, is expected to add 300 employees at its Durham facility by 2022. The
strong at an average of 4,475 jobs, or 1.4 percent, annually. Numerous firms plan manufacturing sector, which has lost more jobs than any other sector in the HMA
to expand in the HMA during the next 3 years with notable growth expected since 2000, appears likely to add jobs during the forecast period. Corning Inc. is
in the education and health services, professional and business services, and opening a glass vial manufacturing facility in Durham that is expected to employ
manufacturing sectors. In the education and health services sector, LabCorp, a 317, while ABB, Inc., a Swiss industrial equipment manufacturer, is planning on
clinical testing provider, is expected to add 422 jobs as part of an expansion of expanding its manufacturing facility in the city of Mebane by 400 employees
its RTP facility, while AveXis, a developer of gene therapies, will employ 400 in during the forecast period. Finally, Merck & Co., Inc., a pharmaceutical company,
its new Durham facility. In the professional and business services sector, Parexel is building a new 225,000-square-foot facility in Durham to produce the Gardasil
International Corporation, a CRO, is expected to expand its Durham workforce HPV vaccine. When complete, Merck & Co., Inc.’s local employment is expected
by 264 during the forecast period, while Sensus, a provider of smart meters to to increase by 400.
Comprehensive Housing Market Analysis Durham-Chapel Hill, North Carolina
U.S. Department of Housing and Urban Development, Office of Policy Development and ResearchDurham-Chapel Hill, North Carolina Comprehensive Housing Market Analysis as of June 1, 2019 Population and Households 8
Population and Households
Current population: 582,700 As labor and housing markets have recovered throughout much of the nation,
population growth in the HMA increased after 2011. As of May 1, 2019, the
Population growth has been moderate and stable since 2012. population of the HMA is estimated at 582,700 people, reflecting an average
Population Trends increase of 8,550 people, or 1.6 percent, annually since 2011. During the period,
net in-migration accounted for 69 percent of population growth, or an average of
Population growth in the Durham-Chapel Hill HMA has been strong since 2000
5,900 people annually. Table 3 provides recent trends on population in the HMA.
because of better-than-average economic conditions, relatively lower priced housing
compared with metropolitan areas with similar high-skill economies, and the region’s
Table 3. Durham-Chapel Hill HMA Population and Household Quick Facts
mild climate. In addition, the neighboring Raleigh MSA was the fourth fastest growing
metropolitan area in the nation from 2000 to 2010; some of this population growth 2010 Current Forecast
spilled over into the HMA. Population growth in the HMA peaked from 2005 to
2008, when it averaged 10,550 people, or 2.2 percent, annually (U.S. Census Bureau Population Population 504,357 582,700 609,300
population estimates as of July 1) because of job gains and a strong housing market. Quick Facts Average Annual Change 7,775 8,550 8,875
Population growth slowed to an average of 9,325 people annually, or 1.9 percent Percentage Change 1.7 1.6 1.5
during 2009 and 2010, and a low of 6,375, or 1.3 percent, during 2011 because of a
decrease in net migration caused by job declines and the national housing crisis which 2010 Current Forecast
made it difficult for potential residents to sell their existing homes and relocate to the Household Households 202,476 235,400 247,100
HMA. Net in-migration averaged 7,075 people, or 67 percent of population growth, Quick Facts Average Annual Change 3,375 3,600 3,900
during the 2005-to-2008 period but only 4,950, or 59 percent, of population growth
from 2008 to 2011 (Figure 5). Percentage Change 1.8 1.7 1.6
Figure 5. Components of Population Change in the Durham-Chapel Hill HMA, Notes: Average annual changes and percentage changes are based on averages from 2000 to 2010, 2010 to
current, and current to forecast. The forecast period is from the current date (June 1, 2019), to June 1, 2022.
2000 Through the Forecast Sources: 2000 and 2010—2000 Census and 2010 Census; current and forecast—estimates by the analyst
12,000 Net Natural Change Net Migration Population Growth
10,000
Migration Trends
8,000
From 2011 to 2018, domestic in-migration constituted approximately 61 percent
6,000
of total net in-migration to the HMA. Migrants are drawn to the HMA because of
4,000
its strong job market, temperate climate, and relatively affordable housing. The
2,000
largest sources of net in-migration are from elsewhere in North Carolina and
0
northeastern metropolitan areas (2012–2016 American Community Survey, 5-year
06 6
09 9
03 3
04 4
05 5
08 8
07 7
01 1
02 2
20 010
st
-Fo nt
20 2016
13 3
20 014
20 015
Cu 18- 18
20 2017
20 011
20 012
20 00
20 200
20 200
20 200
20 00
20 200
20 00
20 200
20 00
20 201
ca
nt rre
20 7-20
data). International net in-migration originates mostly from Asia accounting for
-2
-2
-2
-2
-2
-2
-2
re
-2
-2
rre Cu
-
-
-
-
-
-
-
-
00
10
16
12
15
14
11
1
20
approximately 53 percent of all international migrants. The adjacent Raleigh MSA
Notes: Net natural change and net migration totals are average annual totals over the time period. The current is the largest source of migrants to the HMA and the most popular destination for
date is June 1, 2019. The forecast date is June 1, 2022.
Sources: U.S. Census Bureau; current to forecast—estimates by the analyst emigrants from the HMA (Table 4).
Comprehensive Housing Market Analysis Durham-Chapel Hill, North Carolina
U.S. Department of Housing and Urban Development, Office of Policy Development and ResearchDurham-Chapel Hill, North Carolina Comprehensive Housing Market Analysis as of June 1, 2019 Population and Households 9
Table 4. Metro-to-Metro Migration Flows By comparison, household growth averaged 3,375, or 1.8 percent, annually, from
in the Durham-Chapel Hill HMA, 2012–2016 2000 to 2010 (Table 3). Household growth has increased in absolute terms since
Raleigh, NC 7,467
2010, primarily because of higher population growth. The homeownership rate
Charlotte-Concord-Gastonia, NC-SC 2,678
Into the HMA New York-Newark-Jersey City, NY-NJ 2,244
is currently estimated at 58.5 percent, down from 60.1 percent in 2010 (Figure 6)
Greensboro-High Point, NC 1,760 because of a weak labor market and a tight credit market during the first years
Washington-Arlington-Alexandria, DC-VA 1,438 of the decade. Renter households accounted for approximately 37 percent of
Raleigh, NC 6,243 household growth from 2000 to 2010 but have accounted for approximately
Charlotte-Concord-Gastonia, NC-SC 1,774 52 percent of household growth since 2010 as apartment construction increased
Out of the HMA Greensboro-High Point, NC 1,628 in the latter period.
New York-Newark-Jersey City, NY-NJ 1,467
Washington-Arlington-Alexandria, DC-VA 1,415 Figure 6. Households by Tenure and Homeownership Rate
Sources: U.S. Census Metro-to-Metro Migration Flows; 2012–2016 American Community Survey, 5-year data in the Durham-Chapel Hill HMA
Population by Geography 250,000
Owner Renter Homeownership Rate
60.5
Approximately 55 percent of the HMA population resides in Durham County, 60.1
while 25 percent of the population live in Orange County, which includes the city 200,000 60.0
59.5
Homeownership Rate
of Chapel Hill. Chatham and Person Counties account for 13 and 7 percent of the 59.5
population of the HMA, respectively (Census Bureau Population Estimates).
Households
150,000
59.0
(%)
Chatham County has had the largest increase in population growth since 2010 100,000 58.5
growing 1.3 percent annually from 2011 to 2014, when the HMA grew by 1.7 58.5
percent annually, but grew 2.3 percent annually from 2015 to 2018, when the 50,000 58.0
HMA grew 1.5 percent annually. By comparison, Durham County and Orange
County grew by 2.2 and 1.3 percent annually in the former period, and 1.7 and 0 57.5
2000 2010 Current
1.1 percent annually in the latter period, respectively.
The sources of movers to the HMA vary widely between counties. Since 2010, Sources: 2000 and 2010—2000 Census and 2010 Census; current—estimates by the analyst
almost all net migration to Chatham and Person Counties is domestic in origin,
while domestic migration accounts for 54 percent of net migration to Durham. Forecast
International in-migration to the HMA is disproportionately concentrated in Orange During the next 3 years, the population of the Durham-Chapel Hill HMA is
County, which contains the city of Chapel Hill; since 2010, approximately two- expected to increase by an average of 8,875, or 1.5 percent a year, to 609,300,
thirds of net in-migration to this county has been international, primarily because similar to population growth in the 2012-to-current period as continued economic
of the presence of UNC-Chapel Hill. growth attracts migrants to the HMA. Net in-migration is expected to account for
approximately 75 percent of population growth. The number of households is
Household Trends expected to reach 247,100 by the end of the third year of the forecast period with
As of June 1, 2019, the number of households in the HMA was estimated at average growth during the next 3 years expected to be similar to the population
235,400, an increase of 3,600 households, or 1.7 percent, annually since 2010. growth rate at 1.6 percent, or 3,900 households, annually.
Comprehensive Housing Market Analysis Durham-Chapel Hill, North Carolina
U.S. Department of Housing and Urban Development, Office of Policy Development and ResearchDurham-Chapel Hill, North Carolina Comprehensive Housing Market Analysis as of June 1, 2019 Home Sales Market Conditions 10
Home Sales Market Conditions Strong economic conditions and population growth contributed to a peak of 9,750
existing homes sold, on average, each year from 2004 through 2007. Existing home
Market Conditions: Slightly Tight sales declined by an average of 1,150 home sales, or 15 percent, annually from 2008
Home sales have stabilized after several years of rapid increases. through 2011, to a low of 4,850 homes sold during 2011 because of poor economic
conditions and stricter lending standards. As the number of homes sold decreased,
Current Conditions both the number and percentage of distressed sales (real estate owned [REO] and
The sales housing market in the Durham-Chapel Hill HMA is currently slightly tight, short sales) increased substantially. Approximately 5 percent of all existing homes
with robust demand and a limited inventory of available for-sale homes contributing sold in 2007 were distressed, but by 2011 the percentage had increased to 18
to rising home prices. As of June 1, 2019, the overall sales vacancy rate was percent. The average home sales prices for REO and short sales were $129,800
estimated at 1.5 percent, down from 2.6 percent in 2010 (Table 5). During May 2019, and $192,200, respectively, in 2011, substantially less than the average price of
the HMA had a 2.6-month supply of unsold existing homes, unchanged from May $224,500 for regular resales.
2018, but well below the 9.5 months of supply during May 2010 (CoreLogic, Inc.). Despite the increased number of distressed sales, existing sales prices increased
The HMA has a lower supply of available homes than the nation, which had a
slightly throughout the housing crisis, increasing from an average of $209,200
3.4-month supply during May 2019, up from a 3.3-month supply during May 2018.
during 2007 and 2008 to $211,300 during the 2011-to-2012 period. This stability in
Table 5. Home Sales Quick Facts in the Durham-Chapel Hill HMA home prices was caused by the average price of regular resales increasing despite
Durham-Chapel Hill HMA Nation the housing crisis, from $214,400 in the former period to $223,800 in the latter
Vacancy Rate 1.5% NA period, which counteracted higher numbers of lower priced distressed sales.
Months of Inventory 2.6 3.4
Total Home Sales 12,150 6,034,000 The volume of home sales began to recover from the lows caused by the recession
Home Sales 1-Year Change -4.4% -4.6% in 2012 following the return of substantial job growth in 2011 (Figure 7). Existing
Quick Facts New Home Sales Price $348,500 $384,700 homes sales increased by an average of 1,325, or 24 percent, annually during 2012
1-Year Change -4% 1%
Existing Home Sales Price $274,500 $296,400 Figure 7. 12-Month Sales Totals by Type in the Durham-Chapel Hill HMA
1-Year Change 7% 3%
Mortgage Delinquency Rate 1.1% 1.4% New Home Sales Regular Resales Distressed Sales
NA = data not available. 14,000
Notes: Vacancy rate is as of the current date (June 1, 2019). Home sales and prices are for the 12 months
ending May 2019. Months of inventory and mortgage delinquency data are as of May 2019. 12,000
Source: CoreLogic, Inc., with adjustments by the analyst
10,000
Existing Home Trends 8,000
Low levels of available inventory have contributed to a decline in the number of 6,000
existing home sales and rising prices in the HMA. Existing home sales (including 4,000
regular resales and distressed sales) totaled 9,875 in the HMA during the 12 months
2,000
ending May 2019, down 3 percent from the previous 12-month period, while the
average sales price increased 7 percent to $274,500 (CoreLogic, Inc., with 0
adjustments by the analyst). Sales growth was negligible during the 12 months
Ma 5
Ma 6
Ma 8
Ma 9
Ma 2
Ma 3
Ma 4
Ma 7
Ma 0
Ma 01
Ma 5
Ma 6
Ma 8
9
Ma 2
Ma 3
Ma 4
Ma 7
Ma 11
y-0
y-0
y-0
y-0
y-0
y-0
y-0
y-0
y-1
y-1
y-1
y-1
y-1
y-1
y-1
y-1
y-1
y-
y-
Ma
ending May 2018, with existing home sales and prices increasing by 1 and
7 percent, respectively. Source: CoreLogic, Inc., with adjustments by the analyst
Comprehensive Housing Market Analysis Durham-Chapel Hill, North Carolina
U.S. Department of Housing and Urban Development, Office of Policy Development and ResearchDurham-Chapel Hill, North Carolina Comprehensive Housing Market Analysis as of June 1, 2019 Home Sales Market Conditions 11
and 2013, then slowed to an average annual increase of 640 homes, or 8 percent, From 2013 through 2017, new home sales increased at an average annual rate
from 2014 through 2017. The slowdown in growth was largely attributable to of 12 percent as the excess inventory of existing homes was absorbed and
decreases in the number of REO and short sales, which declined by respective new home sales rose to an average of 2,375 during 2016 and 2017. During
averages of 22 and 37 percent, annually, during the period, while regular resales this period, new home sales prices grew by an average of 7 percent annually,
increased by an average of 850, or 11 percent, annually. Despite the large compared with only 3 percent for existing home sales. Although new home
increase in the number of sales during 2012 and 2013, existing home prices sales in the HMA have increased since 2013, they are below the peak levels of
increased by an average of only 1 percent annually from 2012 through 2014. The the mid-2000s. The number of new home sales averaged 3,000 during 2005
significant inventory of for-sale homes, as well as the presence of large numbers and 2006 then declined an average of 14 percent annually from 2007 through
of distressed properties, kept prices from appreciating. From 2015 through 2017, 2011 because of poor economic conditions, decreased access to credit, and
as the sales market tightened and competition among homebuyers increased, increasing inventories of lower-priced existing homes. New home sales account
existing home prices increased an average of $8,975, or 4 percent, annually. for about 12 percent of home sales below $300,000 but approximately 38
percent of home sales between $300,000 and $600,000 (Figure 9).
New Home Trends
New home sales have slowed after several years of increasing sales volume. Figure 9. Share of Sales by Price Range During the 12 Months
Approximately 2,275 new homes sold in the HMA during the 12 months ending Ending May 2019 in the Durham-Chapel Hill HMA
May 2019, down 12 percent from the previous 12 months, while the average Existing Sales New Sales
price of a new home decreased 4 percent to $348,500 (CoreLogic, Inc., with 4,000
adjustments by the analyst; Figure 8). 3,500
3,000
Figure 8. 12-Month Average Sales Price by Type of Sale 2,500
in the Durham-Chapel Hill HMA 2,000
New Home Sales Regular Resales Distressed Sales 1,500
400,000 1,000
350,000 500
300,000 0
Average Sales Price
$0 to $200k to $300k to $400k to $600k to $800k and
250,000 $199k $299k $399k $599k $799k More
200,000
($)
Source: Metrostudy, A Hanley Wood Company
150,000
100,000 Delinquent Mortgages
50,000 Seriously delinquent mortgages and REO properties no longer significantly
0 affect existing home prices within the HMA. As of May 2019, 1.1 percent of home
loans were seriously delinquent or had transitioned into REO status, down from
M 6
M 05
M 8
M 9
M 04
M 2
M 03
M 07
M 01
M 0
M 5
M 6
M 8
-19
-12
-14
M 3
M 7
M 1
-0
-0
-0
-0
-1
-1
-1
-1
-1
-1
-1
-
-
-
-
-
ay
ay
ay
ay
ay
ay
ay
ay
ay
ay
ay
ay
ay
ay
ay
ay
ay
ay
ay
1.8 percent in May 2018 and below the national rate of 1.4 percent in May 2019
M
M
M
Source: CoreLogic, Inc., with adjustments by the analyst
Comprehensive Housing Market Analysis Durham-Chapel Hill, North Carolina
U.S. Department of Housing and Urban Development, Office of Policy Development and ResearchDurham-Chapel Hill, North Carolina Comprehensive Housing Market Analysis as of June 1, 2019 Home Sales Market Conditions 12
(CoreLogic, Inc.). In January 2012, the rate of seriously delinquent mortgages Sales Permit Activity
and REO properties in the HMA peaked at 5.0 percent, remaining well below
Homebuilding, as measured by the number of single-family homes, townhomes,
the national rate, which was 7.3 percent during the same period.
and condominium units permitted, has generally trended upward in the HMA since
the end of 2012 but is below the historically high levels reached during the housing
Housing Affordability boom in the mid-2000s (Figure 11). Homebuilding peaked from 2003 through 2005
During the past year, home prices in the Durham-Chapel Hill HMA have at an average of 4,100 homes permitted annually, then declined by an average of
increased slower than income, causing homeownership to become more 710 homes, or 25 percent, annually from 2006 through 2009, as demand for new
affordable for more families. The National Association of Home Builders’ (NAHB) homes fell. After reaching a low of 1,575 homes permitted on average from 2009
and Wells Fargo Housing Opportunity Index (HOI) for the HMA, which represents through 2012, for-sale home construction increased an average of 330 units, or
the share of homes sold that would have been affordable to a family earning the 15 percent, annually from 2013 through 2017 because of strengthening economic
local median income, was 70.1 during the first quarter of 2019, up from 67.4 a conditions and increased existing home sales. Construction levels stabilized,
year ago (Figure 10). During the first quarter of 2019, 129 of the 237 metropolitan averaging 3,325 homes built annually during 2017 and 2018. During the 12 months
areas measured had greater housing affordability than the Durham-Chapel ending May 2019, 3,275 homes were permitted, down less than 1 percent from the
Hill HMA. Despite increased affordability during the past year, the home price preceding 12-month period (preliminary data).
growth outpaced income growth in the HMA from 2013 through 2017. During
the first quarter of 2013, the HOI was 83.1 and only 107 metropolitan areas had Figure 11. Average Annual Sales Permitting Activity
in the Durham-Chapel Hill HMA
greater housing affordability than the HMA. Since this period, median home
prices have increased 55 percent while the median household income has only Single-Family Homes/Townhomes Condominiums
increased 21 percent. 4,500
4,000
Figure 10. Durham-Chapel Hill HMA Housing Opportunity Index 3,500
3,000
85 2,500
2,000
80 1,500
NAHB Opportunity Index
1,000
75 500
0
00 01 02 03 04 05 06 07 08 09 10 11 12 13 14 15 16 17 18 19
70 20 20 20 20 20 20 20 20 20 20 20 20 20 20 20 20 20 20 20 20
65 Notes: Includes single-family homes, townhomes, and condominiums. 2019 includes data through May 2019.
Sources: U.S. Census Bureau, Building Permits Survey; 2000 through 2017—final data and estimates by the
analyst; 2018 and 2019—preliminary data and estimates by the analyst
60
Approximately 60 percent of all new home construction in the HMA is occurring
9
10
15
16
8
19
12
13
14
17
11
0
1
20
20
20
20
20
20
20
20
20
20
20
in Durham County, with Chatham, Orange, and Person Counties accounting for
1Q
1Q
1Q
1Q
1Q
1Q
1Q
1Q
1Q
1Q
1Q
NAHB = National Association of Home Builders. 1Q = first quarter. about 20, 15, and 5 percent of construction, respectively. An example of a typical
Source: NAHB/Wells Fargo subdivision is the 175-home community of Meadows at Southpoint in south Durham,
Comprehensive Housing Market Analysis Durham-Chapel Hill, North Carolina
U.S. Department of Housing and Urban Development, Office of Policy Development and ResearchDurham-Chapel Hill, North Carolina Comprehensive Housing Market Analysis as of June 1, 2019 Home Sales Market Conditions 13
which opened in 2016 and is expected to be built out during the forecast period. construction are expected to meet a portion of demand during the first year
This townhome community offers three-bedroom homes starting at $277,000 and of the forecast.
four-bedroom homes starting at $332,000.
Table 6. Demand for New Sales Units in the Durham-Chapel Hill HMA
During the Forecast Period
Forecast Sales Units
Based on current and anticipated economic and population growth and the
Demand 8,900 Units
current slightly tight sales market conditions in the HMA, demand is estimated
Under Construction 930 Units
for 8,900 new homes during the next 3 years, with demand constant during
Note: The forecast period is from June 1, 2019, to June 1, 2022.
each year of the forecast period (Table 6). The 930 homes currently under Source: Estimates by the analyst
Comprehensive Housing Market Analysis Durham-Chapel Hill, North Carolina
U.S. Department of Housing and Urban Development, Office of Policy Development and ResearchDurham-Chapel Hill, North Carolina Comprehensive Housing Market Analysis as of June 1, 2019 Rental Market Conditions 14
Rental Market Conditions The apartment market, which makes up approximately 63 percent of renter-
occupied units in the HMA, is also balanced (2017 American Community Survey,
1-year data). The apartment vacancy rate averaged 5.0 percent during the
Market Conditions: Balanced
second quarter of 2019, down from 5.8 percent a year earlier (RealPage, Inc.).
Rental market conditions in the HMA are balanced despite high levels The apartment vacancy rate has trended downwards since 2016, when the
of apartment construction since the early 2010s. annualized vacancy rate reached a peak of 6.5 percent (Figure 12). During the
second quarter of 2019, the average rent in the HMA increased 6 percent from
Current Conditions and Recent Trends the second quarter of 2018 to $1,150, while average rents for one-, two-, and
Overall rental housing market conditions (which include single-family rentals, three-bedroom apartments were $1,025, $1,196, and $1,493, respectively. Rent
townhomes, and mobile homes, as well as apartments) in the Durham-Chapel growth was steady during 2013 and 2014, averaging 3 percent each year, and
Hill HMA are currently balanced, with an overall estimated rental vacancy rate increased to an average of 5 percent, annually, from 2015 through 2018.
of 6.5 percent, down from 9.5 percent in 2010 (Table 7). High levels of renter
household growth since 2010 have contributed to declining vacancy rates and Figure 12. Apartment Rents and Vacancy Rates
in the Durham-Chapel Hill HMA
rising rents, despite increased apartment construction during the period.
Average Monthly Rent Vacancy Rate
1,150 7.0
Table 7. Rental and Apartment Market Quick Facts
in the Durham-Chapel Hill HMA 1,100 6.5
Average Monthly Rent
2010 Current
(%) (%)
Vacancy Rate
1,050 6.0
Rental Vacancy Rate 9.5 6.5
(%)
($)
Rental Market Occupied Rental Units by Structure 1,000 5.5
Quick Facts Single-Family Attached & Detached 30 33
Multifamily (2–4 Units) 11 13 950 5.0
Multifamily (5+ Units) 53 49
Other (Including Mobile Homes) 5 4 900 4.5
5
6
8
9
17
1
1
1
1
20
20
20
20
20
Current YoY Change
2Q
2Q
2Q
2Q
2Q
Apartment Vacancy Rate 5.0% -0.8 2Q = second quarter.
Apartment Note: Four-quarter running average.
Average Rent $1,150 6% Source: RealPage, Inc.
Market Studio $1,080 6%
Quick Facts One-Bedroom
Market Conditions by Geography
$1,025 6%
Two-Bedroom $1,196 6%
Three-Bedroom $1,493 9% Apartment vacancy rates vary across the HMA, ranging from a low of 3.7 percent
YoY = year over year. in the RealPage, Inc.-defined Southwest Durham market area to a high of 6.4
Notes: The current date is June 1, 2019. Current data for “occupied rental units by structure” are 2017 American
Community Survey, 1-year data, the most recent data available. percent in the Northwest Durham/Downtown market area, which includes Duke
Sources: American Community Survey, 1-year data; apartment data—RealPage, Inc. University. The Northwest Durham/Downtown market area was the only market
Comprehensive Housing Market Analysis Durham-Chapel Hill, North Carolina
U.S. Department of Housing and Urban Development, Office of Policy Development and ResearchDurham-Chapel Hill, North Carolina Comprehensive Housing Market Analysis as of June 1, 2019 Rental Market Conditions 15
area where the vacancy rate did not decline during the most recent 12-month County. During the 12 months ending May 2019, approximately 1,700 rental units
period, remaining unchanged. The elevated vacancy rate in the Northwest were permitted, a decrease of approximately 21 percent compared with the
Durham/Downtown market area was caused by a large number of apartment previous 12-month period (preliminary data).
completions that occurred during the past year. According to RealPage, Inc., Figure 13. Average Annual Rental Permitting Activity
approximately 1,050 apartments opened in the Northwest Durham/Downtown in the Durham-Chapel Hill HMA
market area since the second quarter of 2018, accounting for almost two-thirds
of all apartment construction in the HMA during that time. During the same time 3,000
period, no apartments opened in the Southwest Durham market area. Rents are 2,500
highest in the Northwest Durham/Downtown market area at $1,201 and the Chapel
Hill/Carrboro market area, which includes UNC-Chapel Hill at $1,199, and the lowest 2,000
in the East Durham market area at $1,090. Apartment rents are converging across
1,500
submarkets, however, with rent growth in the East Durham market area leading
the HMA at 11-percent annual growth during the second quarter of 2019, while the 1,000
Northwest Durham/Downtown market area had the lowest with no change in rents.
500
Student Housing 0
University students living off campus are estimated to make up approximately 40
00
06
05
08
04
09
02
03
07
01
10
15
16
18
19
12
13
14
17
11
20
20
20
20
20
20
20
20
20
20
20
20
20
20
20
20
20
20
20
20
percent of renter households in Orange County, which contains UNC-Chapel Hill,
and 10 percent in Durham County, which contains Duke University. Private student- Notes: Includes apartments and units intended for rental occupancy. 2019 includes data through May 2019.
Sources: U.S. Census Bureau, Building Permits Survey; 2000 through 2017—final data and estimates by the
specific apartments do not make up a significant amount of the rental stock of analyst; 2018 and 2019—preliminary data and estimates by the analyst
Durham County but account for an estimated 10 percent of the apartments in
Orange County, meaning students are a substantial part of regular rental market Recently Constructed Rental Properties
demand in these counties. The impact of students on the rental market of the HMA Current apartment construction has been evenly split between Durham and
is not expected to change in the next 3 years, as neither Duke University or UNC- Orange Counties. The Alta Blu, a 298-unit market rate apartment complex in
Chapel Hill plan to significantly expand enrollment or their on-campus housing. Chapel Hill, is one of the newest apartment complexes in the HMA. The Alta
Blu opened in May 2019 and offers one-, two-, and three-bedrooms starting
Rental Construction Activity at $1,300, $1,630, and $1,830, respectively. The Solis Patterson Place, a 345-
Builders have responded to strong rent growth with high levels of rental unit market rate apartment complex in Durham, is expected to open during the
construction since the early 2010s. Following the Great Recession, apartment summer of 2019. When complete, studio, one-, two-, and three-bedroom units
construction, as measured by the number of rental units permitted, declined to will be available at $1,050, $1,200, $1,550, and $2,000, respectively.
very low levels during 2010 and 2011, averaging only 620 units permitted annually
because of a soft rental market (Figure 13). Rental construction quickly rebounded, Housing Affordability: Rental
however, with an average of 1,775 rental units permitted annually from 2012 Rental housing in the Durham-Chapel Hill HMA has become more expensive
through 2018. During this period, approximately 70 percent of rental construction since 2010, but the effect on rental affordability has been offset by high income
occurred in Durham County, with almost all of the remainder occurring in Orange growth. Between 2010 and 2017, the median gross rent increased by a total
Comprehensive Housing Market Analysis Durham-Chapel Hill, North Carolina
U.S. Department of Housing and Urban Development, Office of Policy Development and ResearchDurham-Chapel Hill, North Carolina Comprehensive Housing Market Analysis as of June 1, 2019 Rental Market Conditions 16
of 27 percent, while the median income of renter households increased by 37 families nationwide spend between 30 and 49 percent and more than 50
percent. As a result, the HUD Rental Affordability Index, a measure of median percent of their income on rent respectively.
renter household income relative to qualifying income for the median-priced The city of Durham, Duke University, SunTrust Bank and NC Community
rental unit, increased from 84.8 in 2010, to 92 in 2017, signifying a more Development Initiative will create a $10 million loan fund in the summer of 2019.
affordable rental market (Figure 14). It is important to note, however, that some This fund will support below market rate loans to preserve and create additional
of the increase in income was likely caused by lower-income households affordable housing units. Additionally, voters in the city of Durham will vote
choosing to move outside of the HMA in response to increased rents. on the creation of a $95 million affordable housing bond in November 2019.
Figure 14. Durham-Chapel Hill HMA Rental Affordability If passed, the bond would create 1,800 new, affordable units and preserve an
additional 800 affordable units.
Gross Rent Change Median Income Change Renter Affordability Index
Median Gross Rent and Income Growth (%)
15 100
Forecast
HUD Renter Affordability Index
10 95 During the 3-year forecast period, demand is estimated for 5,125 apartments in
the HMA (Table 9). Demand is expected to be evenly distributed among each
5 90
year of the forecast period. The 2,400 units currently under construction will
0 85 fulfill all expected demand during the first year of the forecast period.
80
-5
Table 9. Demand for New Rental Units in the Durham-Chapel Hill HMA
-10 75
During the Forecast Period
Rental Units
10
15
16
12
13
14
17
11
20
20
20
20
20
20
20
20
Source: American Community Survey, 1-year data Demand 5,125 Units
Under Construction 2,400 Units
Among households that have incomes below 50 percent of Area Median Family
Note: The forecast period is July 1, 2019, to July 1, 2022.
Income (AMFI) approximately 25.7 percent spend between 30 and 49 percent Source: Estimates by the analyst
of their income on rent, while 48.3 percent spend more than 50 percent of
their income on rent (Table 8). By comparison, 25.7 and 50.2 percent of similar
Table 8. Percentage of Cost Burdened Renter Households by Income
in the Durham-Chapel Hill HMA and the Nation, 2011–2015
Cost Burdened Severely
Cost Burdened
Durham-Chapel Hill Nation Durham-Chapel Hill Nation
HMA HMA
Renter Households with IncomeDurham-Chapel Hill, North Carolina Comprehensive Housing Market Analysis as of June 1, 2019 Terminology Definitions and Notes 17
Terminology Definitions and Notes
A. Definitions
The demand estimates in the analysis are not a forecast of building activity. They are the estimates of the total housing production needed to achieve a
Demand balanced market at the end of the 3-year forecast period given conditions on the as-of date of the analysis, growth, losses, and excess vacancies. The
estimates do not account for units currently under construction or units in the development pipeline.
In this analysis conducted by the U.S. Department of Housing and Urban Development (HUD), other vacant units include all vacant units that are not available
Other Vacant
for sale or for rent. The term therefore includes units rented or sold but not occupied; held for seasonal, recreational, or occasional use; used by migrant
Units
workers; and the category specified as “other” vacant by the U.S. Census Bureau.
Building permits do not necessarily reflect all residential building activity that occurs in an HMA. Some units are constructed or created without a building
permit or are issued a different type of building permit. For example, some units classified as commercial structures are not reflected in the residential building
Building Permits
permits. As a result, the analyst, through diligent fieldwork, makes an estimate of this additional construction activity. Some of these estimates are included in
the discussions of single-family and multifamily building permits.
Distressed Sales Short sales and real estate owned (REO) sales.
Seriously
Delinquent Mortgages 90+ days delinquent or in foreclosure.
Mortgages
Comprehensive Housing Market Analysis Durham-Chapel Hill, North Carolina
U.S. Department of Housing and Urban Development, Office of Policy Development and ResearchDurham-Chapel Hill, North Carolina Comprehensive Housing Market Analysis as of June 1, 2019 Terminology Definitions and Notes 18
Home Sales/
Home Sales Includes single-family home, townhome, and condominium sales.
Prices
Rental Market/
Rental Vacancy Includes apartments and other rental units such as single-family homes, multifamily homes, and mobile homes.
Rate
Forecast Period 6/1/2019–6/1/2022—Estimates by the analyst
Cost Burdened Spending more than 30 percent of household income on housing costs.
Regular Resales Existing home sales excluding distressed sales.
B. Notes on Geography
The (metropolitan statistical area) definition noted in this report is based on the delineations established by the Office of Management and Budget (OMB) in
1.
the OMB Bulletin dated February 28, 2013.
2. Urbanized areas are defined using the U.S. Census Bureau’s 2010 Census Urban and Rural Classification and the Urban Area Criteria.
3. The census tracts referenced in this report are from the 2010 Census.
Comprehensive Housing Market Analysis Durham-Chapel Hill, North Carolina
U.S. Department of Housing and Urban Development, Office of Policy Development and ResearchDurham-Chapel Hill, North Carolina Comprehensive Housing Market Analysis as of June 1, 2019 Terminology Definitions and Notes 19
C. Additional Notes
The NAHB Housing Opportunity Index represents the share of homes sold in the HMA that would have been affordable to a family earning the local median
1.
income, based on standard mortgage underwriting criteria.
This analysis has been prepared for the assistance and guidance of HUD in its operations. The factual information, findings, and conclusions may also be
2. useful to builders, mortgagees, and others concerned with local housing market conditions and trends. The analysis does not purport to make determinations
regarding the acceptability of any mortgage insurance proposals that may be under consideration by the Department.
The factual framework for this analysis follows the guidelines and methods developed by the Economic and Market Analysis Division within HUD. The analysis
and findings are as thorough and current as possible based on information available on the as-of date from local and national sources. As such, findings or
3.
conclusions may be modified by subsequent developments. HUD expresses its appreciation to those industry sources and state and local government officials
who provided data and information on local economic and housing market conditions.
Cover Photo iStock
Contact Information
Adam Tubridy, Economist
Seattle HUD Regional Office
206–220–5339
adam.b.tubridy@hud.gov
Comprehensive Housing Market Analysis Durham-Chapel Hill, North Carolina
U.S. Department of Housing and Urban Development, Office of Policy Development and ResearchYou can also read