EAERE Magazine Towards a Deep Climate Collaboration Module 1: United States of America - European ...
←
→
Page content transcription
If your browser does not render page correctly, please read the page content below
n.11
Winter
2021

             EAERE
            Magazine
              Towards a Deep
         Climate Collaboration
                          Module 1:
           United States of America
n.11
Winter
2021

EAERE Magazine serves as an outlet for new research, projects, and
other professional news, featuring articles that can contribute to recent
policy discussions and developments in the field of environmental
and natural resource economics. It is published quarterly in the
Winter, Spring, Summer, and Fall. Contributions from the wider EAERE
community, especially senior level researchers and practitioners, and
EAERE Country Representatives, are included in the magazine.
EAERE President: Christian Gollier
Editor: Frank J. Convery
Editorial Assistant: Katie Johnson
Contributing Authors: Sylvain Cail, Frank J. Convery, Patrick Criqui,
Nathaniel O. Keohane, Bethany A. Davis Noll, Jack Lienke, Maurizio
Malpede, Jasper Meya, Paul Neetzow, Lutz Sager, Max Sarinsky, Jason
A. Schwartz, Thomas Sterner
Graphic Project: Renato Dalla Venezia

For questions and comments please contact:
Frank J. Convery – frank.convery@envecon.eu
or Katie Johnson – katie.johnson@eaere.org
Table of contents

      4   Note from the Editor
          Frank J. Convery

 SECTION I FRAMING THE CHALLENGE

    10    Towards a Deep Climate Collaboration (China, European Union, India,
          U.S.) – DCC4
          Frank J. Convery, Thomas Sterner

    15    Carbon Dioxide Emissions by the Four Largest World Emitters: Past
          Performance and Future Scenarios for China, U.S.A., Europe and India
          Sylvain Cail, Patrick Criqui

SECTION II THE U.S. MODULE

    26    Climate Policy Architecture in the U.S.
          Jack Lienke, Jason A. Schwartz

    31    U.S. Domestic Climate Policy – Looking Back
          Max Sarinsky

    36    U.S. Domestic Climate Policy – Looking Forward
          Bethany A. Davis Noll

    40    American Climate Diplomacy: Past Performance and New Opportunities
          Nathaniel O. Keohane

SECTION III CELEBRATING EAERE DOCTORAL AWARDEES

    46    The Growing Role of Inequality in Environmental Policy
          Lutz Sager

    50    You Can’t Always Get What You Want: Research Beyond Carbon Pricing
          Paul Neetzow, Jasper Meya

    54    Exploring the Global Economic Consequences of Desertification
          Maurizio Malpede
EAERE Magazine / n.11 Winter 2021 - Towards a Deep Climate Collaboration

                                       Frank J. Convery (frank.convery@envecon.eu) completed forestry degrees at University
                                       College Dublin and PhD (forestry economics) at the State University of New York, followed
                                       by careers at Duke University, Heritage Trust Professor at University College Dublin,
                                       and Chief Economist, Environmental Defense Fund. His professional passions: bringing
                                       academic research down to where things are done; finding ways that work to protect
                                       our shared climate and environmental commons with a focus on mobilizing markets and
                                       (latterly) innovation to these ends; help make Ireland and Europe exemplars thereof.

     Dear EAERE friends and colleagues,                                       topic: “Towards a Deep Climate Collaboration
                                                                              (China, European Union, India, U.S.) – DCC4”.
     I have succeeded Astrid Dannenberg as editor.                            This will be in two parts. The first will set the stage
     I would like to thank her for steering the maga-                         by discussing the rationales for such an approach,
     zine from its inauguration through 10 issues to                          and the second will address the specifics of past
     such excellent effect. I take over the EAERE                             performance and scenarios for the future for all
     Magazine in rude good health, a bouquet that                             four. This volume of EAERE will conclude with
     arrives free every quarter which simultaneously                          essays from three recent EAERE prize winners.
     celebrates the many achievements of our pro-
     fession and provides new insights in short arti-                         My choice is informed by the following context:
     cles that enlighten and excite. I will do my best                        climate policy at global level is struggling to
     to maintain this tradition. It is also clear that in                     come anywhere close to achieving the reductions
     Katie Johnson we have an excellent Assistant                             in greenhouse gas emissions that are required if
     Editor, and a support team that is dedicated, tal-                       we are to manage climate risk responsibly; four
     ented and professional.                                                  jurisdictions – China, the EU, India and the U.S.
                                                                              – account for about 60% of total emissions, and
     Our magazine has three major advantages over                             about the same share of global GDP; there has
     most traditional peer reviewed journals, namely,                         been some thought leadership by our profession
     its frequency, the fact that we can address con-                         on the proposition that a relatively small group
     temporary issues in close to ‘real time’, and we                         of countries or jurisdictions could help break
     can expand or contract each issue as needs and                           the cycle of failure1; the European Union can be
     supply allow.                                                            regarded as such a club2.

     To increase the benefits which these characteris-                        The Particularities of the European Union3
     tics enable, in addition to continuing to celebrate
     the achievements of our colleagues and encour-                           Four characteristics of the European model
     aging submission of papers, I have decided                               stand out. It comprises 27 sovereign states who
     to pick a big issue, and use our magazine as a                           have agreed to cede some of their individual au-
     place to help develop a shared understanding                             tonomy to help deliver a range of bigger and
     of its topography over a number of issues that                           better collective outcomes, and this includes
     would help inform the development of policy.                             more effectively addressing the climate change
                                                                              challenge. To this end, it mobilises a number of
     Specifically, I have decided to use a section of each                    policy instruments in parallel: at EU level these
     of our four issues in 2021 to address a single big                       include information (e.g. energy rating of build-

     1 In his Nobel Lecture delivered in Stockholm on December 8, 2018, William Nordhaus proposed a ‘climate club’ as a solution to the free
     riding problem.
     2 The member states (sadly now 27 instead of 28, with the departure of the UK) agree on the overall ambition as regards reductions to be
     achieved; this obligation is then divided between reductions in the cap of the EU-wide emissions trading scheme (EU ETS, covering power
     and heavy industry) which covers about 45% of total emissions, and reductions from the non-traded sectors, which are allocated in the form
     of individual national caps to member states each have considerable freedom as to how they chose to meet them. A third pillar – Agriculture,
     Forestry and Other Land Uses (AFOLU) is emerging.
     3 An important source on the workings of the EU’s climate policy system is Delbeke, Jos and Peter Vis, 2019. Towards a Climate-Neutral Europe
     – curbing the trend, Routledge.

44
ings4 and appliances), regulation (e.g. requiring                             Our Approach
shrinkage in the average carbon efficiency of car
fleets selling into the EU market), carbon pricing                            For this issue, we commissioned papers as
[e.g. European Union Emissions Trading Scheme                                 follows:
(EUETS], subsidies including exemptions from
State aid rules (e.g. subsidies thereby enabled for                           Section I Framing the Challenge
renewable energy in the EU amounted to €34
billion in 20125) innovation (about €10 billion over                               1.     Towards a Deep Climate Collaboration
2020-2030 funded from auction revenues from                                               (China, European Union, India, U.S.) –
EU ETS, and the Horizon Europe Research                                                   DCC4. Frank J. Convery (University Col-
and Innovation prog (~€33 billion for climate                                             lege Dublin) and Thomas Sterner (Uni-
over the 2021-2027 period). It addresses equity                                           versity of Gothenburg)
issues by favouring poorer countries with more
allowances under EU ETS and more generous                                          2.     Carbon Dioxide Emissions by the Four
caps for non-traded emissions, using GDP per                                              Largest World Emitters: Past Perfor-
capita as a key determinant of such allocations,                                          mance and Future Scenarios for China,
and (at macro level) by making very large trans-                                          U.S.A., Europe and India. Sylvain Cail
fers to poorer regions6. Finally, there is a lot of                                       (Enerdata) and Patrick Criqui (Université
learning by doing; the first phase of policies                                            Grenoble Alpes-CNRS and Enerdata)
can be relatively ineffectual (e.g., the regulation
of average carbon efficiency of car fleets started                            Section II The U.S. Module
out as a voluntary agreement which failed) but
their performance improves incrementally over                                 The Institute for Policy Integrity New York Uni-
time.                                                                         versity School of Law uses economics and law
                                                                              to support smart policies for the environment,
There is no presumption that this model is fea-                               public health, and consumers and has made
sible at the global level, but there are elements                             many important evidence-based contributions
thereof that could be relevant as the biggest                                 to climate policy in the U.S.7 It is directed by
players on the global stage try to find a way                                 Richard Revesz. He generously agreed to have
forward that works.                                                           some of his staff provide three of the four
                                                                              papers in this module addressed to better under-
Our Ambition                                                                  standing features of domestic U.S. climate policy
                                                                              (architecture, past, future). The final paper (U.S.
Our ambition is modest: to establish a consistent                             global climate policy, past and prospective) was
baseline for each of the four jurisdictions, so that                          contributed by Nathaniel Keohane, Senior Vice
there is a shared understanding as to how the                                 -President, Climate, Environmental Defense
climate policy system in each jurisdiction works,                             Fund. Specifically:
where each has been and what it aspires to, both
nationally and on the global stage. In this issue,                                 3.     Climate Policy Architecture in the U.S.
we frame the challenge, and then address the                                              Jack Lienke (New York University) and
specifics as regards the U.S. In successive issues                                        Jason A. Schwartz (New York University)
we will do likewise for China, the European
Union and India, with the intention of having
a complete set published in time for the 26th                                      4.     U.S. Domestic Climate Policy - Looking
UN Climate Change Conference of the Parties                                               Back. Max Sarinsky (New York Univer-
(COP26) in Glasgow on 1 – 12 November 2021.                                               sity)

4 We have very recently invested in a relatively deep retrofit of our primary dwelling in Dublin which has increased its energy rating from E to
C1 – our decision to invest was influenced by the fact that our outlays are likely to be fully recovered at time of sale by the increment in its capital
value, and this is enabled by this rating, which is independently verified.
5 Ecofys, 2014. Subsidies and costs of EU energy: Final report
6 Over 2021-27, €352 billion was transferred via the following funds: Regional Development, Cohesion, Social, and Solidarity
7 Institute for Policy Integrity
                                                                                                                                                           5
EAERE Magazine / n.11 Winter 2021 - Towards a Deep Climate Collaboration

        5.    U.S. Domestic Climate Policy – Looking                        and education would ensure that future genera-
              Forward. Bethany A. Davis Noll (New                           tions would be much richer, with more technol-
              York University)                                              ogy and better information than ours and would
                                                                            therefore have much more capacities than ours
        6.    American Climate Diplomacy: Past Per-                         to deal with current environmental challenges;
              formance and New Opportunities. Na-                           our expertise and comparative advantage lay in
              thaniel O. Keohane (Environmental De-                         efficiency an maximizing the size of the pie, not
              fense Fund)                                                   in how it was distributed. But facts have begun
                                                                            to unravel some of our comfortable assump-
    Thank you                                                               tions: In the U.S., annual income of the bottom
                                                                            90 per cent of families were been essentially flat
    These authors were asked at ridiculously short                          over the 1973-2010 period – having risen by only
    notice to contribute. They already had commit-                          10 per cent over these 37 years. Over the same
    ments that demanded 150% of their available                             period, the incomes of the top 1 per cent tripled.
    time. They each not only took on the assignment,                        In the expansion which started in January 2002
    but did so with grace and to excellent effect, de-                      and ended in December 2007, the median U.S.
    livering on time, and with no recompense except                         household income dropped by €20008. In addi-
    (I hope) the satisfaction of knowing that they                          tion, those of us whose focus is on converting
    have done their bit to help push the climate                            economic insights into outcomes have had to
    policy boulder a little further towards where it                        deal with the reality that unless distribution and
    needs to be. Thank you.                                                 inequality are addressed in time and with skill
                                                                            and sensitivity, the conversion of ambition into
    Section III Celebrating EAERE Doctoral                                  action is impossible. This paper opens windows
    Awardees                                                                to this challenge and how to address it.

    One of the signs of an organization’s vitality                              8.    You Can’t Always Get What You Want:
    is its willingness to embrace rising talents that                                 Research Beyond Carbon Pricing, by
    challenge some of its mainstream beliefs and as-                                  Paul Neetzow and Jasper Meya
    sumptions. If you would like to know more about
    three important, related fields that are rapidly                        Paul is an economist at the German Federal
    growing in importance, and how they are being                           Ministry of Economic Affairs. He obtained his
    carefully cultivated by rising scholars, do take                        doctorate from Humboldt-Universität zu Berlin
    the time to read the three papers which are the                         and was awarded the Best Doctoral Dissertation
    products of our 2020 doctoral Award winners                             Award by EAERE in 2020.

                                                                            A carbon price applied universally at the right
        7.    The Growing Role of Inequality in Envi-                       level would come very close to successfully ad-
              ronmental Policy, by Lutz Sager                               dressing the climate change challenge, and so it
                                                                            quite logically has been a primary focus of our
    Lutz is Assistant Professor at Georgetown Uni-                          profession. But we note that enthusiasm for
    versity’s McCourt School of Public Policy. He                           carbon pricing in practise is inversely related to
    holds a PhD from the London School of Eco-                              the extent to which it is needed. It tends to be em-
    nomics and was awarded the 2020 EAERE                                   braced least by those jurisdictions that produce
                                                                            and use fossil fuels the most, while some of the
    Award for Best Doctoral Dissertation in Environmental                   relatively ‘carbon light’ economies take it on.
    and Resource Economics                                                  The paper by Lutz gives insights as to how to
                                                                            traverse this terrain through the lens of equity.
    For some of us, in the past it was routine to                           This paper does so by exploring the widening of
    assume that: the continuation of rising incomes                         the policy instrument mix as a parallel stratagem.

    8   ‘The Dream that Died’ Edward Luce, Financial Times Magazine July 31 August 1, 2010

6
9.    Exploring the Global Economic Conse-
         quences of Desertification, by Maurizio
         Malpede

Maurizio is a Post-Doctoral Fellow at the
GREEN Center of Bocconi University. He
holds a PhD in Economics jointly awarded by
Cattolica University and Bicocca University,
Milan. His PhD Thesis “Three Essays on Tech-
nological Progress and Economic Growth” has
been awarded the 2020 EAERE Best European
Doctoral Dissertation in Environmental and Resource
Economics.

Einstein observed that: “Everything should be
as simple as possible. But not simpler”. Un-
derstanding the economic impacts of climate
change is not for the faint hearted; the early
research perforce had to work with aggregate
data (GDP etc) with huge uncertainties as to
the validity of the estimates and their range.
Recent developments in technology and science
are enabling a much more credible and granular
understanding, which is referenced spatially, and
this evolution is epitomized by this work which
in the author’s words provides “a first step at
understanding how human-induced climate arid-
ification greatly impacts the economic develop-
ment of areas which predominantly rely on ag-
riculture” and makes a convincing case for the
“use of the Aridity Index rather than Precipita-
tion only, to have a better understanding of the
economic impacts of climate change”.

Enjoy!
Frank J Convery

                                                      7
Section I

Framing the Challenge

EAERE Magazine / n.11 Winter 2021 - Towards a Deep Climate Collaboration

     Towards a Deep Climate Collaboration
     (China, European Union, India, U.S.)
     – DCC4
     Frank J. Converya and Thomas Sternerb
     a
         University College Dublin, bUniversity of Gothenburg

                                     Frank J. Convery (frank.convery@envecon.eu) completed forestry degrees at University
                                     College Dublin and PhD (forestry economics) at the State University of New York, followed
                                     by careers at Duke University, Heritage Trust Professor at University College Dublin,
                                     and Chief Economist, Environmental Defense Fund. His professional passions: bringing
                                     academic research down to where things are done; finding ways that work to protect
                                     our shared climate and environmental commons with a focus on mobilizing markets and
                                     (latterly) innovation to these ends; help make Ireland and Europe exemplars thereof.

                                     Thomas Sterner (thomas.sterner@economics.gu.se) is a leading environmental economist.
                                     His main work is on discounting, environmental policy instruments, and environmental
                                     policies in developing countries. Recent published research includes an update to the DICE
                                     model, Covid-19 and climate policy, and carbon taxation. He serves on several prominent
                                     boards, and is also frequently interviewed in media. He has been elected Visiting Professor
                                     at Collège de France, worked as Chief Economist at the Environmental Defense Fund and
                                     also been President of EAERE during 2008-2009.

     Introduction                                                          follow (author names in brackets) the follow-
                                                                           ing baseline information for the U.S. is provid-
     When change is necessary, it is necessary to                          ed: Climate Policy Architecture (Jack Lienke &
     change. It is a core responsibility of govern-                        Jason A. Schwartz); Domestic Climate Policy
     ments everywhere to manage those risks that                           – Looking Back (Max Sarinsky); U.S. Domes-
     cannot be managed successfully on their own                           tic Climate Policy – Looking Forward (Bethany
     by their citizens, communities, and enterprises.                      A. Davis Noll); American Climate Diplomacy:
     Amongst the most challenging of these risks is                        Past Performance & New Opportunities (Nat
     climate change, but they all face very daunting                       Keohane). The same template will be followed
     head winds as they seek to manage it.                                 in successive issues as the baseline is established
                                                                           for China, the European Union and India. The
     The key arguments of the series of papers that                        series will be completed before the COP 26 in
     follow in this issue of EAERE Magazine are                            Glasgow (Nov. 1-11, 2021) and a compilation
     that: we need to change how we manage climate                         will be available there.
     change; one change worth serious consideration
     is for the four largest greenhouse gas emitters                       We are not the first to use the word ‘deep’ in the
     (China, the European Union, India and the U.S.)                       climate policy context. The Deep Decarboniza-
     to find ways that work to collaborate; a first step                   tion Pathways initiative (DPPI) was a collabora-
     in this process is to establish a shared under-                       tion of leading research teams currently covering
     standing of the baseline (climate policy architec-                    36 countries. Their aim was to help govern-
     ture, past performance and prospects at domes-                        ments and non-state actors make choices that
     tic level, global performance and prospects) for                      put economies and societies on track to reach
     each of these four jurisdictions.                                     a carbon neutral world by the second half of
                                                                           the century. Their work showing the feasibility
     A key first step is understanding for all four                        of doing what needs to be done was helpful in
     their past performance as regards emissions                           increasing the prospects for the Paris Agreement
     and economic performance, and to explore                              in 2015.1 A recent paper from the U.S. partner
     possible future trajectories; this is provided by                     in DPPI (Williams et al, 2020) argues as follows:
     Sylvain Cail and Patrick Criqui. This first issue                     “Modeling the entire U.S. energy and industri-
     is devoted to the U.S. In the chapters that                           al system with new analysis tools that capture
     1 Many of the country reports produced in early 2015 are available at: Deep Decarbonization Pathways Project | IDDRI and there are also
     many activities continuing today at IDDRI which are managed by Henri Waisman.

10
Framing the Challenge
synergies not represented in sector‐specific or er, they have enormous resources, influence,
integrated assessment models, we created mul- and talents. If they succeed, we all succeed. But
tiple pathways to net zero and net negative CO2 why not just two? China and the U.S. together
emissions by 2050... Cost is about $1 per person account for >40% of emissions; they on their
per day, not counting climate benefits; this is sig- own could also be potentially hugely influential
nificantly less than estimates from a few years as a ‘climate club’. There are many reasons for
ago because of recent technology progress.” maintaining the number of key actors to four,
but a key strategic consideration is the gain in
Our proposition is that the prospects of these resilience that a larger group could deliver over
huge climate dividends being delivered will be time. With four, if one or two jurisdictions opt
greatly enhanced if the Big Four collaborate. out, that would still leave 3 or 2 still willing to
collaborate and sustain the effort. Another im-
In this framing paper, we set the stage for what portant consideration is that India represents in
follows by addressing: why these four?; the some sense inclusion of the interests of many
progress that has been made in recent years; the people of really low income (Camuzeaux et al.,
logic of deep collaboration by the four largest 2020). The collaboration must be extended over
emitters. time to others who are committed and can see
mutual advantage in engaging and contribut-
Why these Four? ing. The emissions from the rest of the world
are rising rapidly, and they too must also be a
They contribute ~60% of total global emis- part of the solution; our case for a deep collab-
sions (Figure 1), account for about the same oration by the Big Four is a complement, not
percentage of global GDP, and are home to a substitute for action at UN and other levels.
close to half of the world’s population. Togeth-
Figure 1. CO2 by Jurisdiction, 2016
Source: World Bank (CO2 emissions (kt) | Data (worldbank.org)), which in turn have as their source Carbon Dioxide
Information Analysis Center, Environmental Sciences Division, Oak Ridge National Laboratory, Tennessee, United States.
11EAERE Magazine / n.11 Winter 2021 - Towards a Deep Climate Collaboration
Recent Progress in Practise and Perception transport sector compared to emissions from
those jurisdictions which did not apply such
At the political level, in “American Climate Di- taxes (Sterner, 2007); at EU level, car companies
plomacy: Past Performance & New Opportuni- selling into the EU have to meet a fleet average
ties” Keohane recounts how, beginning at Co- emissions target which shrinks every year. Au-
penhagen (COP15) in 2009, the U.S. and China tomatic fines are payable for non-compliance,2
agreed on climate ambition, which was further and similar policies are already in place or in
re-enforced at the Obama-Xi summit in 2013, prospect in the U.S. and China. The U.S. has
and culminated in the joint announcement of had considerable success at reducing emissions
intended nationally determined contributions in from the power sector as a result of innovation
November 2014. This so called “G2” agreement (fracking) which dramatically increased the com-
helped pave the way for success at the Paris COP petitive advantage of natural gas over fuel, and
in 2015 which brought developed, emerging and in parallel promoting renewables, whose share
developing countries into the same tent. It also of the fuel mix has grown rapidly (Mohlin et al,
set an important precedent: bilateral cooperation 2018). Both China and India have similarly dra-
by the two largest emitters of greenhouse gasses. matically increased the supply of renewables.
At the technical level, there has been progress in The Case for Deep Collaboration
terms of lowering the costs of reducing emis-
sions, exemplified by the rapid decline in the The following are arguments for them to
costs of solar power, to the point that, under consider.
certain circumstances, it is cheaper than fossil
sources (Nemet, 2019). This is symptomatic of 1. Self-interest.
a wider wave of innovation that is also lowering
the costs of wind power and of battery storage, Climate change is happening, and if not man-
which in turn is enabling the electrification of aged successfully, is likely to be a huge disrupt-
road transport under certain conditions. In all er within their respective borders, a destroyer
countries, this may deliver jobs and econom- of their physical and social infrastructure, life
ic activity and act as a sort of counter point to support systems and of the economic and so-
current or prospective economic decline in the cial wellbeing of their peoples, a destroyer of
fossil fuel dependent regions. prosperity in those countries with which they
trade, a blighter of future prospects, and the
There has been a parallel increased awareness of trigger for a ‘blame game’: who refused to act
the costs of inaction and the fact that these costs while there was still time?
may occur sooner than expected; this is exempli-
fied by more intense weather events, more flood- 2. Psychology
ing, longer droughts and more extensive and
longer lasting forest and brush fires. And our un- It will be a huge reassurance for farmers in
derstanding grows concerning the links between Burundi and shopkeepers in Brisbane to
climate change and economic and political dys- know that the Big Four are deadly serious
function and how this is becoming manifest in mi- about meeting the climate change challenge,
gration patterns, especially from South to North. and willing to collaborate to this end, thereby
At the energy and climate policy level, the Big giving them a future.
Four have their own experiences to draw from,
especially as regards what works to reduce emis- 3. Delivery of practical dividends with a
sions. A few examples: the member states of the sectoral focus:
EU have for many decades used very high indi-
rect carbon taxes (in the form of excise duties) In the case of climate policies upon which
on transport fuels, which has had the effect of they have already embarked, they can learn
reducing emissions dramatically from the road from each other at the sectoral level and take
2 Recent developments are addressed by Joe Miller in: ‘VW posts €10 billion profit in pandemic ravaged year after late recovery,’ Financial
Times, January 22, 2021.
12Framing the Challenge
advantage of experience effects.3 In “Carbon the share of electric cars in new car sales, and
Dioxide Emissions by the Four Largest World it also provides an opportunity for hydrogen
Emitters: Past Performance and Future Sce- fuelled cars; India is also addressing the air pol-
narios for China, U.S.A., Europe and India” lution and climate challenges posed by its rapidly
by Cail and Criqui, inter alia, they show the growing road transport sector and how best to
time series of CO2 emissions from 5 sectors manage the transition to a cleaner future. Ap-
- power (mainly electricity), transport (mainly plying the sequence above to this issue could,
road), industry, buildings, and process (main- at a minimum, help some or all four of them
ly steel and cement). In all cases, the power individually to improve the design and delivery
sector is the largest emitter; transport ranks of this policy and, at a maximum, at least two of
second in the U.S. and the EU, third in India them could decide to act in concert. The result
and fourth in China. could be more total ambition, delivered sooner.
The climate impact of electric vehicles depends
For each sector (which should include agricul- fundamentally on the carbon efficiency of the
ture and forestry – because our data focusses power sector; finding ways to collaborate to ac-
mainly on CO2 emissions, we have not includ- celerate carbon-reductions therein would be a
ed this sector in our benchmarking, which is a logical next step.
weakness) the following sequence could be con-
sidered4, in each jurisdiction: 4. Delivery of practical dividends with a
policy instrument focus5
• A granular assessment of the policies
already tried and those under consideration, The instrument menu is familiar, and some
and their performance, their key strengths and are already being applied, or in prospect,
weaknesses, technically and politically across sectors: it includes voluntary agree-
ments, market-based instruments (carbon tax-
• The current policy ambitions and the es and emissions trading), regulation, research
challenges that implementation could pose and innovation, removing barriers, subsidies
etc. The process template suggested above for
• The lessons from each jurisdiction that application to sectoral policy could be simi-
might be of relevance for one or more of the larly employed to the policy instrument mix.
other three For many good reasons, most economists fa-
vour market based instruments. In On Amer-
• Potential for policy collaboration and ican Taxation, Edmund Burke observed that:
an assessment of the value they could add in “To tax and to please, no more than to love
terms of increasing and/or accelerating cli- and be wise, is not given to men”. This simple
mate ambition sentence goes far to explain why it has proved
so difficult to convert this proposition into
If more than 2 decide that collaboration could action.
yield substantial gains, they find a way that works
for them to do so. Thought Leadership
An example: China, the EU and the U.S. have A lot of the thought leadership on policy instru-
set or will set mandatory standards for the ments has been led by economists and political
carbon efficiency of car fleets sold into their scientists. Because economists have a logical en-
jurisdictions; this policy is already accelerating thusiasm for carbon prices as the key, if not sin-
3 Arrow (1962, p. 156) was the first to formally test the hypothesis that “technical change in general can be ascribed to experience, that it is the
very activity of production which gives rise to problems from which favorable responses are selected over time”.
4 And this could be broken down to sub-sectoral level – e.g., address common understanding of effective sectoral policies and the argument
on learning curves for strategic technological components: wind turbines, PV panels, batteries, fuel cells, electrolysers for H2 etc.
5 Sterner and Coria (2011) provide a comprehensive menu of policy instruments and an assessment of their performance in both developed
and developing countries.
13EAERE Magazine / n.11 Winter 2021 - Towards a Deep Climate Collaboration
gular, instrument6, much of the recent discussion into ambitious shared achievement, their will-
from the profession has focused on carbon taxes ingness to share workload, evidence, and credit
as the instrument of choice. The policy must etc.? Our hope is that this series will begin to
however be global but who is to start. Research bring some clarity on some of these issues.
shows that climate treaties are hard to sustain We recognize that this is the easy bit. Finding
and therefore we may need to start with action ways that work to deliver outcomes is always
by groups, under the general heading of ‘climate hard, and there are huge competing agendas,
clubs’ or a ‘climate compact’. If the group is some potentially very contentious and rancorous,
large and powerful it can overcome the tenden- that will make it challenging for all to sufficient-
cies to free-riding that make treaties crumble. ly untangle the climate agenda from the others,
Nordhaus (winner of the Nobel Prize in 2018) and find the time and space to devote to it, and
has been a leading exponent of this analysis; to take advantage of the considerable advantag-
his prescription is a club whose members “pay es that collaboration can provide. The Big Four
dues” through costly abatement with non-mem- are now committed to climate action (Carlsson
bers penalized through tariffs. Such a club has et al., 2020) and 2021 in some ways looks like
the incentives to overcome free-riding. More a new dawn. Leonard Cohen wrote that “There
detail on his thinking and supporting references is a crack, a crack in everything. That’s how the
are in Annex I. light gets in”. We hope that this small step will
help them make the most of it.
This advocacy provides both a clear logic for
References
action at this level (which we share) and a pow-
erful single instrument to advance it. As regards Arrow, Kenneth J. (1962). The Economic Implications of Learning by
Doing Author(s). The Review of Economic Studies, 29(3): 155-173.
the latter, our approach is more modest and more
incremental, on the grounds that the first steps Carlsson, F., Kataria, M., Krupnick, A., Lampi, E., Löfgren, Å., Qin,
P., Sterner, T. & Yang, X. (2020). The Climate Decade: Changing
are often the hardest but most essential, requir- Attitudes on Three Continents. Journal of Environmental Economics and
ing their own forms of quiet courage and skill Modelling.
and acorns can grow into trees. In Annex I more Camuzeaux, J., Sterner, T., & Wagner, G. (2020). India in the coming
detail is provided on the evolution of thinking climate G2? National Institute Economic Review, 251: R3-R12. DOI:
https://doi.org/10.1017/nie.2020.2
across time on collective action at the interface
between theory, evidence and finding ways that Convery, F.J. (2021). Carbon-reducing innovation as the essential
policy frontier – towards finding the ways that work. Environment
work in the world of now; this includes some and Development Economics, 1–20. https://doi.org/10.1017/
of the references that inform that exciting and S1355770X20000467
essential frontier. We apologise for the fact that Mohlin, K., Camuzeaux, J.R., Muller, A., Schneider M., & Wagner, G.
this is at present exclusively ‘western’ (Europe (2018). Factoring in the forgotten role of renewables in CO2 emission
trends using decomposition analysis. Energy Policy, 116: 290–296.
and North America) in focus, an omission we
plan to correct in time. Nemet, G.F. (2019). How Solar Energy Became Cheap: A Model for Low-
Carbon Innovation. New York: Routledge.
Conclusion Nordhaus, William D. (2018). Climate Change: the ultimate Challenge
for Economics, Nobel Lecture, Stockholm, December.
In human as well as business relationships, Sterner T. (2007). Fuel taxes: an important instrument for climate
policy. Energy Policy, 35: 3194–3202.
before they become ‘serious’, prospective part-
ners often press the ‘pause’ button, and ask Sterner, T., & Coria, J. (2011). Policy Instruments for Environmental and
Natural Resource Management, RFF Press.
themselves the following sorts of questions:
do I really know enough about the backsto- Williams, J., Ryan, H., Jones, A., Haley, B., Kwok, G., Hargreaves, J.,
Farbes, J., & Torn, M.S. (2020). Carbon‐Neutral Pathways for the
ry and history of this person/company, what United States. AGU Advances. https://agupubs.onlinelibrary.wiley.
their real qualities and achievements are, how com/doi/full/10.1029/2020AV000284
well they deal with adversity, the constraints
Suggested citation
they face, their willingness to make sacrific-
es in the short term to advance a longer term Convery, F.J., & Sterner, T. (2021). Framing the Challenge: Towards a
Deep Climate Collaboration (China, European Union, India, U.S.) –
shared ambition, their ability to convert ideas DCC4. EAERE Magazine, 11.
6 However, innovation is being added to the mix, and this is reflected by the fact that Nordhaus, the winner of the Nobel Prize for economics
in 2018, included “Rapid technological change in the energy sector is essential” as one of the four steps in the concluding slide of his Nobel
lecture (Nordhaus, 2018). The wider case for innovation as an instrument of climate policy is made by Convery (2021).
14Framing the Challenge
Carbon Dioxide Emissions by the Four
Largest World Emitters: Past Performance
and Future Scenarios for China, U.S.A.,
Europe and India
Sylvain Cail a and Patrick Criqui a,b
a
Enerdata, b Université Grenoble Alpes-CNRS
Sylvain Cail (sylvain.cail@enerdata.net) is a senior expert in the modelling and analysis
of energy markets worldwide and at country level. His fields of expertise comprise the
modelling of interactions between energy and climate policies, and their potential effects
on energy demand, supply and the development of energy prices. In particular, he has an
extensive knowledge of the use and development of energy models like POLES-Enerdata
to build and assess long-term energy and climate scenarios. At Enerdata, Sylvain manages
the Global Energy Forecasting department, helping public and private clients from the
energy and industry sectors.
Patrick Criqui (patrick.criqui@univ-grenoble-alpes.fr) is a senior researcher emeritus at
CNRS, working on the economics of energy transition and climate policies in the Grenoble
Applied Economics Laboratory. His main research area has been the development of a
world long term energy model, POLES, used by the European Commission and different
institutions in Europe to analyze the economics of climate policies. He has been a lead
author in IPCC’s Working Group 3. Member of the Economic Council for Sustainable
Development by the French Ministry of Ecology since 2008, he currently works on deep
decarbonization scenarios. He is a research associate at IDDRI and Enerdata.
Introduction tury (or shortly after) is twofold: first, as they
today represent nearly 60 % of total CO2 emis-
The purpose of this paper is to clarify the mag- sions, the implementation of carbon neutrality
nitude of the climate challenge we face global- policies in their own jurisdiction would have a
ly and the role that the four largest greenhouse major global impact; second the implementation
gas emitters – China, the U.S.A., the European of these policies in the compact will have a sig-
Union1 and India – could potentially play, if they nificant leverage effect on the other countries,
decided on a “deep collaboration”. As stated in both by the demonstration effect and by the
IPCC’s 1.5°C report2, the challenge is indeed to learning effect for low or zero carbon technolo-
bring global emissions down to a level where gies that would benefit every country.
they could be compensated for by anthropogen-
ic carbon capture from the atmosphere. The paper proceeds along three stages. In
section 2. “Where we stand, a global view”, we
In this paper, we focus on the abatement of CO2 recall the dynamics of atmospheric concentra-
emissions as they represent two thirds of total tions for two major GHGs, CO2 and methane.
GHG emissions3. By doing so, we recognise that In section 3. “Looking back”, we analyse in
confining our data to CO2 ignores other import- more detail the trends and bifurcations in the
ant gases (methane, nitrous oxides, fluorinated emissions for each of the four constituencies we
gases) and their emission dynamics. But intro- are considering. Finally, in section 4. “Where we
ducing the other greenhouse gases would make need to go”, we analyse for the same constit-
our analysis more fragile, by lack of consistent uencies representative scenarios that will allow
and reliable time-series. In Annex II we discuss us to contrast current developments with more
this incompleteness. constrained trajectories meeting the Paris com-
mitments and, further on, net zero ambitions.
The role that a deep climate collaboration could
play in aiming at net zero emissions by mid-cen-
1 In this paper, we define and consider Europe as the European Union plus the United Kingdom (EU27+1 in the Figures). This is by
convenience, for reasons of time-series continuity and while taking into account the fact that UK’s net zero emissions policy of 2020 keeps in line
with the European Union’s perspective.
2 www.ipcc.ch/sr15/chapter/spm/
3 www.epa.gov/ghgemissions/global-greenhouse-gas-emissions-data
15EAERE Magazine / n.11 Winter 2021 - Towards a Deep Climate Collaboration
In presenting these data and scenarios, there is be used as a source of energy. Their rapidly
no implication of judgment or blame, on who growing importance and supremacy will be
is responsible and who should do what. The confirmed all along the 20th century and early
purpose is to establish a clear vision of the 21st century (Smil, 2019 and Grubler, 2012).
problem and perhaps engender fruitful discus- However, the take-off in world emissions from
sions about how to make progress at scale. fossil energy really takes place after WWII. As
shown in Figure 2, the increase is initially mod-
Where we stand, a global view erate and total CO2 emissions amount to only 5
Gt CO2 in 1945. They multiplied by a factor of
Climate change is to a large extent the result of more than 3.5 by 1979, year of the second oil
the increase in the concentration of greenhouse shock, and then again by a factor of 1.9 by 2019.
gasses in the atmosphere, due to human activ-
ity. The continuous stock building of CO2 and This perspective reveals the fact that the causes
methane in the atmosphere are shown below: of the build-up of the climate problem pertain to
between 1984 and 2019, CO2 and methane con- relatively recent economic history. The problem
centrations have increased by respectively 19% is that the accumulated GHG stock (especially
and 13% (Figure 1). CO2) is here to stay… for long.
The concentration of anthropogenic CO2 in Looking back at the “big four”
the atmosphere is the result of a process that
goes back to the industrial revolution, from the Over the past sixty years, world total CO2
beginning of the 19th century. At this moment emissions have grown in an almost linear way,
of history, fossil fuels – initially coal – start to which means that the growth rate progressively
Figure 1. Trends in Atmospheric Concentrations of Carbon Dioxide (CO2) and Methane (CH4)
Source: NOAA atmospheric GHG statistics (www.esrl.noaa.gov/gmd/ccgg/trends_ch4)
16Framing the Challenge
Figure 2. CO2 emissions, 1900-2020
Source: IEA (www.iea.org/data-and-statistics/charts/global-energy-related-co2-emissions-1900-2020)
decelerates. But what is more striking, is the very These paths diverge however after the second
uneven growth patterns of the four jurisdictions oil shock, when Europe’s emissions start a
we are considering (Figure 3). decline, which accelerates after the financial
crisis of 2008. By 2019, Europe’s emissions
From 1960 to 1986, the emission trajecto- are back to their 1965 level. U.S. emissions
ries in the U.S. and in Europe are almost plateau only between 2000 and 2008 and begin
identical, both in their level and dynamics. their downside trajectory only after that date.
Figure 3. Total fossil CO2 emissions, a sixty years’ perspective (in billion tons of CO2)
Source: Global Carbon Project, 2020 (www.globalcarbonproject.org)
17EAERE Magazine / n.11 Winter 2021 - Towards a Deep Climate Collaboration
Figure 4. Total CO2 emissions in the four regions (in billion tons of CO2)
Source: Global Carbon Project, 2020
The story is different in China, where emissions This evolution is highlighted by the changes in
increase at an annual average rate of 3-4% until the share of world emissions in the four juris-
2001, the year of the accession of China to the dictions from 1990 (the benchmark year for the
World Trade Organization (WTO). After this Kyoto Protocol) to 2019 (Figure 5). Between
date, economic growth accelerates as do total these two dates the four regions have increased
emissions: from 2001 to 2014, they increase their joint share of the total, from 56% to 59%.
from 3.5 to 9.8 Gt CO2, i.e., an annual average This is due to the increase in China’s share of
growth rate of 8.4%. By 2004, China’s total world emissions, from 11 to 28%, and to a lesser
emissions overtake those of Europe’s and in extent to the increase of India’s share, from 2 to
2007 those of the U.S. India’s emission trajecto- 7%. Conversely, the U.S. and EU shares decrease
ry shows a more regular profile, with an annual over the same period, respectively from 23% to
average growth rate of 5-6%. By the end of the 15% and from 20% to 9%.
period under review, India’s total emissions ap-
proach those of Europe, while it only represent- This new balance in world emissions reflects the
ed 4% of it in 1960. A new balance is in place. major structural changes in the world economy
during the past thirty years of globalization.
Figure 5. Share of total emissions for the different regions (in billions t CO2)
Source: Global Carbon Project, 2020
18Framing the Challenge
Figure 6a and 6b. Per capita GDP and per capita CO2 emissions
Source: Enerdata, Global Energy and CO2 Database, 2020
A per capita analysis in 1990 had risen to 27% thereof in 2019; for
India the equivalent shares were 5% and 11%.
Per capita GDP (Figure 6a) increased in every Per capita emissions (Figure 6b) follow consis-
region but at very different rates, according to tent – although not similar – patterns. While they
the country’s category, “mature” or “emerging”: decrease by 25 and 30 % respectively in the U.S.
the U.S. and Europe both see their per capita and the EU between 1990 and 2019, they signifi-
GDP increase at an annual average growth cantly increase in China and India where they are
rate of 1.4% during the 1990 to 2019 period. respectively multiplied by a factor of 3.8% and
The equivalent rate is respectively of 8.4% 2.9%. By the end of the period, per capita emis-
and 4.5% for China and India. China’s per sions of China are higher than those of Europe.
capita GDP, which was 4% of the U.S. level
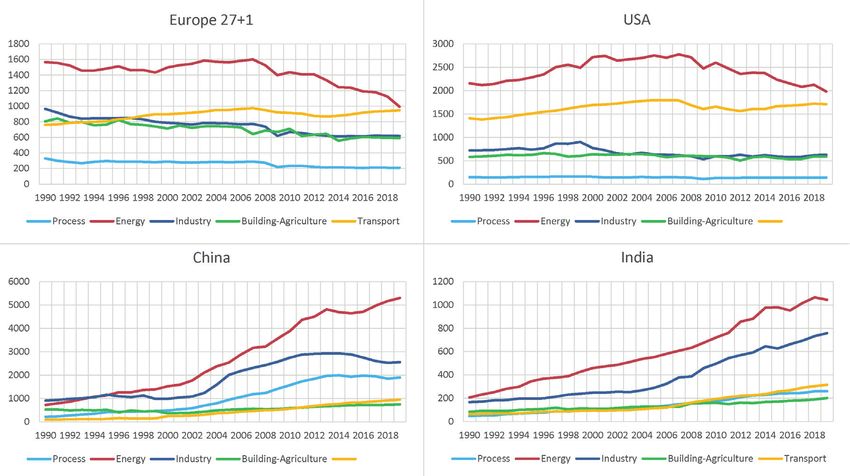
Figure 7. CO2 emissions, by sector
Source: Enerdata, Global Energy and CO2 Database, 2020
Note: “Process” stands for CO2 emissions in the production process of materials (mostly steel and cement); “Energy” stands for emissions in
the energy sector, mostly for electricity generation.
19EAERE Magazine / n.11 Winter 2021 - Towards a Deep Climate Collaboration
A sectoral analysis be achieved by 2050. In this scenario, the global
carbon budget, in line with the IPCC scenarios
The analysis of emissions by sector shows (Rogelj et al., 2019), is apportioned to countries
interesting similarities across the two pairs according to a “soft-landing” profile, based on
of jurisdictions: “mature” and “emerging”. capacity and responsibility criteria as developed
In Europe and in the U.S. the energy and trans- by (Criqui et. al, 2014). These trajectories are
port sectors dominate the others, with similar only illustrative, as many other combinations of
profiles: the energy sector (mostly electricity effort across the four jurisdictions could deliver
generation) ranks first but has decreased strong- the same aggregate outcome.
ly since the mid-2000s, while transport ranks
second but is stable and even slightly increas- Taken together, CO2 emissions of the four ju-
ing in recent years. The building and industry risdictions follow a slightly decreasing trend
sectors are comparable, in level and trend, in over the next 30 years in the NDC scenario
both jurisdictions. However, the gap between (EnerBlue), reaching 22.3 GtCO2 in 2030 and
transport and building is much larger in the U.S. 20.7 GtCO2 in 2050 (9% compared to 2019). At
than in Europe, which reflects the relative im- the global level, the EnerBlue scenario is likely
portance and carbon intensity of the transport to result in a temperature increase between 3
activity in the U.S. and 4°C by the end of the century, compared to
pre-industrial levels. In the EnerGreen scenario,
In the emerging countries, energy is also the which is compatible with a 2°C temperature rise,
leading emitting sector and has increased rapidly. CO2 emissions of the four jurisdictions in aggre-
But contrary to the economically mature ju- gate are reduced by 72% over the period 2019-
risdictions, industry, and not transport, is the 2050, which leaves approximately 6.2 GtCO2 in
second highest source of emissions. In China as 2050. The 14.5 GtCO2 emissions gap observed
in India, transport and building are of similar in 2050 between the two scenarios reflects the
relative importance, rising steadily, but well significant effort required globally, and hence at
below industry. the country level, to achieve the 2°C objective
of the Paris Agreement.
Where we need to go
This level of effort is illustrated for of each ju-
Together, China, the U.S.A., Europe, and India risdiction in the following four charts. While the
have been responsible for the emission of EnerBlue scenario assumes a decreasing emis-
22.6 GtCO2 in 2019. The following section pro- sion profile in developed economies (Europe,
vides an overview of the possible evolution of U.S.A.), the next 30 years look different in China
CO2 emissions (including industrial processes) (stable, then slightly decreasing) and India (steady
in these jurisdictions. Scenarios are based on increase of emissions). The additional emission
Enerdata’s EnerFuture4 prospective scenarios, reductions that would need to be delivered to
which are performed with the POLES-Enerda- achieve a 2°C future are significant in all juris-
ta5 model. dictions, ranging between 61% (India) and 74%
(U.S.A.) in terms of 2050 emissions gap. The
The scenarios presented here are EnerBlue and total 14.5 GtCO2 emission gap discussed above
EnerGreen. EnerBlue is a scenario in which the is in the hands of all four countries, whereby
Nationally Determined Contributions (NDCs) China, given its very high current level of CO2
of the four jurisdictions are achieved in the next emissions, has a potential to reduce for half of it.
10 years, and they continue on this reduction
trajectory up to 2050. This scenario is compared
to EnerGreen, a more ambitious 2°C-compati-
ble scenario, which would require that a collec-
tive additional reduction in the order of 14.5Gt
4 www.enerdata.net/research/forecast-enerfuture.html
5 POLES-Enerdata is the version of the POLES model run, developed and maintained by Enerdata. The POLES model has been initially
developed by IEPE (Institute for Economics and Energy Policy), now GAEL lab (Grenoble Applied Economics Lab).
www.enerdata.net/solutions/poles-model.html
20Framing the Challenge
Figure 8. Projected CO2 emissions in EU27+1, U.S.A., China and India (in Mt CO2)
Source: Enerdata, EnerFuture long-term scenarios, 2020
Limiting the temperature rise to 1.5°C: the case of Europe A 1.5°C-aligned policy commitment in Europe,
more precisely a net-zero emission pathway unto
The Paris Agreement sets out the global frame- 2050, is illustrated in Figure 9. Two main differ-
work to pursue efforts to further limit the tem- ences appear in comparison with the EnerBlue
perature increase to 1.5°C. The recent wave of and EnerGreen scenarios discussed above: on
net-zero emission targets’ announcements may the one hand the very early start of the emis-
bring a significant contribution to this objective, sions decrease, as of 2021, and the overall more
if implemented. The following assessment pro- significant effort over the time horizon. In 2050,
vides a specific focus on Europe carbon neu- the Enerdata-1.5°C scenario reaches 135 MtCO2
trality objective by the middle of the century, of residual gross emissions (including emissions
how it compares to an NDC and a 2°C-scenar- captured by CCS). Where the emission reduction
io, and what sectoral implications are expected. between the NDC and the 2°C pathway is 69%
Figure 9. Projected CO2 emissions in EU27+1(in MtCO2)
Source: Enerdata, EnerFuture long-term scenarios, 2020
21EAERE Magazine / n.11 Winter 2021 - Towards a Deep Climate Collaboration
in Europe in 2050, the 1.5°C pathway involves a so-called energy ‘sufficiency’), stringent policies
further 24% reduction, necessary to achieve the and incentives in the existing buildings stock
target. In this scenario, reductions of non-CO2 and in the regulation for new constructions.
gases are also included, amounting to roughly
240 MtCO2eq, mostly CH4 and N2O from agri- In this net-zero emissions landscape, two sectors
culture. The total residual greenhouse gas emis- appear more difficult to decarbonise, though
sions in 2050 are expected to be offset by the with a key-role to play. The transport sector
expected carbon sink provided by the LULUCF would reduce its CO2 emissions by around 85%,
(land-use, land-use change and forestry) sector, with roughly 140 MtCO2 remaining in 2050,
which is expected to increase slightly in the next despite the removal of private internal combus-
30 years. tion engines from the new vehicle sales shortly
after 2040. The agriculture sector would account
From a sectoral perspective, structural inertia for a residual 18 MtCO2, (i.e. a 67% reduction
and the speed of innovation and technology compared to 2020), half of it due to energy
deployment may lead to significant discrep- combustion and the other half from soil amend-
ancies in the contribution to a net-zero emis- ments and fertilisers. In 2050 however, the bulk
sions objective (Figure 10). At European level, of remaining GHG emissions from the agricul-
while currently the industry and energy supply ture sector are likely to be attributable to CH4
sectors today account together for half of CO2 from cattle and N2O from soils emissions.
emissions, these two sectors are expected to be
fully decarbonised by 2050, and even to provide Conclusion: A long way… in a very limited
net negative emissions. These negative emis- time frame
sions correspond to the contribution of carbon
capture and storage by this time horizon, both This quick overview of observed past emissions
in the industry and in the electricity genera- and required future decarbonisation pathways
tion sector. In such a 1.5°C scenario, the Eu- clearly demonstrates the necessity of adopting a
ropean building sector, both residential house- new course in emissions for each of the four
holds and commercial offices, is also subject major world emitters. In the mature regions,
to a deep decarbonisation through a range of the U.S. and Europe, decarbonisation is already
drivers, including behavioural changes (towards on-going but at a pace that is much too slow.
Figure 10. Sectoral CO2 emission reductions 2020-2050 for a 1.5 °C-compatible EU27+1 (Mt CO2)
Source: Enerdata, EnerFuture long-term scenarios, 2020
22Framing the Challenge
For the largest world emitter, China, the time is
decisive: while emissions have been levelling off
in the very recent years, it is now time to engage
in a rapid decline trajectory and this is clearly
required by the new policy of carbon neutrality
for China in 2060. As for India, the emissions
plateau is still to come but it should take place
between now and 2035. Thereafter emissions
should also engage in a decreasing trajectory.
Historical experience show that past energy
transitions have taken many decades for their
full deployment. But on the other hand, IPCC
scenarios demonstrate that the game will be over
shortly after the mid of this century, that is in
thirty years from now. “Accelerated transitions”
is thus now a key concept in strategic terms (So-
vacool, 2015). And addressing the societal chal-
lenge of climate change and energy transitions
should become the main research perspective of
many scientific and technological endeavours, in
a transdisciplinary perspective (OECD, 2020).
References
Grubler, A. (2012). Energy transitions research: Insights and
cautionary tales. Energy policy, 50: 8-16.
OECD. (2020). Addressing societal challenges using transdisciplinary
research. OECD Science, Technology and Industry Policy Papers, N. 88,
OECD Publishing, Paris. https://doi.org/10.1787/0ca0ca45-en
Rogelj, J., Huppmann, D., Krey, V., Riahi, K., Clarke, L., Gidden, M.,
Nicholls, Z., & Meinshausen, M. (2019). A new scenario logic for
the Paris Agreement long-term temperature goal. Nature, 573(7774):
357-363.
Smil, V. (2019). Energy in world history. Routledge.
Sovacool, B. K. (2016). How long will it take? Conceptualizing the
temporal dynamics of energy transitions. Energy Research & Social
Science, 13: 202-215.
Suggested citation
Cail, S., & Criqui, P. (2021). Carbon Dioxide Emissions by the Four
Largest World Emitters: Past Performance and Future Scenarios for
China, U.S.A., Europe and India. EAERE Magazine, 11.
23Section II The U.S. Module
EAERE Magazine / n.11 Winter 2021 - Towards a Deep Climate Collaboration

     Climate Policy Architecture in the U.S.
     Jack Lienke and Jason A. Schwartz
     New York University

                                 Jack Lienke (jack.lienke@nyu.edu) is the Regulatory Policy Director of the Institute for
                                 Policy Integrity at New York University School of Law, where he also serves as an adjunct
                                 professor.

                                 Jason A. Schwartz (jason.schwartz@nyu.edu) is the Legal Director of the Institute for
                                 Policy Integrity at New York University School of Law, where he also serves as an adjunct
                                 professor.

     Introduction                                                discussions of influence wielded by states and
                                                                 other stakeholders.
     The central, “federal” government’s power is
     divided among three separate-but-equal branch-              The Legislature
     es, each with a distinct role: the legislature (the
     bicameral Congress) makes law; the executive                The U.S. Congress has two chambers: the
     (the president and the large network of admin-              Senate, which comprises 100 Senators (two for
     istrative agencies that the president staffs and            each of the fifty states, elected on staggered
     supervises) implements it; and the judiciary (the           six-year cycles), and the House of Represen-
     district, circuit, and supreme courts) interprets           tatives, which has 435 members (apportioned
     it. In addition to the federal centers of power,            among the states based on population, elected
     state and local governments play major roles in             every two years). Most of those elected affiliate
     shaping U.S. climate policy, as do business inter-          with either the Democratic or Republican party.
     ests and other stakeholders, including communi-             Whichever party wins a majority leads the rel-
     ty and non-governmental organizations.                      evant chamber, chairs the key committees, and
                                                                 decides what legislation will be considered by
     To date, Congress has passed little climate-spe-            the chamber as a whole. Legislation must be
     cific law. Consequently, most federal policies              approved by both chambers and signed by the
     that directly or indirectly limit greenhouse gas            President to be enacted, and as will be discussed
     emissions have originated from executive-branch             further below, the Senate typically has required
     agencies, operating under broad grants of au-               the support of 60 Senators to advance legisla-
     thority included in bedrock environment- and                tion. Overriding a presidential veto of legislation
     energy-focused statutes from the 1970s. The                 requires a two-thirds majority in both chambers.
     judiciary, meanwhile, has played a significant              These features together erect a high bar for en-
     but inconsistent role in shaping these poli-                acting any significant legislation
     cies—initially interpreting old laws to allow
     or even require agencies to regulate green-                 Congress Is Unlikely to Play a Significant Direct Role in
     house gases, but later issuing decisions that               Near-Term Policymaking
     somewhat constrained agencies’ ambitions.
     This paper provides more detail on the work-                Even though the Democratic Party—the only
     ings of the three federal centers of power with             major U.S. political party that is at present
     respect to climate policy, followed by short                committed to mitigating climate change—won

26
You can also read