Early response of methanogenic archaea to H2 as evaluated by metagenomics and metatranscriptomics
←
→
Page content transcription
If your browser does not render page correctly, please read the page content below
Early response of methanogenic archaea to H2 as
evaluated by metagenomics and
metatranscriptomics
Balázs Kakuk
University of Szeged: Szegedi Tudomanyegyetem
Roland Wirth
University of Szeged: Szegedi Tudomanyegyetem
Gergely Maróti
Chemical Biological Center
Szuhaj Márk
Szegedi Tudomanyegyetem
Gábor Rakhely
University of Szeged: Szegedi Tudomanyegyetem
Krisztián Laczi
Biological Research Center
Kornél Lajos Kovács ( kovacs.kornel@bio.u-szeged.hu )
University of Szeged: Szegedi Tudomanyegyetem https://orcid.org/0000-0002-3926-0497
Zoltán Bagi
University of Szeged: Szegedi Tudomanyegyetem
Research
Keywords: hydrogen, biomethane, anaerobic digestion, methanogenesis, hydrogenotrophic methanogens,
metagenome, metatranscriptome, renewable energy, Power-to-Gas
Posted Date: April 2nd, 2021
DOI: https://doi.org/10.21203/rs.3.rs-368581/v1
License: This work is licensed under a Creative Commons Attribution 4.0 International License.
Read Full License
Page 1/30
Abstract
Background.
The detailed molecular machinery of the complex microbiological cell factory of biogas/biomethane
production is not fully understood. One of the main puzzling process control elements is the formation,
consumption and regulatory role of hydrogen (H2). Reduction of carbon dioxide (CO2) by H2 is rate
limiting factor in methanogenesis, but the community intends to keep H2 concentration low in order to
maintain the redox balance of the overall system. H2 metabolism in methanogens becomes increasingly
important in the Power-to-Gas renewable energy conversion and storage technologies.

Results.
The early response of the mixed mesophilic microbial community to H2 gas injection was investigated
with the goal of uncovering the first responses of the microbial community in the CH4 formation and CO2
mitigation Power-to-Gas process. The overall microbial composition changes, following a 10 min H2
injection by excessive bubbling of H2 through the reactor, was investigated via metagenome and
metatranscriptome sequencing. The overall composition and taxonomic abundance of the biogas
producing anaerobic community did not change appreciably two hours after the H2 treatment, indicating
that this time period was too short to display differences in the proliferation of the members of the
microbial community. There was, however, a substantial increase in the expression of genes related to
hydrogenotrophic methanogenesis of certain groups of Archaea. H2 injection also altered the metabolism
of a number of microbes belonging in the kingdom Bacteria. The importance of syntrophic cross-
kingdom interactions in H2 metabolism and the effects on the related Power-to-Gas process are
discussed.

Conclusion
s. External H2 regulates the functional activity of certain Bacteria and Archaea. Mixed communities are
recommended for the large scale Power-to-Gas process rather than single hydrogenotrophic methanogen
strains. Fast and reproducible response from the microbial community can be exploited in turn-off and
turn-on of the Power-to-Gas microbial cell factories.

Background
Anaerobic digestion (AD) of organic wastes and by-products by specialized microbial communities and
the concomitant biogas production is an environmentally attractive bioenergy production technology. In
the context of climate change, the generation of biogas as a renewable energy form has become popular
and intensively examined over the last few decades [1].

                                                  Page 2/30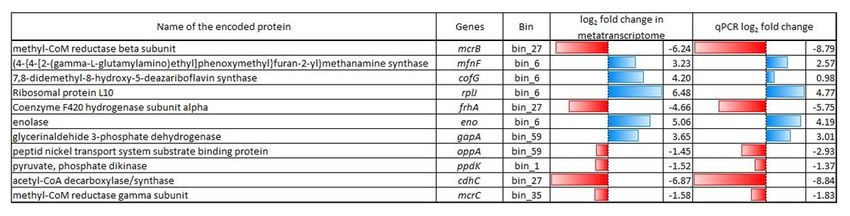
Biogas provides environmental benefits with regard to waste treatment, pollution reduction, production of
CO2-neutral renewable energy and the improvement of economy of agricultural practices through the
recycling of plant nutrients and replacing artificial fertilizers [2].

Biogas can be burnt to produce heat or combusted in gas engines for electricity generation and, after
purification, it can be used in any application for which fossil fuel natural gas is utilized today [3]. AD is
applicable to a wide range of waste streams derived from the agro-food industry, which is a source of
vast amounts of readily degradable organic material composed mainly of complex organic molecules, as
well as in liquid or solid communal waste treatments.

While the main microorganisms and mechanisms involved in the methane producing anaerobic microbial
cell factories are fairly well-known, the regulation and management of the overall process is far from
being fully understood [4] [5]. Despite the industrial-economic importance of the underlying
microbiological events, little is known about the roles, networking interactions of the microorganisms and
the regulatory mechanisms of the methane production. Therefore, the microbiological events representing
the bottlenecks of the process are difficult to manage. AD demands the concerted action of a complex
community of microbes, each member performing their special role in the overall degradation process [6,
7]. In the absence of terminal electron acceptors such as nitrate, oxygen or sulfate, the methanogenic
conversion of organic matter is an essential feature of many ecosystems [8]. The system is also a prime
candidate to understand the functional networks of complex microbiological cell factories. H2
metabolism is one of the known rate-limiting processes in AD of organic material. H2 conversion is
performed at molecular level by the class of enzymes called hydrogenases. Several hydrogenases have
been identified in methanogenic archaea. With the exception of the H2 forming methylene
tetrahydromethanopterin (H4MPT) dehydrogenase, these enzymes belong to the superfamily of nickel-
iron hydrogenases [9] (Additional file 3). The series of reactions involved in methane (CH4) formation
from H2 and carbon-dioxide (CO2) are initiated by the formylmethanofuran dehydrogenase. This enzyme
catalyzes the formation of N-carboxymethanofuran from methanofuran and CO2 [10]. Methanogenesis
from formate involves oxidation of the substrate to produce CO2 and a reduced electron carrier. The
reaction is catalyzed by a formate dehydrogenase [11]. F420-dependent hydrogenase reduces coenzyme
F420, the central electron carrier in methanogenic archaea. Other hydrogenases from methanogens
cannot reduce F420. Hence, it is referred to as F420-nonreducing hydrogenase [12]. In Methanosarcina
strains, this enzyme is membrane associated. A novel hydrogenase (Ech) was discovered in acetate-
grown cells of Ms. barkeri, which shows sequence homologies to hydrogenases 3 and 4 of Escherichia
coli and to the CO-induced hydrogenase from Rhodospirillum rubrum. The purified enzyme from Ms.
barkeri catalyzed the H2-dependent reduction of a 2[4Fe-4S]ferredoxin and is also able to perform the
reverse reaction, namely, H2 formation from reduced ferredoxin [9].

Hydrogenases are the components of the H+-translocating system in methanogens [13]. The effect of H2
on the expression of genes coding for hydrogenases and other genes has not been systematically
examined yet. The exploration of the different environmental conditions, which affect the expression of
                                                      Page 3/30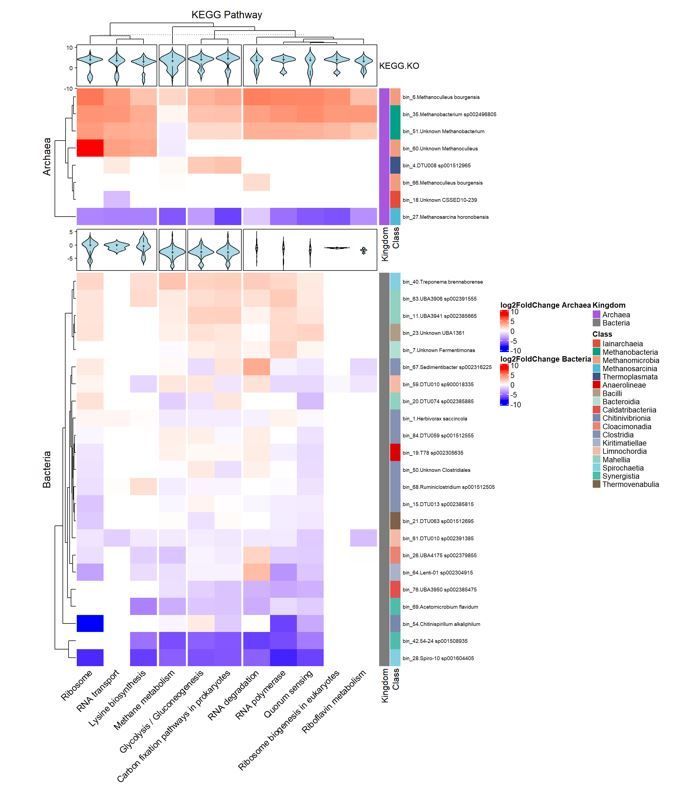
the hydrogenases and other genes could improve our knowledge concerning molecular redox
mechanisms in environmental microbiology in general. It is astonishing to note the complexity of the
molecular machinery, which handles the simplest molecule, H2.

AD is one of the most promising among the various biomass conversion processes. The regulatory roles
of the H2 levels have been recognized as a significant element in the concerted action of the complex
microbial community [13, 14]. We demonstrated earlier that by the introduction of H2-producing bacteria
into a natural biogas-generating consortium appreciably increased the efficacy of biogas production both
in batch fermentations and in scaled-up continuous AD [13]. One of the rate-limiting factors of AD is the
actual level of H2 in the system [15]. The presence of excessive amounts of H2 inhibits the activity of the
acetogenic bacteria that generate H2 in the system, whereas limiting H2 levels have an adverse effect on
an important group of methane producing Archaea, the hydrogenotrophic methanogens. In natural
ecosystems, a very low partial pressure of H2 is maintained, which may be a limiting factor for the
methanogenesis [8, 16]. The relationship between the acetogens and methanogens is syntrophic,
supported by a process called interspecies hydrogen transfer or interspecies electron flow [17]. We have
only incomplete information about the detailed mechanism of interspecies hydrogen transfer [18]. The
actual H2 concentration has been shown to determine the composition of the methanogenic community
[19–21]. The expression of up to 10% of the total proteins in a hydrogenotrophic methanogen were
reported to change in response to H2 limitation [22], indicating that the H2 availability is sensed by the
methanogens and this gas has a major effect on their physiology.

The reconstruction of the genomes (metagenome assembled genomes: MAGs) of the individual
members of a complex microenvironment and their subsequent functional and phylogenetic analysis is
termed genome-centric metagenomics [23, 24]. Genome-centric metagenomics (referred to as MG
hereafter) already yielded valuable insights into the functional organization of biogas reactors and the
microbial cell factories operating within [25, 26]. Additionally, its combination with metatranscriptomics
(the analysis of the whole microbial community mRNA in a microenvironment), i.e. genome-centric
metatranscriptomics (referred to as MTR, hereafter) enables the examination of the gene expression of
each individual MAG, has been used for the in-depth analysis of the process control, regulation and
interactions among the members of these cell factories.

This study is dedicated to unveil the early response of the anaerobic mixed microbial consortium, with
special emphasis on methanogens to the presence of H2 distress. This is a realistic scenario in large
scale AD plants due to local concentration gradients as well as in natural environments, e.g. in swamps
or rice fields. The central challenge to be understood is the regulatory role of H2 on CH4 formation and the
early response by the methanogens and other H2-metabolizing microbes, which regulates and balances
the fragile bioenergetic processes in AD.

Results

                                                  Page 4/30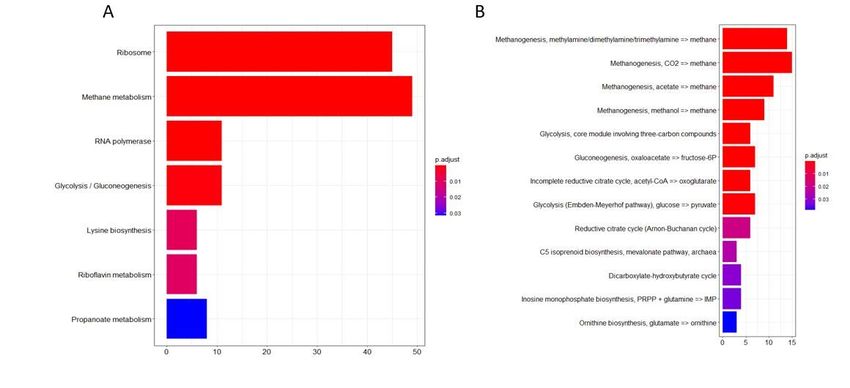
Fermentation

A constant value of VOA/TIC is a reliable indicator of a stable mesophilic fermentation process [27]. Each
experiment started with a 20 days long start-up period in order to adapt the microbial community to the
alpha-cellulose substrate. During this period the average VOA and TIC values stabilized at VOA = 1.1 g L−
1
    and the TIC = 14 g CaCO3 L− 1. Because of the relatively low substrate loading rate, the VOA/TIC ratios
were moderate, which allowed balanced operations. The amount of NH4+ is also an important indicator
of AD process stability [28]. Theoretically, levels above 3,000 mg NH4+ L− 1 may have a negative effect on
the methanogenic archaea, which is the most sensitive group of microbes in the AD process [29]. The
NH4+ concentration was below 1,000 mg L− 1 during the whole fermentation process. The biogas
productivity of the digesters was also stable: 650 mLN biogas alpha-cellulose g− 1 day− 1 were produced
with 53% of CH4 content. The first samples for DNA and RNA analysis were taken on day 20 from the
stabilized reactors. After sampling the digesters were flushed with H2 gas from a gas cylinder for 10 min
and 2 hours later the second sampling was carried out. This protocol was repeated after 2 months of
reactor operation.

The reactors displayed stable operation during the course of the experiment. The daily biomethane
production varied by < 10%. The H2 injection took place on days 15 and 71 (blue dotted arrows in
Additional Fig. 1).

The reactors responded with a sudden increase in daily CH4 evolution by 20–25% at both time points,
which lasted for 1–2 days (Additional Fig. 1). The CH4 content of the biogas was 53% throughout the
experimental period. Afterwards the reactors returned to their previous biomethane production levels. It is
worth noting that the microbial community responded exactly the same manner to the H2 spike 2 months
apart, which indicates the robustness, reproducibility and quick response time by the microbial
community. Assuming H2 saturation of the liquid phase by the H2 bubbling for 10 min, we estimated that
more than 95% of the injected H2 was converted to CH4 by the community within 16–24 hours, although
the amount of available dissolved H2 decreased rapidly during the second half of the H2 consumption
phase. This is in line with the observations of Szuhaj et al [30], who found in fed-batch H2 feeding
experiments at much lower scale that the injected H2 was completely consumed in 16–24 hours and
suggests that competing H2 consuming reactions did not interfere significantly. The H2 injection
apparently did not alter markedly the cumulative biomethane production curve, which showed a straight
line throughout the experiment.

Genom-centric metagenome analysis

The aim of this study was to examine the early response of the residing microbial consortium to the
sudden H2 burst at transcriptome level of metagenome-assembled genomes (MAGs). It was anticipated
that the microbial composition and the relative abundances of species did not change substantially

                                                   Page 5/30
between the samplings, i.e. within 2 hours. This way the differences in the expression levels of the genes
of the MAGs could be examined.
The extensive binning procedure yielded 84 bins. Out of these, 16 were high quality, 49 were medium and
19 were low, according to the MIMAG initiative [31]. 73 bins harbored enough single copy marker genes
(SCG) for the phylogenetic tree building (center part in Fig. 1.) – the phylogenetic relationship of the
remaining 11 bins could not be determined.
The taxonomic assignment of the 84 bins resulted in 7 Archaea, 61 Bacteria and 16 unclassified bins
(details are compiled in Additional table 1). Archaea represented about 10% of the microbiome. Within the
domain Bacteria, most bins (34) were associated with the phylum Firmicutes. The dominance of
Firmicutes in biogas reactors is in accordance with previous studies [8, 25]. This can be attributed to their
diverse capability in polysaccharide and oligosaccharide degradation, which is the first step in the AD of
complex organic substrates [32].
The second well-represented phylum was Bacterioidetes (12 bins), all of them belong in the order
Bacteroidales. Most Bacterioidetes produce succinic acid, acetic acid, and in some cases propionic acid,
these molecules fuel the acetotrophic methanogenesis. In addition, representatives of the phyla
Synergistota, Spirochaetes, Verrucomicrobia, Cloacimonadota, Fibrobacterota, Caldatribacteria, and
Chloroflexota were identified (Additional table 2). These results are also in line with previous studies [8,
25]. A typical microbial community flourished in our biogas digesters, which indicated that the synthetic
medium containing only cellulose as a carbon source proved to be a good model system for the
metatranscriptomic investigations [33].
A comparison of the DNA-based omics data clearly indicated that the community compositions were very
similar in all four samples (Fig. 2), respectively (Additional table 1). The overall Archaea gene abundance
in N2_MTR samples was 22.9 ± 13.4% whereas in N2-MG or H2-MG samples the same values were 22.5 ±
2.4%, respectively. This observation corroborates that i.) all reactors worked under the same conditions
maintaining the same microbial community; ii.) the microbial communities did not change perceptibly
within 2 hours as expected; iii.) the observations were highly reproducible after 2 months. Nevertheless,
the mRNA-based metatranscriptome analysis showed striking changes in the transcriptome-based
community composition when H2 was offered to the reactors’ microbial community. Approximately two
times more Archaeal genes were activated 2 hours after the H2 injection (H2_MTR = 45.06 ± 4.4%)
compared to the N2 supplied reactors. This demonstrates a rapid response to the appearance of excess
H2 by the microbial community.
The elevation of the total number of transcribed Archaeal genes (H2_MTR samples) was mainly
attributed to representatives of the genus Methanobacterium (bins 35 and 51), which increased from
8.6–30% of all bins abundance. Methanobacteria are hydrogenotrophic methanogens. The second in
contribution was the order Methanomicrobiales. The genera Methanoculleus and Methanosarcina both
belong in this order. Overall Methanomicrobiales showed an increase from 2.3–13.9% upon H2 exposure.
Page 6/30Remarkably, the genus Methanosarcina effectively ceased to express genes to near zero upon H2
dispensation (Additional table 2). Methanosarcina are known to possess genes coding for all three
methanogenic pathways, i.e. hydrogenotrophic, acetotrophic and methylotrophic methanogenesis (e.g. 8,
16). Members of the genus Methanoculleus are solely hydrogenotrophic methanogens. H2 exposure
apparently turns on the activity of the hydrogenotrophic methanogenesis in Methanoculleus but turns off
the hydrogenotrophic pathway in Methanosarcina.
Changes in the expression levels in methanogenesis genes
The contig assembly and ORF prediction/annotation workflow yielded 219,353 KEGG Orthology (KO)
annotated ORFs. Out of these 98,791 ORFs were binned in the refined MAGs. The remaining 120,562
ORFs were used for the community-level pathway analysis. The changes in the expression levels of the
genes involved in the various methanogenesis related metabolic pathways and modules were examined
according to KEGG annotation. The results indicated that the methanogenesis pathway was primarily
affected as the result of H2 injection. The upregulation of differentially expressed (DE) genes was the
highest in this pathway (48) and in the associated modules (Fig. 3.). It is noteworthy that some other
carbon metabolism associated pathways were also affected, such as Glycolysis/Gluconeogenesis and
Propanoate metabolism, which suggest that acetogenic and acetate utilizing microbes were also affected
by the specifically altered environment. H2 is known to inhibit acetogenic microbes [34], thus their
response to the H2 addition is not surprising. The RNA polymerase pathway also changed significantly,
this was due to triggered transcription machinery, which had to adapt to the demands of increased
transcriptional activity as a response to the altered environment.
In the binning process 4 different binning algorithms were used and the results were further refined by
DAS tools (see Methods section). Despite the binning efforts, many KEGG annotated genes remained
unbinned (Additional Fig. 2). Omitting these from the downstream analysis would have distorted the
pathway and statistical analyses, therefore we combined them as a group of “unbinned” genes. The
refined bins are also referred to as MAGs (Metagenome Assembled Genomes) hereafter.
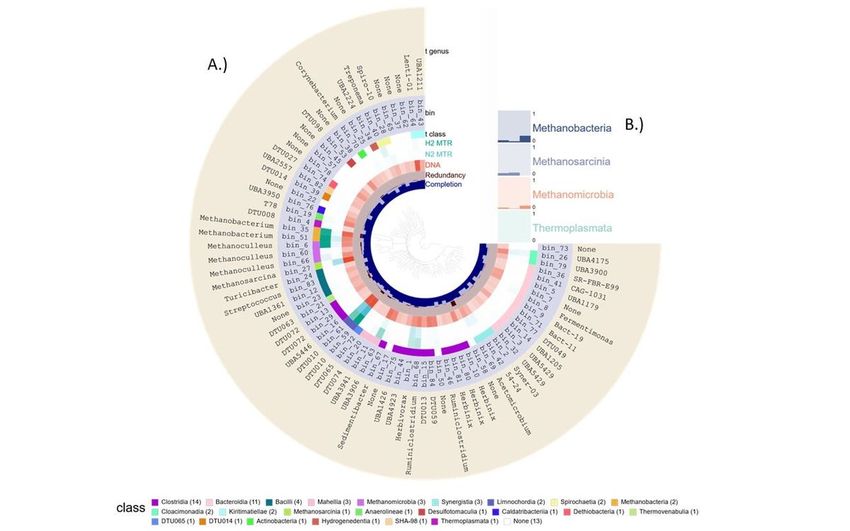
MAGs harboring more than five KEGG map00680 pathway genes were plotted in Fig. 4.
The two MAGs identified as belonging in the genus Methanobacterium (bin_35 and bin_51) and bin_6 of
Methanoculleus bourgensis showed a very similar response (Fig. 4), most of their map00680 genes are
expressed at log2 fold change (log2FC) higher than 2, i.e. four-times higher expression. Two additional
Methanoculleus MAGs (bin_60 and bin_66), a low and a medium quality MAG according to CheckM, were
identified but not presented in Fig. 4. Nevertheless, this indicates that a number of Methanoculleus strains
actively participate in the power-to gas (P2G) reaction.
In the hydrogenotrophic strains, the expression level of numerous genes increased shortly after H2
injection, which indicated that the several metabolic pathways responded to the increased H2
concentrations. The log2FC values of the genes ENO (phosphopyruvate hydratase, EC 4.2.1.11), COF (7,8-
Page 7/30didemethyl-8-hydroxy-5-deazariboflavin synthase, EC 4.3.1.32), and COM (sulfopyruvate decarboxylase,
EC 4.1.1.79) were the largest in M. bourgensis. The ENO enzyme takes part in the biosynthesis of the
Coenzyme B, which is an essential molecule in the final step of the methanogenesis. The COF enzymes
are responsible for the synthesis of the other important coenzyme, the Coenzyme F420. The COM enzyme
catalyze the 3-sulfopyruvate = 2-sulfoacetaldehyde reaction, which is an intermediate step of synthesis of
the third important coenzyme, the Coenzyme-M [33]. These results clearly indicated that the cells
increased the synthesis of all coenzymes, which are involved in methanogenesis to support the quick
conversion of H2 and CO2 to CH4.
In the MAGs belonging Methanobacterium strains, the expression level of the enzymes MFN (tyrosine
decarboxylase, EC 4.1.1.25), ADC (aspartate 1-decarboxylase, EC 4.1.1.11), FMD/FWD
(formylmethanofuran dehydrogenase, EC 1.2.99.5), AKS (methanogen homocitrate synthase, EC 2.3.3.14
2.3.3), COM increased. These enzymes also play an important role in the hydrogenotroph
methanogenesis pathway (Additional Fig. 3). The MFN and ADC enzymes are normally involved in the
methanofuran biosynthesis pathway, when they catalyze the L-tyrosine = tyramine reaction. The
FMD/FWD redox enzyme complex contains a molybdopterin cofactor and numerous [4Fe-4S] clusters in
order to catalyze the reversible reaction the formyl-methanofuran synthesis from methanofuran, which is
an important methanogenesis step in CO2 conversion and the oxidation of coenzyme-M to CO2. The
reaction is endergonic and is driven by coupling the soluble CoB-CoM heterodisulfide reductase via
electron bifurcation. The AKS enzyme also take part in the synthesis of Coenzyme-B.
Overall, the results indicated that the hydrogenotrophic methanogenic cells activated the majority of the
key enzymes in the methanogenesis pathway to consume more effectively the additional H2. It is
important that the genes of the MCR enzymes (methyl-coenzyme M reductase, EC 2.48.4.1.) showed
lower expression in all hydrogenotrophic bins. The MCR enzymes (methyl-coenzyme M reductase)
catalyze the final step of the methanogensis. One of the arguments explaining this observation was that
2 hours was perhaps not enough for redirecting this section of methanogenesis pathways. If the local
substrate availability did not increase significantly, the cells did not need to increase the transcriptional
activity of the MCR enzymes.
Almost all genes in Methanosarcina honorobensis showed decreased expression in the presence of H2
(Fig. 4). This strain has been described as acetotrophic, which also grew on methanol, dimethylamine,
trimethylamine, dimethylsulfide and acetate but not on monomethylamine, H2/CO2, formate, 2-propanol,
2-butanol or cyclopentanol [35]. The expression levels of MCR, ACS (acetyl-CoA decarbonylase/synthase,
EC 3.1.2.1) and FAE (5,6,7,8-tetrahydromethanopterin hydro-lyase, EC 4.2.1.147) significantly decreased.
The ACS enzyme is responsible for the conversion of acetate to acetyl-CoA, which is a typical step in the
acetotrophic methanogenesis pathway. The next enzyme, FAE generates 5,10-Methylene-THMPT from
formaldehyde, an important compound, intermediate of methanogenesis.
The substantial decrease in the transcriptional response of M. honorobensis to H2 injection corroborated
that this strain is unable to utilize H2, but indicated an active inhibitory role of H2 on acetotrophic
Page 8/30methanogenesis. This implicates a hitherto unrecognized tight regulatory role of H2 on diverse pathways
coupled to methanogenesis (Fig. 4).
qPCR validation of the transcriptomic data
11 genes were selected for testing the metatranscriptomic data by Real-Time quantitative polymerase
chain reaction (RT-qPCR). The genes were selected to cover a broad range of genes displaying various
gene expression levels according to the metatranscriptomic data. Genes participating in methanogenesis
as well as others involved in general in cell metabolism were included. Based on the log2FC (Fig. 5) most
of the examined genes showed consistent results with the metatranscriptomic data, although in several
cases their fold change was slightly lower than derived from the metatranscriptomic analysis. Despite
these minor differences, the RT-qPCR data clearly corroborated the MTR results.
Two genes, however, showed different results by RT-qPCR. The cofG gene had a more than 4 times
smaller gene expression fold change in the qPCR experiment and it was apparently diminished into the
unchanged category while the oppA fell from unchanged to downregulated with a two times lower fold
change than in the MTR data. The latter one is a substrate-binding protein, responsible for the transport
of various oligopeptides across the cell membrane [36].
Interactions between methanogenesis and other metabolic processes
In addition to the methanogenesis pathway in the archeal bins, we identified 9 additional pathways that
were expressed differently as the early response of the microbiota to H2 injection (Fig. 3B). Figure 6
presents the Archaea and Bacteria bins that indicate substantial up- or down regulation of several KEGG
pathways. It is clear that H2 addition rapidly caused gene expression changes in the Archaea, i.e. bin_6,
bin_27, bin_35 and bin_51, since the Ribosome, RNA polymerase and Methanogenesis pathways were
altered mainly in these bins.
In the case of Archaea, one Methanoculleus bin (bin_6) and the two Methanobacteria bins (bin_35 and
bin_51) responded with elevated gene expression in all pathways, while the Methanosarcina (bin_27) and
Iainarchaeia (bin_18) responded with a substantial and general loss of transcripts, i.e. biological activity,
in them.
Interestingly, the three Methanoculleus bins responded differently to the H2 injection. Apparently, the
entire metabolic activity, including all KEGG orthologs, were tuned up in bin_6 (classified as M.
bourgensis), whereas only Ribosomal activity, RNA transport and Lysine biosynthesis was strongly
upregulated in bin_60 and hardly any change in metabolic activity took place in bin_66 representing
presumably a different strain of M. bourgensis. Although their overall gene expression did increase
(log2FC of 2.19 and 2.37, respectively), thus the observed differences might as well indicate a slower
response by bin_60 and bin_66 and perhaps further H2 addition would have triggered a response more
similar to that of the abundant M bourgensis (bin_6). If further experiments corroborate this situation,
than the observation may indicate the time resolution limit of H2 triggered transcription and metabolic
Page 9/30changes. It seems that the whole RNA machinery must be altered for responding to a significant change
in the environment. Indeed, almost all genes (including the subunits of RNA polymerase for instance)
from these pathways were highly expressed in the Methanomicrobia and Methanobacteria bins, and 64%
of them with a log2FC of 2 or higher (p-value of 0.05 or lower). The early response to H2 injection by
Methanosarcina horonobensis (bin_27) was quite the opposite as the expression of all investigated KEGG
orthologs and metabolic pathways were hindered significantly, i.e. up to 33% (Fig. 6).
Other carbon metabolism-related pathways that showed an overall significant difference in the pathway
enrichment analysis were “carbon fixation” pathways in prokaryotes and “glycolysis / gluconeogenesis”,
which showed a similar pattern. For example the folD gene of the reductive acetyl-CoA pathway (Wood-
Ljungdahl pathway) was transcribed vigorously in bin_6 (M. bourgensis) (log2FC = 3.7). The relative
enrichment of Methanogenesis, acetate = > methane was overall the highest in this bin (mean log2FC =
3.55), this can be linked to the elevated acetotrophic methanogenesis, as there were no other major
difference between the expression change in these pathways. Interestingly though, the methanogenesis
CO2 to methane module did not increas drastically (nor did the methylotrophic module), with the
exception of a handful of genes showing log2FC higher than 2, including
methenyltetrahydromethanopterin cyclohydrolase gene in bin_6 and bin_35 (log2FC = 2.56 and 3.49,
respectively), and some others with smaller but still significant differences, including the F420-non-
reducing hydrogenase iron-sulfur subunit gene of bin_6 (log2FC = 1.32, p-value = 0.04).
Changes in gene expression levels in bacterial bins
Some genes involved in, or related to elements of the methanogenesis pathway could be found in
bacterial bins as well, e.g. Herbivorax saccincola, Ruminiclostridium sp001512505, two unknown
Limnochorida and a Mahellia MAG. However, when inspecting the change of the methanogenesis-related
KEGG orthologs in the MAGs, it becomes clear that these genes showed significant difference only in a
few cases, i.e. their log2FC values are spread between the threshold lines the indicate significance. This
means that while they are involved in the overall methanogenesis, and closely related metabolic
pathways (which are included in the KEGG map00680 pathway), they did not respond to the H2 provision
change. This is substantially different from the behavior of the Archaea MAGs, which clearly express their
genes differently as a respond to H2 injection.
In the case of Bacteria, the RNA-machinery pathways (ko03010) showed an overall decrease in gene
expression, with the exception of bin_40 (Treponema brennaborense), bin_8 (Fermentimonas
massiliensis), bin_11 (UBA3941_sp002385665) and bin_7 (Unknown Fermentimonas). These MAGs had
low abundance, though they showed an increase in the MTR samples. These pathways seem to be up-
regulated in bin_40 and in bin_11 (mapped in class Mahellia, order Caldicoprobacterales). Most of the
small and large ribosomal subunits showed log2FC of 2 or higher. Another member of the family
Treponemataceae (bin_28 Spiro-10 sp001604405) showed a clear downregulation in all discussed
pathways.
Page 10/30In AD, Treponema behave like the homoacetogenes, they consume H2 and CO2 to produce acetate, hence
they may compete with hydrogenotrophic methanogens [37], although not very efficiently [16]. We
identified only two methanogenesis related genes in bin_28 and bin_40 (formate-tetrahydrofolate ligase
and methylenetetrahydrofolate reductase NADPH), bin_40 showed an overall activity increase (log2FC =
2.216), indicating either that this pathway would become more active at a later time-point, or these
bacteria utilize alternative catabolic activities. In a relevant observation Treponema abundance increased
in digesters spiked with H2 [38], although after 90 hr the signs of H2 stress were noted in the digester.
Essential genes of the Wood-Ljungdahl (WL) pathway were apparently not expressed in bacterial bins in a
recent study [39]. In contrast, in the present work we identified several bins harboring these genes,
including bin_7 (Unknown Fermentimonas), bin_8 (Fermentimonas massiliensis) and bin_20 (DTU074
sp002385885, although all of them showed low abundance (~ 0.3-1%). Interestingly, bin_20 exhibited an
overall decrease, but the expression of its WL pathway genes increased. This can be attributed to the
elevation of the transcriptional activity of only two genes, the fhs gene (formate-tetrahydrofolate ligase)
and the folD gene (methylene-tetrahydrofolate oxidase), which are important in WL pathway (log2FC =
6.31 and 3.14, respectively). This response to H2 is thus the opposite to that of bin_40, suggesting that as
acetogenic methanogenesis increased, it might have tried to compete with the Archaea for the acetate.
The other two potential homoacetogens, which increased their transcriptional activity (log2FC = 1.40 and
2.56, respectively), apparently included the fhs and folD genes as well. It was also demonstrated earlier
that homoacetogenic microbes tended to increase their activity in a H2-fed systems [40].
Discussion
The interest in converting the fossil fuel based energy market to renewable energy carriers is growing
worldwide. This is a very positive trend to avoid threatening global climate change and associated
environmental catastrophes. The overwhelming majority of renewable energy production approaches
employ photovoltaics and wind power today. Both of these technologies generate electricity in an
intermittent fashion. The power distribution grids are designed to harmonize electricity production and
consumption continuously, these grids can operate in a fluctuating mode only with substantial energy
loss. Hence, technologies to balance the fluctuations are urgently needed. A very promising solution to
this problem is offered by the flexible biogas technology [41]. Biogas plants have controllable energy
output to buffer the fluctuations in renewable electricity production. Moreover, with a coupled technology
called Power-to-Gas (P2G), Power-to-Methane (P2CH4) or Power-to-Biomethane (P2bioCH4), biogas
reactors can efficiently convert the temporarily surplus renewable electricity to biomethane. Clean
biomethane is chemically indistinguishable from the fossil natural gas, therefore can be stored and
transported efficiently and inexpensively via the natural gas grids. The biotechnological route to
P2bioCH4 requires specific microbes capable of converting H2 + CO2 to CH4 in a carbon neutral or
negative carbon footprint process. The key potential player microbes are methanogenic Archaea, a group
of rare and obscure obligate anaerobic microbes. The precise biochemical events leading to CH4
formation are only understood in a broad sense today.
Page 11/30Understanding of the molecular regulation and control of the highly complex cell factory pathways of
microbial communities carrying out AD, is a challenge for both basic and applied research. In this study
we aimed at mapping the early response of the entire community, with particular attention to
methanogens, a scenario frequently envisaged and expected in the P2bioCH4 industry [30].
In a recent study thermophilic biogas reactors were fed with H2, and after 18 hours and 36 days MTR
analyses were carried out to unveil the involvement of the individual MAGs in the global microbiome
functions [39]. The results revealed a multi-trophic role to Methanosarcina thermophila, although the
hydrogenotrophic Methanoculleus thermophilus prevailed as the dominant Archaeal species in terms of
relative gene expressions, at the expense of M. thermophila. Some community members that emerged in
the later stages of methanogenesis were below the detection limit in the starting sample, i.e.
Methanobacteriaceae spp.
The changes in the metatranscriptome of an AD community triggered by H2 addition were studied before
in thermophilic reactors, but the short-term response at mRNA-level to H2 was not.
Mapping the early response of the microbial community via genome-centric metatranscriptomics is
therefore important for understanding and managing the turn-on and turn-off steps of the P2bioCH4
process. Genome-centric MG linked MTR investigations enables the distinction of the activity of each
individual MAG and the identification of the key and most sensitive members of the community.
Our primary objective was to examine the initial response of the methanogenic archaea and other
members of the consortia, and assess the genes that are the first up- or down-regulated ones by the H2
injection. We used a custom bioinformatics workflow for the downstream analysis of the genes and
pathways of each MAGs. This involved primarily the SqueezeMeta [42] pipeline, which can jointly analyze
MG and MTR sequencing data, amended with a more extensive binning procedure, a subsequent
pathway enrichment analysis and statistical evaluation of the log2FC of the gene expressions of the
MAGs between the H2 and N2 MTR samples. In order to gain higher statistical confidence in the results,
we used biological duplicates separated by a two-month interval in CSTR AD reactors. The following
important considerations were also adopted: 1.) The metagenomes of the samples separated by just a
two-hour time-window, i.e. before H2 addition and 2 hours later, to reveal whether the community
composition did change in 2 hours. No perceivable changes occurred in the AD community, therefore the
observed variations in the metatranscriptome were not biased by the changes in the metagenome. 2.)
qPCR tests of a handful of selected genes validated the results from the metatranscriptomics pipeline. 3.)
First we established that the composition of the microbial community did not change significantly
(Fig. 2), therefore the different reproduction rates of the various taxa did not disturb the picture of early
functional response. Up-to-date metagenomic and metatranscriptomic methods were employed to
determine the biochemical events taking place as the result of H2 administration. The reproducibility of
the system was tested by repeated H2 injections 2 months apart. Practically identical results were
obtained (Fig. 2).
Page 12/30Four metagenome (MG) sequencing datasets were combined to assemble a fairly large number of bins
(84 bins: 7 Archaea, 61 Bacteria and 16 unclassified bins). The non-H2-adapted, “raw” biogas forming
microbial community was essentially the same in structure and composition as the ones sampled
previously from the same industrial biogas plant fed with manure and maize silage [44, 45]. This
community switched to H2 consumption and biomethane production almost immediately following H2
injection, although feeding of the entire community with alpha-cellulose substrate continued as before.
We interpret that this behavior indicated the presence of sufficient hydrogenotrophic methanogenesis
activity in the “raw” biogas community, i.e. in the large scale biogas plant effluent, to perform the
P2bioCH4 conversion at full speed. In other words, the diverse, “raw” anaerobic communities can be used
in switching on P2bioCH4 without a lengthy adaptation and enrichment period. This allows a quick and
efficient turn-on and turn-off response by the mixed methanogenic community. The microbial community
composition rearranges upon long-term exposure to H2 (and CO2), particularly when no other organic
substrate is available for the community [45]. The vigorous P2bioCH4 activity returned to normal biogas
production as soon as the dissolved H2 diminished, but the community was ready to adjust its
biochemistry to instant H2 conversion and P2bioCH4 repeatedly.
The metatranscriptomic responses to the H2 treatments separated two months apart were very similar to
each other indicating that the metabolic pathways were flexibly restored after switching on and off the
P2bioCH4 operational mode. A thorough analysis of the differences between the H2-treated
metatranscriptomes and corresponding controls identified the early events in the microbial communities
brought about by H2.
H2 (and dissolved CO2) is readily converted to CH4 by both direct (hydrogenotrophic) and indirect
(homoacetogenesis and subsequent acetotrophic) methanogenesis. Our results suggest that the second
route is unlikely the predominant one in the early response of the microbial community to H2 addition at
least under mesophilic conditions, since the acetotrophic pathways reacted sluggishly, while the gene
transcription of the hydrogenotrophic route increased dramatically after a very short period of extensive
H2 feeding (Figs. 4 and 5). This predicts that under the P2bioCH4 operation conditions the physiological
readiness of the hydrogenotrophic methanogen members of the community will determine the reactor
response rate upon switch-on of the H2 addition.
Interestingly, this study revealed an extensive reaction to the transient H2 stress within the Bacteria
community as well although Bacteria cannot directly generate CH4 from H2 as many Archaea do. Many
of these Bacteria possess the complete or partial enzyme sets for the Wood-Ljungdahl pathway. These
and the homoacetogens are probably the best candidates for syntrophic community interactions between
members of the distinct kingdoms of Archaea and Bacteria. The details of these interactions in the
complex anaerobic environment and consequences to stabilize robust and vigorous P2bioCH4 microbial
communities during long term P2G operation should be the subjects of future studies. Nevertheless, the
transcriptional activity of the primary potential syntrophic bacterial partners (bin_1 (Herbivorax
Page 13/30saccincola), bin_68 (Ruminococcus sp)., and unidentified bins_59, _61, _63, see Fig. 4) did not change
substantially upon H2 exposure. This may mean that either there is enough syntrophic capacity already in
the non-adapted, “raw” community to support increased hydrogenotrophic methanogen activity or the
syntrophic partners respond slowly to the sudden H2 burst appearing in the microbial environment.
The development of a stable P2CH4 community strongly depends on environmental conditions and on
the starter microbial community composition. Various reactor designs, operational parameters and
inocula are being tested making rigorous comparison of the results difficult.
In a brief review to summarize in situ biogas upgrading Zhang et al. [46], pointed out the predominant
roles of the genus Methanoculleus under mesophilic conditions and the thermophilic genus
Methanothermobacter at elevated temperatures. The species M. bourgensis (bin_6) was identified to play
an important role in various biogas reactor systems. Methanoculleus species grow on carbon dioxide
(CO2) and hydrogen (H2) and hence perform the hydrogenotrophic pathway for CH4 synthesis [47]. In line
with these conclusions, the mesophilic AD methanogenic community of palm oil mill effluent with
eventual addition of formate was predominated by members of the genus Methanoculleus [48]. In a
related study, various inocula were compared for biomethane production at mesophilic conditions in
batch fermentations. It was concluded that the abundance and activity of the genera Methanosarcina
and Methanoculleus played key roles in methanogenesis of added H2 [48], while the authors also noted
the regulatory role of the available CO2/bicarbonate in the production of CH4 and/or volatile fatty acids.
In a recent work [49] the microbial community changes were followed under various operational
conditions starting from two distinct inocula, i.e. wastewater (WW) sludge and plug-flow reactor operated
with agricultural waste (PF). The study pointed out the importance of the history of the inoculum
communities. In the WW inoculated batch reactors the methanogenic genus Methanobacterium and
Methanothrix predominated although upon H2 feeding the genus Methanobacterium took over. In the
plug-flow reactor, supplied with animal manure and ensilaged plant biomass, the initial abundance of
genus Methanothrix diminished and the methanogenic gap was filled in by members of the genera
Methanobacterium and Methanoculleus. This study corroborated the previous observations (30, 19)
concerning the regulatory role of H2 concentration and CO2 depletion in the selection of hydrogenotrophic
methanogens predominating the P2bioCH4 community.
In a thorough in situ syngas bioconversion study running two UASB reactors in sequence at mesophilic
temperature [50], observed the predominance of the genus Methanotrix (formerly Methanosaeta). The
reactors were continuously fed with varying glucose loads. Methanotrix species apparently cannot carry
out hydrogenotrophic methanogenesis, therefore their predominance under these conditions can be
rationalized by the combined effects of glucose and CO-rich syngas addition via carboxydotrophic
methanogenesis [51]. In addition, the recently recognized capability of Methanotrix species to carry out
direct electron transfer (DIET) to drive CO2 reduction could facilitate the Methanotrix predominance [52,
53].
Page 14/30Taking into account these recent results and considerations, the development of a stable P2bioCH4
mixed AD community depends on a number of important parameters, such as the origin of inoculum, H2
supply and its fluctuation, composition of added growth supporting substrates, the dissolved CO2/HCO3−
concentration, temperature and reactor configuration.
Conclusion
In this study the early response of the mixed biogas microbial community to the presence of saturating
amount of H2 was examined. Metagenomic and metatranscriptomic analyses have been carried out to
determine the changes of the expression levels of the different genes take part in the methanogenesis.
The results indicated that the microbial community responded instantaneously to the presence of H2. The
activity of acetotrophs reduced significantly. In addition, the metabolic activity of numerous bacterial
strains changed substantially as a response to H2. Clearly, the excess H2 does not only affect the
methanogenesis pathways in Archaea, rather the microbial community respond with a complete gene
expression profile change, which seems to be rather selective. This indicates a more global regulatory role
of H2 in the life of anaerobic communities than assumed earlier. The syntrophic interactions contribute to
the stability and metabolic activity of the hydrogenotrophic methanogens. This, together with the non-
sterile operation conditions and continuous supply of inexpensive catalyst, underlines the benefits of
using mixed communities in the P2bioCH4 process instead of pure hydrogenotroph cultures [30, 54, 55].
Materials And Methods
Anaerobic fermentation
Anaerobic digestions (AD) were carried out in continuously stirred tank reactors [56]. The fermentation
volume was 5,000 mL, leaving a headspace of 2,000 mL. The apparatus can be fed continuously or
intermittently via a piston type delivery system, the fermentation effluent is removed through an air-tight
overflow. The reactors are equipped with a spiral strip mixing device driven by an electronic engine. An
electronically heated jacket surrounds the cylindrical stainless steel body, electrodes for the measurement
of pH and redox potential are inserted through the reactor wall, in sealed sockets. The device can be
drained at the bottom. The evolved gas leaves the reactor through the top plate, where ports for gas
sampling and the delivery of liquids by means of syringes through silicone rubber septa are also
installed. Gas volumes are measured with thermal mass flow devices (DMFC SLA5860S, Brooks). A fresh
sample from an industrial scale mesophilic biogas plant, fed with pig slurry and maize silage mix
(Zöldforrás Biogas Plant, Szeged, Hungary) was used as an inoculum, i.e. the microbial community
adopted to heterogeneous substrate degradation. The reactors were flushed with N2 to ensure anaerobic
conditions and were closed air tight. During the experiment the digesters were fed twice a day with
synthetic medium in which only alpha-cellulose was added as a carbon source at a loading rate of 1 g
oDM L-1 day-1. The reactors operated under mesophilic conditions, at 37°C.
Page 15/30Determination of fermentation parameters
Organic dry matter (oDM): The dry matter content was determined by drying the biomass at 105°C
overnight and weighing the residue. Further, heating of this residue at 550°C provided the organic total
solids content.
NH4+-N: For the determination of NH4+-N content, the Spectroquant Ammonium test (1.00683.0001 test,
Merck, Kenilworth, N.J., USA) was used in a Nova 60 spectrophotometer according to the manufacturer’s
instructions.
VOA/TIC (Volatile organic acids/Total inorganic carbon): 5 g of each AD samples were taken for analysis
and diluted apprepriately with distilled water. The subsequent process was carried out with a Pronova
FOS/TAC 2000 Version 812-09.2008 automatic titrator (Pronova, Germany).
Sampling
The first samples were taken when the reactor operation was stabilized under N2 in the headspace, the
daily biogas production, CH4 content and total organic acid/buffer capacity ratio were constant. 2 mL of
reactor content was taken and total RNA for transcriptome analysis (sample names: N2-MTR) and DNA
for metagenome analysis (sample names: N2_MG) were isolated immediately after sampling. Than the
headspace of the digesters were flushed with pure H2 gas for 10 min. The next samples were taken 2
hours after flushing the reactors with H2 for RNA (sample names: H2_MTR) and DNA recovery (sample
names: H2_MG). The headspace was then replaced with N2 and the reactors were run under the same
conditions as before. After additional 2 months the whole H2 treatment experiment was repeated in order
to test the reproducibility of the changes. At each sampling time point two biological parallels were
withdrawn.
RNA isolation and cDNA synthesis
For total RNA isolation 2 mL of reactor liquid samples were withdrawn. The samples were centrifuged at
12,000 rpm for 10 minutes. RNA extractions were carried out with the Zymo Research Soil/Fecal RNA kit
(R2040, Zymo Research, Irvine, CA, United States). After lysis (bead beating), the Zymo Research kit
protocol was followed. The DNA contamination was removed by Thermo Scientific Rapidout™ DNA
removal kit (K2981, Thermo Fisher Scientific, Waltham, MA, United States). Ribosomal RNA was depleted
using the Ribo-Zero™ rRNA Removal Kit for Bacteria (Illumina, Madison, USA) according to the
manufacturer’s instructions. The rRNA depleted samples were purified via the RNA Clean & Concentrator
Columns from Zymo Research (Irvine, USA). During this step, an additional in-column DNase I treatment
was included to ensure complete removal of DNA. Subsequently, synthesis of double-stranded cDNA was
conducted using the Maxima H Minus Double-Stranded cDNA Synthesis Kit from ThermoScientific
(Waltham, USA). In the first-strand cDNA synthesis reaction, 2 µL of random hexamer primer were used.
Final purification of the blunt-end double-stranded cDNA was carried out using SureClean Plus solution
Page 16/30from Bioline (Luckenwalde, Germany). The cDNA was sequenced in the same way as the total DNA. The
quality of the RNA preparation was checked by agarose gel electrophoresis (data not shown).
DNA isolation:
2 mL of samples were taken from the reactors for the isolation of nucleic acids. DNA extractions were
carried out using a slightly modified version of the Zymo Research Fecal DNA kit (D6010, Zymo Research,
Irvine, USA). The lysis mixture contained 100 µL of 10% CTAB (cetyltrimethylammonium bromide) to
improve the efficiency [57]. After lysis (bead beating was performed by Vortex Genie 2, bead size: 0.1 mm;
beating time: 15 min, beating speed: max) and subsequently the Zymo Research kit protocol was
followed.
The quantity of DNA was determined in a NanoDrop ND-1000 spectrophotometer (NanoDrop
Technologies, Wilmington, DE, United States) and a Qubit 2.0 Fluorometer (Life Technologies, Carlsbad,
CA, United States). DNA purity was tested by agarose gel electrophoresis and on an Agilent 2200
TapeStation instrument (Agilent Technologies, Santa Clara, CA, United States).
Sequencing
Paired-end libraries were prepared for the metagenome and metatranscriptome samples using the
NEBNext® Ultra™ II DNA Library Prep Kit for Illumina (Cat.Num.: E7645L). Paired-end fragment reads were
generated on an Illumina NextSeq sequencer using TG NextSeq® 500/550 High Output Kit v2 (300
cycles). Raw read sequences (.fastq files) are available on NCBI-SRA under the following BioProject id:
PRJNA 698464
Reverse transcription coupled quantitative PCR
11 genes were selected for reverse transcription coupled quantitative PCR (RT-qPCR) based on the
metatranscriptomic data. From every sample, 500 ng of RNA was transcribed into cDNA with the High
Capacity cDNA Reverse Transcription Kit (Thermo Fisher Scientific, Waltham, MA, USA) according to the
instructions of the manufacturer. The PCR primer oligonucleotides were synthesized by Eurofins
Genomics (Eurofins Genomics, Ebersberg Germany). The primers are listed in Additional table 3. The
reactions were prepared in a final volume of 25 µL with Kapa SYBR Fast Universal qPCR kit (Roche, Basel,
Switzerland). The qPCR experiments were carried out on a BioRad CFX96 Touch Real-Time PCR Detection
System (BioRad, Hercules, CA, USA) with the following parameters: Initial denaturation was at 95°C for 3
min then 40 cycles of 95°C for 10 sec and 60°C for 30 sec. For quantification of the gene copies,
standards were prepared with every primer pair from the genomic DNA. The standards were amplified
with DreamTaq DNA Polymerase in a BioRad T100 Thermal Cycler with the following parameters: Initial
denaturing was at 95°C for 3 min, then 35 cycles of 95°C for 30sec, 60°C for 30sec, 72°C for 20 sec. After
amplification, the PCR products were purified with Viogene PCR Advanced PCR Clean Up Miniprep
System (Viogene Biotek Corp., New Taipei City, Taiwan) following the manufacturer’ instructions. The
PCR product concentration was measured on a Qubit4 fluorimeter (Thermo Fisher Scientific) with a Broad
Page 17/30Range Assay Kit. The molarity of the PCR products was calculated based on the size and concentration
of the particular gene fragment. Dilution series were created from the PCR products with a factor of 10
from 1×10⁹ to 1×101 copies/µL. All dilution series were measured on the same plate with their
corresponding cDNA samples in the RT-qPCR experiments. The RT-qPCR runs were evaluated with CFX
Maestro version: 4.1.2433.1219 (BioRad). log2FC of the gene expression was calculated as for the
transcriptomics data.
Bioinformatics
Quality filtering and trimming of the raw reads were carried out with FastQC. Assembly with MegaHIT,
ORF prediction with prodigal and predicted gene functional annotation was carried out within the
SqueezeMeta workflow [42]. For the KEGG KO annotation EggNOG database (v. 5) was used [58]. Binning
of the contigs was carried out with four different binning algorithms: Metabat2 [24], Maxbin2 [59],
Concoct [23] and Binsanity [60]. The result of each binning procedure was further improved with DAS tool
[61] and CheckM- bin taxonomy.
The filtered reads from each sample were mapped back onto each bins with bowtie2 [62] and
FeatureCounts [63] was used to calculate the gene count table by using the ORF predictions of the bins.
Since we were primarily interested in pathway analysis, genes that could be annotated with a KEGG
Orthology (KO) were kept [64]. For the assessment of log2 fold changes (log2FC) between the samples the
DESeq2 package was used [65], which was proven to be a correct method to infer differences between
metagenomic and metatranscriptomic gene counts [66]. The following parameters were set: test = "Wald",
fitType = "parametric", filterFun = ihw. Genes with a p-value > 0.05 were termed significantly different
expression (DE). The subsequent downstream analysis was carried out within the R environment by using
packages of the tidyverse. Phyloseq [67] to coerce bin abundances into different taxonomic levels (e.g.
Class). For visualization ggpubr package were used (https://github.com/kassambara/ggpubr).
Differentially expressed KOs and pathways were assessed at two levels: First, counts of genes with the
same KO annotation were grouped together and summed in each sample. Differentially expressed KOs
between the two MTR samples were then determined with DESeq2 as described above. The resulting DE
KO list was the input for Clusterprofiler R package [68] to detect differentially expressed pathways. Then
counts of genes with the same KO annotation were grouped together in each sample and in each bin,
since our main focus was to assess which pathways changed in the individual genome bins. Genes that
did not belong to any bin were grouped together as unbinned. Differentially expressed KOs of every bin
between the two MTR samples were then determined with DESeq2, based on L2FC and p-values. This bin-
KEGGKO-sample table was also rlog-transformed (regularized logarithm transformation) with the rlog
function of the DESeq2 package and results were subjected to a Principial Component Analysis (PCA)
using the FactoMineR package.
Declarations
Page 18/30Availability of data and material
All the R scripts that were used to analyze the data are available upon request. Raw read sequences
(.fastq files) are available on NCBI-SRA under the following BioProject id: PRJNA698464
(https://www.ncbi.nlm.nih.gov/bioproject/PRJNA698464).
Acknowledgments
ZB acknowledges the funding of National Research, Development and Innovation Office OTKA program,
project number FK 123902. RW and GM received partial support from the Hungarian NKFIH fund projects
PD132145 and FK123899. This study has been also supported by the Hungarian National Research,
Development and Innovation Fund projects GINOP- 2.2.1-15-2017-00081, EFOP- 3.6.2-16-2017-00010 and
2020-1.1.2-PIACI-KFI-2020-00117. GM was also supported by the Lendület-Programme of the Hungarian
Academy of Sciences (LP2020-5/2020).
Ethics approval and consent to participate
No human or animal participants, data or tissue has been involved in the study, therefore no need for
ethics approval is needed.
Consent for publication
The manuscript contains no personal information data, therefore no consent is required.
Availability of data and materials
All the R scripts that were used to analyze the data are available upon request. Raw read sequences
(.fastq files) are available on NCBI-SRA under the following BioProject id: PRJNA698464
(https://www.ncbi.nlm.nih.gov/bioproject/PRJNA698464).
Competing interest
The authors declare that they have no competing interest.
Funding
ZB has been awarded by funding of Hungarian NKFIH/OTKA program, project number FK 123902. RW
and GM received partial support from the Hungarian NKFIH fund projects PD132145 and FK123899. This
study has been also supported by the Hungarian National Research, Development and Innovation Fund
Page 19/30You can also read