Ecological site R092XY001WI Sandy Shore Complex
←
→
Page content transcription
If your browser does not render page correctly, please read the page content below
Natural Resources
      Conservation Service

                                    Ecological site R092XY001WI
                                       Sandy Shore Complex
                                                Last updated: 4/08/2020
                                                 Accessed: 03/08/2022

General information

MLRA notes
Major Land Resource Area (MLRA): 092X–Superior Lake Plain

The Wisconsin portion of the Superior Lake Plain (MLRA 92) corresponds very closely to the Superior Coastal Plain
Ecological Landscape published by Wisconsin Department of Natural Resources (WDNR 2015). The following brief
overview of this MLRA is borrowed from that publication.

The Superior Coastal Plain is bordered on the north by Lake Superior and on the south by the Northwest Sands,
Northwest Lowlands, and North Central Forest Ecological Landscapes. The total land area is approximately 1.2
million acres, which mostly consists of privately-owned forestland. The climate is strongly influenced by Lake
Superior, resulting in cooler summers, warmer winters, and greater precipitation compared to more inland locations.
The most extensive landform in this ecological landscape is a nearly level plain of lacustrine clays that slopes gently
northward toward Lake Superior. The coastal plain is cut by deeply incised stream drainages and interrupted by the
comparatively rugged Bayfield Peninsula.

During the Late Wisconsin glacial period, this area was covered with the advancing and retreating lobes of Superior
and Chippewa. The landscape was rippled with moraines, but they were subdued by deposition of lacustrine
materials. As the glaciers receded, glacial lakes riddled the landscape—most notably, Glacial Lake Duluth. The
glacier receded eastward, exposing the western Lake Superior Basin. The ice covered the eastern basin, blocking
the outlet of the lake, and continued to recede and contribute meltwaters that filled the glacial lake. The deep, red
clays were deposited during this period of glacial lakes. The meltwaters from the glacier also contained sands
which were deposited along the edge of the glacial lakes as beach deposits. Deep, narrow valleys have since been
carved by rivers and streams flowing north into Lake Superior.

Historically, the Superior Coastal Plain was almost entirely forested. Various mixtures of eastern white pine (Pinus
strobus), white spruce (Picea glauca), balsam fir (Abies balsamea), white birch (Betula papyrifera), balsam poplar
(Populus balsamifera), quaking aspen (Populus tremuloides), and northern white-cedar (Thuja occidentalis)
occurred on the fine-textured glacio-lacustrine deposits bordering much of the Lake Superior coast. Sandy soils,
sometimes interlayered with clays, occur in some places. Such areas supported forests dominated by eastern white
pine and red pine (Pinus resinosa). Eastern white pine was strongly dominant in some areas, according to mid-19th
century notes left by surveyors of the federal General Land Office (Finley, R. 1976). Dry-mesic to wet-mesic
northern hardwoods or hemlock-hardwood forests were prevalent on the glacial tills of the Bayfield Peninsula. Large
peatlands occurred along the Lake Superior shoreline, associated with drowned river mouths.

Classification relationships
Habitat Types of N. Wisconsin (Kotar, 2002): This ES keys out to two habitat types: Acer rubrum – Abies balsamea
/ Vaccinium spp. – Cornus canadensis; Pinus strobus – Quercus spp. / Gaultheria procumbens [ArAbVCo or PQG]

Biophysical Setting (Landfire, 2014): This ES is mapped as Laurentian – Acadian Northern Pine – (Oak) Forest and
Laurentian – Acadian Sub-boreal Mesic Balsam Fir-Spruce Forest. This ES is most similar to the Northern Pine-Oak
Forest, but is not well represented by either classification.

WDNR Natural Communities (WDNR, 2015): This ES does not match any described communities based on its high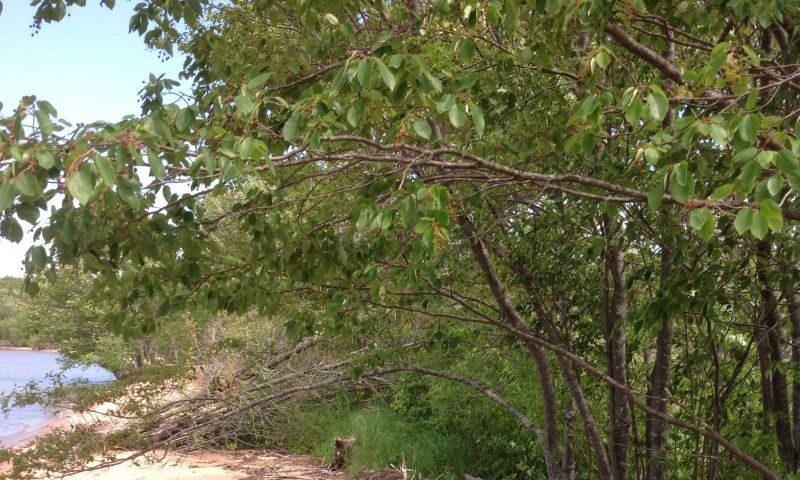
variability.

USFS Subregions: Superior-Ashland Clay Plain Subsection (212Ya); May contain small areas of Ewen Dissected
Lake Plain Subsection (212Jo), Winegar Moraines Subsection (212Jc), Gogebic-Penokee Iron Range Subsection
(212Jb), and NorthShore Highlands Subsection (212Lb)*

Major Land Resource Area (MLRA): Superior Lake Plain (92)

Ecological site concept
Sandy Shore Complex has a small extent in MLRA 92. It occurs on active beach ridges, dunes, and plains along
Lake Superior. The stability of the landform is influenced by weather events and wave action. The soils are
somewhat poorly to excessively drained sands that formed in sand deposited by current, wave, or wind action.
These sites vary in their location in a shore complex; sites can be higher up on a beach dune and therefore are less
subject to wave action, or they can be located on wetter flats. Sources of water are primarily precipitation and waves
from Lake Superior.

Plant communities clearly reflect the inherent instability of this Ecological Site. Most participating species possess
some pioneering characteristics, they tolerate either very wet or very dry soil conditions and, above all, low soil
nutrient availability. The most frequently present woody species include red maple (Acer rubrum), serviceberry,
(Amelanchier spp.) and common juniper (Juniperus communis). In wetter locations speckled alder (Alnus incana),
winterberry (Ilex verticillata) and red osier dogwood (Cornus sericea) are also common. Low shrub and herb layers
typically include bear-berry (Arctostaphylos uva-ursi), blueberry (Vaccinium spp.), wild lily-of-the valley
(Maianthemum canadense) and starflower (Trientalis borealis). Relative abundance of these species may vary
greatly from phase to phase, and depending on location. It also is not uncommon for a species with relatively low
frequency of presence for the Ecological Site (constancy) to have high abundance in any given community.
Temporal abundance of any plant species is influenced by many dynamic environmental and ecological factors.

These sites are distinct from all other ecological sites based on the direct wave action and influence of Lake
Superior.

Table 1. Dominant plant species

Tree           (1) Acer rubrum
Shrub          (1) Amelanchier
               (2) Vaccinium
Herbaceous Not specified

Physiographic features
This site occurs on active wave-influenced dunes and plains located on shore complexes along Lake Superior.
Landform shape can be linear, convex, or concave. Elevation of the landforms range from 185 to 210 meters above
sea level. Slopes are 0 to 12 percent. This site occurs on all slope aspects.

Table 2. Representative physiographic features

Landforms            (1) Till plain > Shore complex
Runoff class         Negligible to low
Elevation            607–689 ft
Slope                0–12%
Water table depth 12–79 in
Aspect               Aspect is not a significant factor

Climatic features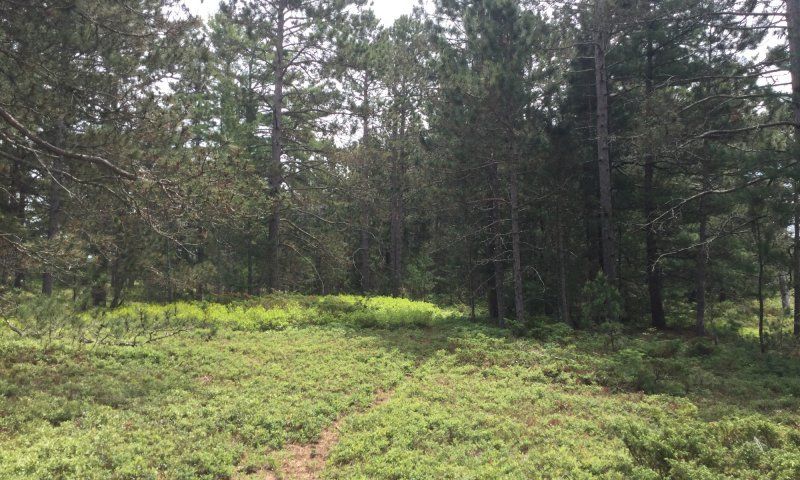
The Sandy Shore Complex occurs on northern Wisconsin’s shore of Lake Superior; therefore, the climate for this
PESD is heavily regulated by Lake Superior. Most of the sites are located on the Apostle Islands off the Bayfield
Peninsula. The annual average precipitation ranges from 29-31 inches; average snowfall ranges from 72-132 inches
(PRISM, 1981-2010). The annual average maximum and minimum temperatures are 51 degrees F and 31 degrees
F, respectively (PRISM, 1981-2010). Being located directly on the lake, the Sandy Shore Complex tends to have a
lower maximum temperature and a higher minimum temperature than some of the PESDs located inland of Lake
Superior. The length of the frost-free period ranges from 159-166 days, with an average of 162 days (Table 2). The
length of the freeze-free period ranges from 185-194 days, with an average of 190 days (Table 2). Sites in this
PESD are potentially subject to other climatic factors—such as wind and waves—than other adjacent PESDs
located just inland off the shore.

Table 3. Representative climatic features

Frost-free period (characteristic range)                  113-114 days
Freeze-free period (characteristic range) 137-138 days
Precipitation total (characteristic range)                32-33 in
Frost-free period (actual range)                          113-114 days
Freeze-free period (actual range)                         137-138 days
Precipitation total (actual range)                        32-33 in
Frost-free period (average)                               114 days
Freeze-free period (average)                              138 days
Precipitation total (average)                             33 in

  5 in      Characteristic range high
            Characteristic range low

  4 in

  3 in

  2 in

  1 in

          Jan    Feb     Mar     Apr    May   Jun   Jul   Aug     Sep   Oct   Nov   Dec

Figure 1. Monthly precipitation range

 80 °F
            Characteristic range high
            Characteristic range low

 60 °F

 40 °F

 20 °F

  0 °F
          Jan    Feb     Mar     Apr    May   Jun   Jul   Aug     Sep   Oct   Nov   Dec

Figure 2. Monthly minimum temperature range
100 °F Characteristic range high
Characteristic range low
80 °F
60 °F
40 °F
20 °F
Jan Feb Mar Apr May Jun Jul Aug Sep Oct Nov Dec
Figure 3. Monthly maximum temperature range
Maximum
100 °F Minimum
80 °F
60 °F
40 °F
20 °F
0 °F
Jan Feb Mar Apr May Jun Jul Aug Sep Oct Nov Dec
Figure 4. Monthly average minimum and maximum temperature
50 in
45 in
40 in
35 in
30 in
25 in
20 in
1980 1985 1990 1995 2000 2005 2010
Figure 5. Annual precipitation pattern
48 °F
46 °F
44 °F
42 °F
40 °F
38 °F
1980 1985 1990 1995 2000 2005 2010
Figure 6. Annual average temperature pattern
Climate stations used
(1) MADELINE ISLAND [USC00474953], La Pointe, WI
(2) BAYFIELD 6 N [USC00470603], Bayfield, WIInfluencing water features
Water is received through precipitation, groundwater discharge, and waves from Lake Superior. Water leaves the
site primarily through ground water recharge and evapotranspiration.
Permeability of the soil ranges from moderate to rapid. Runoff potential is negligible to low. The hydrologic group of
this site is either A or B.
Enough water will percolate into some soil areas that will result in an apparent seasonally high water table
(endosaturation) at a depth of 30 to 76 cm that may occur during any month. Other soil areas will not exhibit any
significant saturation at any depth for any significant period. Water that percolates into the soil is generally lost
through plant uptake and evapotranspiration. There is a high potential for significant ground water recharge.
Soil features
The soils of this site are represented by the Meehan, Wurtsmith, and Grayling soil series. These soils are classified
as Udipsamments. Included in this PESD as well are undescribed/unassigned Udipsamments.
This ecological site is characterized by very deep, somewhat poorly drained to excessively drained sand deposited
by wave current , beach, or wind action. Grayling and Wurtsmith soils occur on Sandy Shore Complex and dunes,
while Meehan soils occur on wetter flats.
The average gravel content within the soil can be as much as 10 percent, while the content of cobbles and stones is
0 percent. Soil reaction (pH) in the upper 100 cm ranges from very strongly acid to moderately acid. Carbonates are
absent within 200 cm.
Table 4. Representative soil features
Parent material (1) Glaciofluvial deposits
(2) Lacustrine deposits
(3) Alluvium
Surface texture (1) Sand
Drainage class Somewhat poorly drained to excessively drained
Permeability class Moderate to rapid
Soil depth 80 in
Available water capacity 2.46–3.33 in
(0-60in)
Soil reaction (1:1 water) 4.5–6
(0-40in)
Ecological dynamics
Because of relative instability of this Ecological Site plant communities are in a constant state of flux. If one could
speak of any successional trends, or a particular species’ ability to persist in these communities, they more strongly
reflect the species’ soil-stabilizing and soil organic matter enrichment properties than any advantage in shade
tolerance, as is most common on stable sites. For these reasons a Reference State Community Phase for this
Ecological Site can be described only in general terms. Equally difficult, if not impossible, is to characterize any
common transition pathways because this concept itself does not apply well to this dynamic community type.
State and transition modelEcosystem states
1. Reference State
State 1 submodel, plant communities
1.1. Maturing 1.2. Rejuvenated
Community Phase 1.1A Community Phase
1.2A
1.2B
1.1B
1.3A
1.3. Dry Community 1.4. Wet Community
Phase 1.3B Phase
1.4A
1.1A - High wave action removes and redeposits relatively thin layers of sand
1.1B - Major wave and ice action disrupts or eliminates existing plant communities
1.2A - Relatively long period without major beach disturbance
1.2B - Major wave and ice action disrupts or eliminates existing plant communities
1.3A - A prolonged period (years) without major wave disturbance of plant communities
1.3B - A period of years of rising water levels.
1.4A - A period of years of dropping water levels.
State 1
Reference State
Because of great spatial and temporal variability of this Ecological Site the reference state can be described only in
general terms. The principal controlling factors are discussed above under the ecological site concept and
ecological dynamics sections. Communities beyond the pioneer stage of development contain woody as well as
herbaceous species. Depending on the frequency and intensity of wave inundation at least four community phases
can be distinguished.
Community 1.1
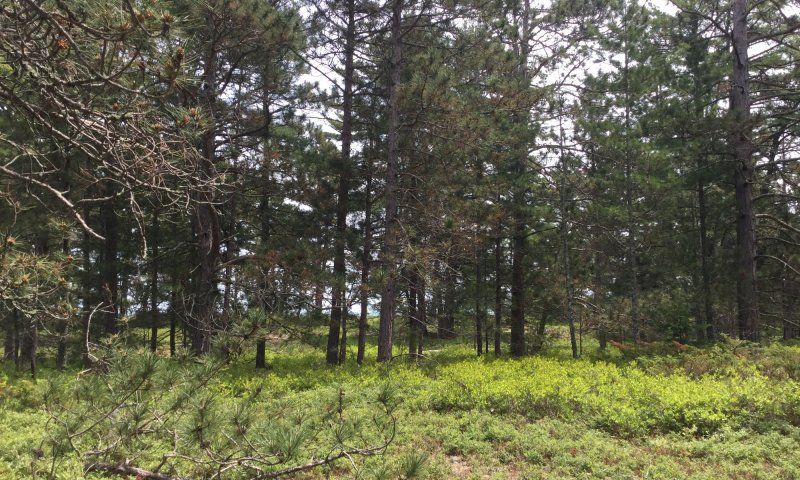
Maturing Community PhaseA community that has escaped major disturbance for several decades may contain relatively large individuals of several tree species, most frequently red maple (Acer rubrum), paper birch (Betula papyriphera), box elder (Acer negundo), balsam fir ( Abies balsamea) or serviceberry (Amelanchier spp.). Shrub species may include raspberries (Rubus spp), chokecherry (Prunus virginiana), blueberries (Vaccinium spp.), bearberry (Arctostophylos uva-ursi) and, on wetter sites, winterberry (Ilex virticillata), red osier dogwood (Cornus sericea) or speckled alder (Alnus incana). The herbaceous layer is best represented by grasses and sedges and a small number of species characteristic of boreal forest e.g., wild lily of the valley (Maianthemum canadense), star flower (Trientalis borealis) and yellow bead-lily (Clintonia borealis). Community 1.2 Rejuvenated Community Phase This community can also be characterized as a maturing community that has been developmentally set back by wave activity that primarily disturbed the ground layer vegetation. Some, typically forest species, have been temporarily set back, while grasses and sedges became relatively more abundant.
Community 1.3
Dry Community Phase
This Community Phase develops on well - to excessively well-drained beach ridges. Most characteristic early
vegetation consists of grasses, sedges, especially Pennsylvania sedge (Carex Pennsyvanica), bearberry
(Arctostaphylos uva-ursi) and wintergreen (Gaultheria procumbens)

Community 1.4
Wet Community Phase
On flatter beach positions and in depressions a distinctly wet to wet-mesic vegetation develops. In addition to many
species of sedges and grasses several woody species readily become established. Most common are speckled
alder (Alnus incana), red osier dogwood (Cornus sericea), sweet gale (Myrica gale) and winterberry (Ilex verticilata).

Pathway 1.1A
Community 1.1 to 1.2

Maturing Community Phase   Rejuvenated Community
                           Phase

Wave action removes and redeposit relatively thin layers of sand, partially disrupting the ground vegetation layer.

Pathway 1.1B
Community 1.1 to 1.3
Major wave and ice action disrupts or eliminates existing plant communities setting up conditions for pioneering
plant communities. Major storms that probably occur only a few times in a century completely eliminate vegetation
closest to shorelines and also impact beach ridges and dunes further inland. Under such conditions plant
community development in the zone within reach of normal wave action, and for some distance beyond, begins
anew. These types of disruptions typically create environments with drastically different water regimes. On the one
hand are high sandy ridges that become excessively drained and, on the other, there are flats, or depressions that
become poorly drained. Because of this, two very different plant community development sequences exist.

Pathway 1.2A
Community 1.2 to 1.1

Rejuvenated Community      Maturing Community Phase
Phase

Wave inundation-free period of several seasons returns community composition to maturing phase.

Pathway 1.2B
Community 1.2 to 1.3
Major wave and ice action disrupts or eliminates existing plant communities setting up conditions for pioneering
plant communities. Major storms that probably occur only a few times in a century completely eliminate vegetation
closest to shorelines and also impact beach ridges and dunes further inland. Under such conditions plant
community development in the zone within reach of normal wave action, and for some distance beyond, begins
anew. These types of disruptions typically create environments with drastically different water regimes. On the one
hand are high sandy ridges that become excessively drained and, on the other, there are flats, or depressions that become poorly drained. Because of this, two very different plant community development sequences exist. Pathway 1.3A Community 1.3 to 1.2 As the Dry phase is allowed to persist woody vegetation will begin to establish itself. As long as no long duration flooding or high wave action occurs to disturb this new woody vegetation Red maple and service berry will become established on the site. Pathway 1.3B Community 1.3 to 1.4 Significant and persistent rise in water table, usually associated with rising lake levels, may transform a dry site into poorly drained one and initiate a corresponding shift in species composition. Pathway 1.4A Community 1.4 to 1.3 Prolonged lowering of lake levels associated with several seasons of low precipitation may sufficiently lower available water in the rooting zone to initiate corresponding shift in species composition. It is not likely that community pathways 2.1A and 2.2A will lead to community phases 2.2 and 2.1 respectively, but changes in species composition would be expected to be in those directions. As a result, formation of intermediate community types should be expected. Additional community tables Other references Cleland, D.T.; Avers, P.E.; McNab, W.H.; Jensen, M.E.; Bailey, R.G., King, T.; Russell, W.E. 1997. National Hierarchical Framework of Ecological Units. Published in, Boyce, M. S.; Haney, A., ed. 1997. Ecosystem Management Applications for Sustainable Forest and Wildlife Resources. Yale University Press, New Haven, CT. pp. 181-200. County Soil Surveys from Douglas, Bayfield, and Ashland Counties. Curtis, J.T. 1959. Vegetation of Wisconsin: an ordination of plant communities. University of Wisconsin Press, Madison. 657 pp. Davis, R.B. 2016. Bogs and Fens, A Guide to the Peatland Plants of Northeastern United States and Adjacent Canada. University Press of New England, Hanover and London. 296 pp. Finley, R. 1976. Original vegetation of Wisconsin. Map compiled from U.S. General Land Office notes. U.S. Forest Service, North Central Forest Experiment Station, St. Paul, Minnesota. Hvizdak, David. Personal knowledge and field experience. Jahnke, J. and Gienccke, A. 2002. MLRA 92 Clay Till Field Investigations. Summary of field day investigations by Region 10 Soil Data Quality Specialists. NatureServe. 2018. International Ecological Classification Satandard: Terrestrial Ecological Classifications. NautreServe Centreal Databases. Arlington, VA. U.S.A. Data current as of 28 August 2018. Kotar, J. 1986. Soil – Habitat Type relationships in Michigan and Wisconsin. J. For. and Water Cons. 41(5): 348- 350. Kotar, J., J.A. Kovach and G. Brand. 1999. Analysis of the 1996 Wisconsin Forest Statistics by Habitat Type.
U.S.D.A. For. Serv. N.C. Res. Stn. Gen. Tech. Rept. NC-207.

Kotar, J., J. A. Kovach, and T. L. Burger. 2002. A Guide to Forest Communities and Habitat Types of Northern
Wisconsin. Second edition. University of Wisconsin-Madison, Department of Forest Ecology and Management,
Madison.

Kotar, J., and T. L. Burger. 2017. Wetland Forest Habitat Type Classification System for Northern Wisconsin: A
Guide for Land Managers and landowners. Wisconsin Department of Natural Resources, PUB-FR-627 2017,
Madison.

Martin, L. 1965. The physical geography of Wisconsin. Third edition. The University of Wisconsin Press, Madison.

McNab, W.H. and P.W. Avers. 1994. Ecological Subregions of the United States: Section Descriptions. USDA For.
Serv. Pun. WO-WSA-5, Washington, D.C.

Radeloff, V.C., D.J. Mladenoff, H.S. He and M.S. Boyce. 1999. Forest landscape change in Northwestern
Wisconsin Pine Barrens from pre-European settlement to the present. Can. J. For. Res. 29: 1649-1659.

Schulte, L.A., and D.J. Mladenoff. 2001. The original U.S. public land sur¬vey records: their use and limitations in
reconstructing pre-European settlement vegetation. Journal of Forestry 99:5–10.

Schulte, L.A., and D.J. Mladenoff. 2005. Severe wind and fire regimes in northern forests: historical variability at the
regional scale. Ecology 86(2):431–445.

Soil Survey Staff. Input based on personal experience. Tim Miland, Scott Eversoll, Ryan Bevernitz, and Jason
Nemecek.

Stearns, F. W. 1949. Ninety years change in a northern hardwood forest in Wisconsin. Ecology, 30: 350-58.

United States Department of Agriculture, Forest Service. 1989. Proceedings – Land Classification Based on
Vegetation: Applications for Management. Gen. Tech. Report INT-527.

United States Department of Agriculture, Forest Service. 1990. Silvics of North America, Vol. 1, Hardwoods.
Agricultural Handbook 654, Washington, D.C.

United States Department of Agriculture, Forest Service. 1990. Silvics of North America, Vol. 2, Conifers.
Agricultural Handbook 654, Washington, D.C.

United States Department of Agriculture, Natural Resources Conservation Service. 2006. Land Resource and Major
Land Resource Areas of the United Sates, the Caribbean, and the Pacific Basin. U.S. Department of Agriculture
Handbook 296.

United States Department of Agriculture, Natural Resources Conservation Service. 2008. Hydrogeomorphic
Wetland Classification System: An Overview and Modification to Better Meet the Needs of the Natural Resources
Conservation Service. Technical Note No. 190-8-76. Washington D.C.

Wilde, S.A. 1933. The relation of soil and forest vegetation of the Lake States Region. Ecology 14: 94-105.

Wilde, S.A. 1976. Woodlands of Wisconsin. University of Wisconsin Cooperative Extension, Pub. G2780, 150 pp.

Wisconsin Department of Natural Resources. 2015. The ecological landscapes of Wisconsin: An assessment of
ecological resources and a guide to planning sustainable management. Wisconsin Department of Natural
Resources, PUB-SS-1131 2015, Madison.

Contributors
Jacob Prater, Associate Professor at University of Wisconsin Stevens Point
John Kotar, Ecological Specialist, independent contract,
Bryant Scharenbroch, Assistant Professor at University of Wisconsin Stevens Point

Approval
Chris Tecklenburg, 4/08/2020

Acknowledgments
Contact for Lead Authors: Jacob Prater (jprater@uwsp.edu) Associate Professor at University of Wisconsin Stevens
Point, John Kotar (jkotar@wsic.edu) Ecological Specialist, independent contract, and Bryant Scharenbroch
Assistant Professor at University of Wisconsin Stevens Point

Rangeland health reference sheet
Interpreting Indicators of Rangeland Health is a qualitative assessment protocol used to determine ecosystem
condition based on benchmark characteristics described in the Reference Sheet. A suite of 17 (or more) indicators
are typically considered in an assessment. The ecological site(s) representative of an assessment location must be
known prior to applying the protocol and must be verified based on soils and climate. Current plant community
cannot be used to identify the ecological site.

Author(s)/participant(s)
Contact for lead author
Date                                        04/08/2020
Approved by                                 Chris Tecklenburg
Approval date
Composition (Indicators 10 and 12) based on Annual Production

Indicators

1. Number and extent of rills:

2. Presence of water flow patterns:

3. Number and height of erosional pedestals or terracettes:

4. Bare ground from Ecological Site Description or other studies (rock, litter, lichen, moss, plant canopy are not
   bare ground):

5. Number of gullies and erosion associated with gullies:

6. Extent of wind scoured, blowouts and/or depositional areas:

7. Amount of litter movement (describe size and distance expected to travel):
8. Soil surface (top few mm) resistance to erosion (stability values are averages - most sites will show a range of
    values):

 9. Soil surface structure and SOM content (include type of structure and A-horizon color and thickness):

10. Effect of community phase composition (relative proportion of different functional groups) and spatial
    distribution on infiltration and runoff:

11. Presence and thickness of compaction layer (usually none; describe soil profile features which may be
    mistaken for compaction on this site):

12. Functional/Structural Groups (list in order of descending dominance by above-ground annual-production or live
    foliar cover using symbols: >>, >, = to indicate much greater than, greater than, and equal to):

    Dominant:

    Sub-dominant:

    Other:

    Additional:

13. Amount of plant mortality and decadence (include which functional groups are expected to show mortality or
    decadence):

14. Average percent litter cover (%) and depth ( in):

15. Expected annual annual-production (this is TOTAL above-ground annual-production, not just forage annual-
    production):

16. Potential invasive (including noxious) species (native and non-native). List species which BOTH characterize
    degraded states and have the potential to become a dominant or co-dominant species on the ecological site if
    their future establishment and growth is not actively controlled by management interventions. Species that
    become dominant for only one to several years (e.g., short-term response to drought or wildfire) are not
    invasive plants. Note that unlike other indicators, we are describing what is NOT expected in the reference state
    for the ecological site:

17. Perennial plant reproductive capability:
You can also read