Economic activity and social change in the UK, real-time indicators: 7 April 2022
←
→
Page content transcription
If your browser does not render page correctly, please read the page content below
Statistical bulletin

Economic activity and social change in the
UK, real-time indicators: 7 April 2022
Early experimental data and analysis on economic activity and social change in the UK.
These faster indicators are created using rapid response surveys, novel data sources,
and experimental methods.

Contact:                            Release date:                       Next release:
Emelia D’Silva-Parker               7 April 2022                        14 April 2022
faster.indicators@ons.gov.uk
+44 1633 455120

                                    Notice
7 April 2022
This publication of retail footfall data will be the last release for the foreseeable future. The associated charts and
commentary in previous bulletins will remain available. We apologise for any inconvenience this may cause.

                                                                                                                   Page 1 of 20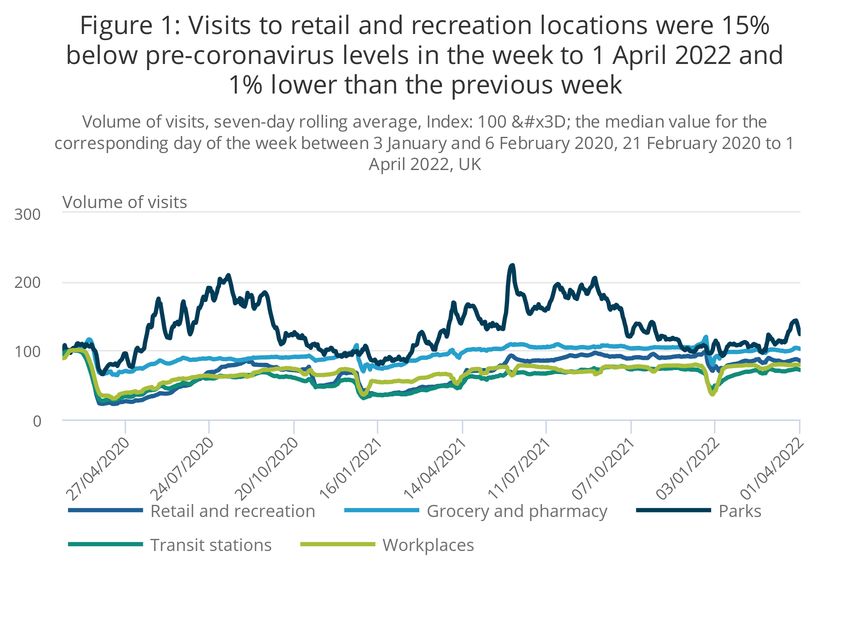
Table of contents
1. Main points

2. Latest indicators at a glance

3. Consumer behaviour

4. Business and workforce

5. Transport

6. Data

7. Glossary

8. Measuring the data

9. Strengths and limitations

10. Related Links

                                   Page 2 of 20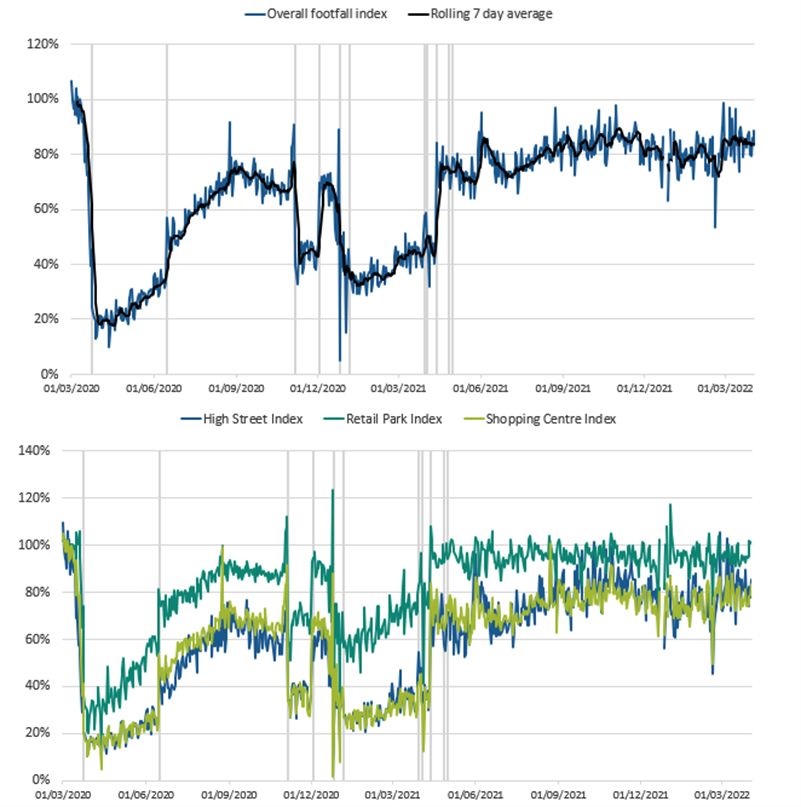
1 . Main points

      Both UK spending on credit and debit cards, and OpenTable UK seated diners, increased by 6 percentage
      points in the latest week; meanwhile, visits to retail stores and recreation areas were 15% below pre-
      coronavirus (COVID-19) levels and 1% lower than the previous week according to Google Mobility data.
      Section 3.

      In the latest week, there were increases in 16 of the 28 online job advert categories, with the largest
      weekly increase in “travel and tourism” (11%). Section 4.

      In March 2022, the seasonally adjusted number of new Value Added Tax (VAT) reporters was 12% lower
      than the previous month and 18% lower than reported in March 2021. Section 4.

      The top two concerns reported by businesses continued to be input price inflation (23%) and energy prices
      (20%); concerns about energy prices saw the largest rise of all concerns, from 15% in late February 2022
      to 20% in late March 2022 (final results from Wave 53 of the Business Insights and Conditions Survey
      (BICS)).

      While the volume of all ship visits and road traffic showed week-on-week decreases of 10% and 4
      percentage points, respectively, daily UK flights increased by 19% in the latest week, to the highest level
      compared with the pre-coronavirus equivalent week. Section 5.

      The System Average Price (SAP) of gas increased by 17% in the week to 3 April 2022, with the level now
      58% of that on 10 March 2022, when prices peaked in the rolling seven-day series; the SAP is 444%
      higher compared with the same period last year (week ending 4 April 2021).

Results presented in this bulletin are experimental and may be subject to revision. Data sources used to compile
these indicators are regularly reviewed to ensure representativity and relevance, which may mean indicators
change at short notice.

2 . Latest indicators at a glance

Notes:

   1. The break in the available shipping data (from 14 to 19 June 2021) is when the data collection system
      changed.

   2. OpenTable seated diners weekly comparisons were previously made with the seven-day period to each
      Monday. From the previous week’s release (31 March 2022) the weekly comparison period has changed to
      the seven-day period to each Sunday.

   3. Adzuna online job adverts in the previous period are compared from 21 March 2022 to 25 March 2022.
      Caution is advised when comparing these data as this is not the Friday-to-Friday comparison period
      historically used.

3 . Consumer behaviour

Consumer activity across the UK showed a mixed picture in the most recent week, with a 6 percentage point
increase in both credit and debit card purchases and OpenTable seated diners. Meanwhile Pret A Manger
transactions fell at most locations in part because of adverse weather conditions. Springboard’s retail footfall
decreased by 8% from the previous week, while Google Mobility data show a slight decrease (1%) in retail and
recreation visits, and were 15% below pre-coronavirus (COVID-19) levels.

                                                                                                                Page 3 of 20
Mobility
Google Mobility data provide an indicator of changes in the volume of visits to different location types compared
with a pre-coronavirus baseline.
Visits are calculated based on publicly available anonymised data from Google users in the UK who have opted
into Location History for their Google account, so are based on a subset of users. Full details of Google’s methods
used to compile the data are available.
We have transformed the publicly available anonymised data into an indexed seven-day moving average to
smooth the weekday and weekend.
We have used data for the following location types:
Page 4 of 20Grocery and pharmacy: grocery stores, supermarkets, farmers’ markets, specialty food shops and
pharmacies
Parks: parks, public beaches, marinas, public gardens and other public open spaces
Transit stations: public transport hubs such as train, light rail, tram and bus stations
Retail and recreation: restaurants, cafes, shopping centres, theme parks, museums, libraries, theatres and
cinemas
Workplaces: places of work
Figure 1: Visits to retail and recreation locations were 15% below pre-coronavirus levels in the week to 1
April 2022 and 1% lower than the previous week
Volume of visits, seven-day rolling average, Index: 100 = the median value for the corresponding day of the week between 3
January and 6 February 2020, 21 February 2020 to 1 April 2022, UK
Source: Google LLC "Google COVID-19 Community Mobility Reports" https://www.google.com/covid19/mobility/ Accessed: 5
April 2022.
Notes:
1. These data have not been seasonally adjusted. Users should consider seasonal events, such as the
weather and holiday periods, that may impact movements in the data.
Visits to retail and recreation locations have not yet returned to pre-coronavirus levels and remain below pre-
Omicron variant levels. There has been a slow upward trend in visits to workspaces since the low of April 2020,
but these are still 21% below pre-coronavirus levels. Visits to transit stations have been the slowest to recover
and are still 28% below pre-coronavirus levels.
Visits to each location type in the week to 1 April 2022 compared with the previous week:
Page 5 of 20parks decreased by 12%
no change in transit stations
grocery and pharmacy increased by 1%
retail and recreation decreased by 1%
workplaces increased by 1%
The full data time series can be found in our accompanying Visits to location types using Google Mobility dataset.
These are experimental indicators, which we are working to develop further. However, further geographical
breakdowns of the Google Mobility data are available.
National retail footfall
National retail footfall figures are supplied by Springboard, a provider of data on customer activity. They measure
the following for overall UK retail footfall, as well as by high street, retail park and shopping centre categories:
Page 6 of 20daily retail footfall as a percentage of its level on the same day of the equivalent week of 2019; for
example, Saturday 2 April 2022 is compared with Saturday 30 March 2019
total weekly retail footfall as a percentage of its level in the equivalent week of 2019
the percentage change in weekly footfall compared with the previous week; for example, Week 13 of 2022
is compared with Week 12 of 2022
Springboard’s weekly data are defined over a seven-day period running from Sunday to Saturday. Week 13 of
2022 therefore refers to the period Sunday 27 March to Saturday 2 April 2022.
Because of data offsets between 2021 and previous years, footfall data from Springboard for the following days
have been omitted: 22 to 23 December 2021, 25 to 26 December 2021, 29 December 2021 and 1 January 2022.
Users should note that all quoted figures have been rounded to the nearest integer.
Page 7 of 20Figure 2: Overall weekly retail footfall in the UK decreased by 9% in the latest week and was 84% of the
level seen in the equivalent week of 2019
Volume of daily retail footfall, percentage compared with the equivalent day of the equivalent week of 2019, 1 March 2020 to 2
April 2022, UK
Source: Springboard, Department for Business, Energy and Industrial Strategy
Notes:
1. The vertical lines indicate notable events and coronavirus restriction changes.
2. Users should note that week-on-week changes in retail footfall volumes are outlined as percentages, rather
than as percentage point changes. Percentage change figures quoted in the commentary will therefore not
necessarily match the percentage point changes observed in the chart.
The volume of overall weekly retail footfall in the UK in the week to 2 April 2022:
Page 8 of 20in high streets decreased by 13% from the previous week and was 81% of the level seen in the equivalent
week of 2019
in shopping centres decreased by 6% from the previous week and was 79% of the level seen in the
equivalent week of 2019
in retail parks decreased by 2% from the previous week and was 98% of the level seen in the equivalent
week of 2019
Figure 3: The South West had the highest weekly levels of retail footfall in the week to 2 April 2022,
compared with the equivalent week of 2019, at 90%
Volume of daily retail footfall, percentage of the level recorded on the same day of the equivalent week of 2019, seven-day
rolling average, UK countries and English regions, 1 March 2020 to 2 April 2022
Source: Springboard, Department for Business, Energy and Industrial Strategy
Retail footfall saw week-on-week percentage decreases in all of the 10 UK countries and English regions in the
week to 2 April 2022. The largest of these were in the East of England, East Midlands, Northern Ireland, and the
North and Yorkshire, all falling by 10% over the week.
In the same period, relative to the levels seen in the equivalent week of 2019, retail footfall was strongest in the
South West of England and Greater London, at 90% and 86%, respectively. In contrast, retail footfall was
weakest in East Midlands and the East of England, at 81% and 83% of the levels seen in the equivalent week of
2019, respectively.
UK spending on debit and credit cards: daily CHAPS-based indicator
These data series are experimental faster indicators for estimating UK spending on credit and debit cards. They
track the daily CHAPS payments made by credit and debit card payment processors to around 100 major UK
retail corporates. These payments are the proceeds of recent credit and debit card transactions made by
customers at their stores, both via physical and via online platforms.More information on the indicator is provided
in the accompanying CHAPS methodology article.
Companies are allocated to one of four categories based on their primary business:
Page 9 of 20Page 10 of 20
“staples” refers to companies that sell essential goods that households need to purchase, such as food and
utilities
“work-related” refers to companies providing public transport or selling petrol
“delayable” refers to companies selling goods whose purchase could be delayed, such as clothing or
furnishings
“social” refers to spending on travel and eating out
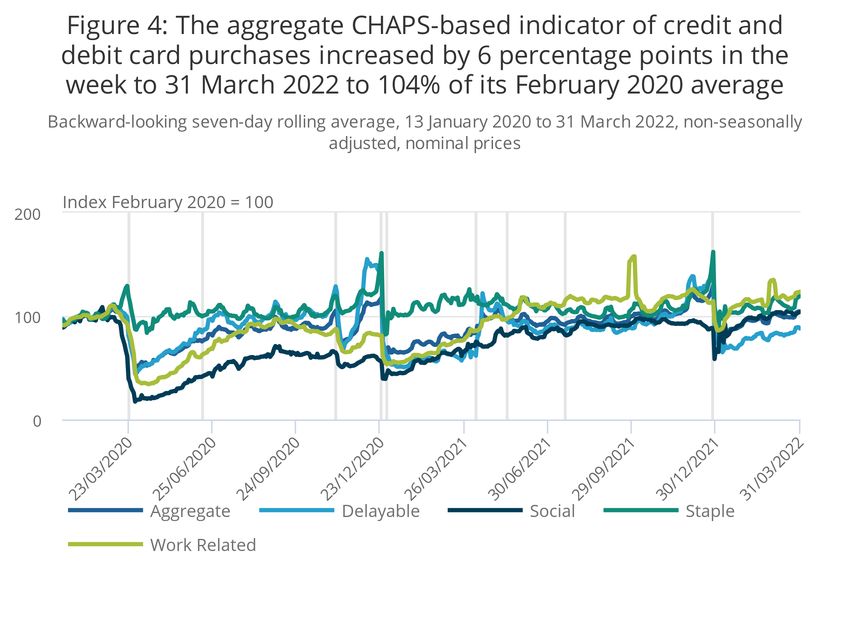
Figure 4: The aggregate CHAPS-based indicator of credit and debit card purchases increased by 6
percentage points in the week to 31 March 2022 to 104% of its February 2020 average
Backward-looking seven-day rolling average, 13 January 2020 to 31 March 2022, non-seasonally adjusted, nominal prices
Source: Office for National Statistics and Bank of England calculations
Notes:
1. Users should note the daily payment data is the sum of card transactions processed up to the previous
working day, so there is a slight time lag when compared with real-life events on the chart.
2. The vertical lines indicate notable events and coronavirus (COVID-19) restriction changes.
3. Percentage point difference is derived from current week and previous week index before rounding.
Figure 4 shows changes in the value of CHAPS payments received by large UK corporates from their credit and
debit card processors, “merchant acquirers”.
In the week to 31 March 2022, the aggregate CHAPS-based indicator of credit and debit card purchases
increased by 6 percentage points from the previous week, to 104% of its February 2020 average level.
Page 11 of 20The spending categories recorded the following changes in the latest week:
“social” increased by 3 percentage points
“delayable” increased by 4 percentage points
“work-related” increased by 5 percentage points
“staple” increased by 12 percentage points, this may in part be due to seasonality
“Work-related”, “staple” and “social” spending were above their February 2020 average levels at 123%, 119% and
104%, respectively. “Delayable” spending meanwhile was below its February 2020 average level at 88%.
UK spending on debit and credit cards: Monthly CHAPS-based indicator
The monthly CHAPS-based indicator of aggregate credit and debit card spending was at 101% of its February
2020 average level in March 2022. This is 5 percentage points higher than in January 2022 (96%) and 20
percentage points higher than March 2021 (81%).
The monthly data time series is available in the accompanying CHAPS dataset and includes methodological notes
that users should bear in mind. The monthly CHAPS index is calculated by the Office for National Statistics
(ONS), rather than being an additional series that is produced and validated by the Bank of England.
4 . Business and workforce
The total volume of online job adverts on 1 April 2022 was broadly unchanged from the previous week, though
there were increases in 16 of the 28 online job advert categories. The largest of these was an 11% increase in
“travel and tourism”.
Small business sales recorded by Xero were up by 4 percentage points from January 2020, while small business
jobs decreased by 4 percentage points. The seasonally adjusted number of new Value Added Tax (VAT)
reporters decreased by 12% in March 2022 compared with the previous month.
Self-isolation rates in the workforce by sector and for working age population
by country
Data from the Coronavirus (COVID-19) Infection Survey (CIS) were used to provide modelled estimates of the
proportion of the workforce self-isolating because of coronavirus, by work sector; and the proportion of the
working age population self-isolating because of coronavirus, by country.
The percentage of people self-isolating because of coronavirus remained stable in the week ending 26 March
2022. This follows an increase in self-isolation across all work sectors except the “food production, agriculture
and farming” work sector in the two weeks ending 19 March 2022.
Figure 5: The percentage of the working-age population self-isolating because of
coronavirus increased in England in the week ending 26 March 2022
Estimated percentage of the working-age population (aged 17 to 69 years) self-isolating because of
coronavirus (COVID-19) from 6 February to 26 March 2022, UK countries
Notes:
Page 12 of 201. All results are provisional and subject to revision.
2. These statistics refer to self-reported self-isolation occurring in working-age adults (aged 17 to 69 years),
regardless of employment status, living in private households.
3. During the period shown, self-isolation requirements were frequently updated with different changes taking
place at different times across the UK countries.
Download the data
.xlsx
Figure 6: The sectors with the highest percentage of the workforce in self-isolation on 26
March 2022 were “health care” and “teaching and education”, both at 3.8%
Estimated percentage of the workforce self-isolating because of coronavirus (COVID-19), by work sector, 30
January 2022 to 26 March 2022, UK
Notes:
1. All results are provisional and subject to revision.
2. These statistics refer to self-reported self-isolation in working adults (aged 16 years and over) living in
private households.
3. In the “health care” work sector, there is a 95% confidence interval from 3.0% to 4.7%.
4. In the “teaching and education” work sector, there is a 95% confidence interval from 3.0% to 4.7%.
Download the data
.xlsx
More information on how these estimates were calculated is available in Coronavirus (COVID-19) Infection
Survey estimates of the UK workforce in self-isolation by sector, published on 14 February 2022.
A breakdown of the CIS data is available in our accompanying estimates of the UK workforce in self-isolation
dataset.
Online job adverts by category
These figures are experimental estimates of online job adverts provided by Adzuna, an online job search engine,
by category and by UK country and English region. The number of job adverts over time is an indicator of the
demand for labour. The Adzuna categories used do not correspond to Standard Industrial Classification (SIC)
categories, so these values are not directly comparable with the Office for National Statistics’ (ONS) Vacancy
Survey.
Figure 7: The total volume of online job adverts on 1 April 2022 increased by 1% from the
previous week, and was 137% of its February 2020 pre-coronavirus average level
Volume of online job adverts by category, index: 100 = February 2020 average, 4 January 2019 to 1 April 2022,
non-seasonally adjusted
Notes:
Page 13 of 201. Further category breakdowns are included in the Online job advert estimates dataset and more details on
the methodology can be found in Using Adzuna data to derive an indicator of weekly vacancies.
2. Users should note that week-on-week changes in online job advert volumes are outlined as percentages,
rather than as percentage point changes. Percentage change figures quoted in the commentary will
therefore not necessarily match the percentage point changes observed in the charts and accompanying
dataset.
3. Because of data collection issues, recent comparisons have alternated between Friday-to-Friday and
Monday-to-Monday comparisons. Caution is advised when comparing data between 4 and 25 March 2022
for this reason. We have now reverted back to the usual Friday comparisons.
Download the data
.xlsx
Of the 28 categories, 16 saw an increase in the number of online job adverts on Friday 1 April 2022. The largest
increase was in “travel and tourism” (11%), followed by “energy, oil and gas” and “catering and hospitality”, which
both increased by 9%. The number of online job adverts remained unchanged in five categories, and decreased
in seven categories, the largest decrease being in the “charity and voluntary” category, where it fell by 9%.
The categories with the highest level of online job adverts when compared with their February 2020 pre-
coronavirus average levels were “HR and recruitment” at 252%, followed by “transport, logistics and warehouse”
at 248%.
The latest five weeks of data for the regional breakdown of Adzuna online job adverts are now available, which
include a revision to the entire regional backseries following a methods update. This is available within our
accompanying online job advertisements dataset.
Page 14 of 20Value Added Tax returns
New reporters
The new reporters index measures the number of firms sending Value Added Tax (VAT) returns for the first time,
which is related to the number of firm creations.
Figure 8: The seasonally adjusted number of new VAT reporters in March 2022 was 20,920; this was 12%
lower than February 2022 (23,820)
Number of new firm reporters, January 2015 to March 2022, seasonally adjusted and non-seasonally adjusted, UK
Source: Her Majesty’s Revenue and Customs (HMRC)
In the services industry, there were 16,250 new VAT reporters in March 2022, a 13% decrease from the 18,740
reported in February 2022. This latest figure is 27% lower than reported in March 2021.
The number of new reporters in the production industries increased by 9% compared with the previous month,
while the number of new reporters in construction industries fell by 7% over the same period. The number of new
VAT reporters in the production and construction industries were 110% and 126% of their March 2021 levels,
respectively.
The figures explained in this section refer to seasonally adjusted data. Non-seasonally adjusted data are
available in our accompanying Value Added Tax dataset.
Page 15 of 20Business turnover estimates
Turnover diffusion indices are an aggregate measure used to track whether most firms are reporting an increase
or decrease in turnover in their VAT returns. They are calculated as the percentage of firms with increasing
turnover minus the percentage with decreasing turnover.
The heatmap in Figure 9 is a visual way of showing the VAT diffusion indices based on the standard deviation
from their historical 2008 to 2019 average. Larger deviations are more darkly coloured, with red representing a
negative change, while teal represents a positive change when compared with the previous period.
Figure 9: A net 5% of firms reported increased month-on-month turnover in February 2022
Heatmap of business turnover estimates, UK, diffusion index standard deviation from the mean, up to February
2022, new reporters, UK, up to March 2022
Notes:
1. Agri - Agriculture, forestry and fishing, All - All industries, SA - Seasonally adjusted.
2. More information is available in the methodology article
Download the data
.xlsx
The all-industry turnover estimate for February 2022 shows that in the past month, more firms had reported
increasing rather than decreasing turnover (net 5%).
A net 10% of firms in the production industry reported increasing turnover in February 2022, the highest net figure
since February 2021 (13%).
A net 6% and 4% of firms in the services and agricultural industries, respectively, reported increasing turnover in
February 2022. In the construction industry, a net 1% of firms reported increasing turnover in the last month.
The figures explained in this section refer to seasonally adjusted data. Non-seasonally adjusted data are
available in our accompanying Value Added Tax dataset.
5 . Transport
The transport indicators showed a mixed picture, with 10% decreases in both all ships and cargo ships, as well
as a 4 percentage point decrease in road traffic. In comparison UK daily flights increase by 19% in the week to 3
April 2022, coinciding with the start of Easter holiday period.
Page 16 of 20UK flight data
These data are daily flight figures from the European Organisation for the Safety of Air Navigation
(EUROCONTROL). Daily flight numbers for the UK alongside other countries are available in EUROCONTROL's
dashboard. EUROCONTROL is a pan-European, civil-military organisation dedicated to supporting European
aviation. Its Aviation Intelligence and Performance Review Unit provides independent collection and validation of
air navigation services performance-related data and intelligence gathering.
The flights data include international arrivals and departures to and from the UK (including Crown dependencies)
and domestic UK flights but exclude overflights (flights that pass over UK territory). They capture all flight
movements that operate under Instrument Flight Rules (IFR), where the pilot uses instruments in the flight deck
to control, guide and adjust the plane. This includes commercial flights carrying passengers and cargo as well as
non-commercial flights such as private and military flights.
Data from EUROCONTROL do not include information on the volume of passengers or cargo carried on UK
flights. Especially in the context of the coronavirus (COVID-19) pandemic, flights might not be operating at full
capacity and therefore trends in passengers and cargo will differ from trends in flights presented here.
Figure 10: The seven-day average number of UK daily flights was 4,588 in the week to 3 April 2022, the
highest level since the beginning of the coronavirus pandemic
Number of daily flights, non-seasonally adjusted, seven-day moving average, 2 January 2019 to 3 April 2022, UK
Source: European Organisation for the Safety of Air Navigation (EUROCONTROL)
The seven-day average number of UK daily flights increased for the ninth consecutive week in the week to 3 April
2022 and was 85% of the level seen in the equivalent week of 2019. Caution should be used when interpreting
this figure though as the latest period includes the beginning of the 2022 Easter Holidays, while the 2019
comparison does not.
The full data time series available for UK flights can be found in our accompanying UK daily flights dataset, which
contains daily flight numbers and the rolling seven-day averages.
Page 17 of 206 . Data
Advance potential redundancies
Dataset | Released 7 April 2022
Weekly dataset showing the number of potential redundancies and employers proposing redundancies,
submitted to Insolvency Service via HR1 forms.
Traffic camera activity
Dataset | Released 7 April 2022
Experimental daily traffic camera counts data for busyness indices covering the UK.
System Average Price (SAP) of gas
Dataset | Released 7 April 2022
Daily and rolling average System Average Price (SAP) of gas traded in the UK.
Weekly shipping indicators
Dataset | Released 7 April 2022
Experimental weekly and daily ship visits dataset covering UK ports.
Transactions at Pret A Manger
Dataset | Released 7 April 2022
Weekly transactional data from approximately 400 Pret A Manger stores around the UK.
Value Added Tax (VAT)
Dataset | Released 7 April 2022
Value Added Tax (VAT) turnover and expenditure diffusion indexes and new VAT reporters using data from
HM Revenue and Customs (HMRC) VAT returns.
Users should note that this section lists a selection of the data available with this publication. For the full list of
available datasets please see the accompanying dataset page.
7 . Glossary
Faster indicator
A faster indicator provides insights into economic activity using close-to-real-time big data, administrative data
sources, rapid response surveys or Experimental Statistics, which represent useful economic and social
concepts.
Diffusion index
The diffusion index tracks the growth in turnover and expenditure of firms. It is constructed to lie between
negative 1 and 1. For example, if 65% of firms have increasing turnover, 30% have decreasing turnover and 5%
turnover remains unchanged, then the diffusion index is 0.35.
New reporter
A new reporter is defined as a firm with a Value Added Tax (VAT) reference (that is, firm identification number),
which has not previously reported its VAT returns. New reporters are published within one month of the end of
the reporting period. The new reporting behaviour measure is classified by the month the data were received by
HM Revenue and Customs (HMRC), known as the receipt date; this is not necessarily the same as the reference
period (the period for which the VAT return is made).
Page 18 of 208 . Measuring the data
Information on the methodology used to produce the indicators in this bulletin is available in the Economic activity
and social change in the UK, real-time indicators methodology.
9 . Strengths and limitations
These statistics have been produced to provide timely indicators of the effect of developing world events on the
UK economy and society, using close-to-real-time big data, administrative data sources, rapid response surveys
or Experimental Statistics.
The data presented in this bulletin are reviewed and refreshed on a regular basis. Indicators are swapped in and
out of the publication based on their suitability and availability.
UK coronavirus (COVID-19) restrictions
A full overview of coronavirus restrictions for each of the four UK constituent countries can be found:
England
Scotland
Wales
Northern Ireland
These restrictions should be considered when interpreting the data featured throughout this bulletin.
Seasonality
Seasonal fluctuations are likely to be present in many of these indicators so caution must be applied when
interpreting changes in series that are not seasonally adjusted.
10 . Related Links
Coronavirus (COVID-19) latest data and analysis
Webpage | Updated as and when data become available
Latest data on the coronavirus in the UK and its effect on the economy and society.
Coronavirus and the social impacts on Great Britain
Bulletin | Released 1 April 2022
Latest indicators from the Opinions and Lifestyle Survey.
Deaths registered weekly in England and Wales, provisional
Bulletin | Released 5 April 2022
Provisional counts of deaths registered in England and Wales, including deaths involving COVID-19, in the
latest weeks for which data are available.
Coronavirus (COVID-19) Infection Survey, UK
Bulletin | Released 1 April 2022
Initial data from the COVID-19 Infection Survey (delivered in partnership with IQVIA, the University of Oxford
and Lighthouse laboratories).
Page 19 of 20Page 20 of 20
You can also read


