Economic and Fiscal Impact - MOTION PICTURE PRODUCTION TAX CREDIT, 2019-2020 - Louisiana Entertainment
←
→
Page content transcription
If your browser does not render page correctly, please read the page content below
SUBMITTED TO:

                                 Louisiana Entertainment
                                 617 North Third Street, PO Box 94185
                                 Baton Rouge, LA 70802

Economic and Fiscal Impact
MOTION PICTURE PRODUCTION TAX
CREDIT, 2019-2020
            Louisiana Entertainment

                                                  MARCH 2021

                                      PREPARED BY:

                                      120 West Avenue, Suite 303
                                      Saratoga Springs, NY 12866
                                      518.899.2608
                                      www.camoinassociates.com
ABOUT CAMOIN 310
Camoin 310 has provided economic development consulting services to
municipalities, economic development agencies, and private enterprises since
1999. Through the services offered, Camoin 310 has served EDOs and local and
state governments from Maine to California; corporations and organizations that
include Amazon, Lowes Home Improvement, FedEx, Volvo (Nova Bus) and the New
York Islanders; as well as private developers proposing projects in excess of $6
billion. Our reputation for detailed, place-specific, and accurate analysis has led to
over 1,000 projects in 40 states and garnered attention from national media outlets
including Marketplace (NPR), Crain’s New York Business, Forbes magazine, The
New York Times, and The Wall Street Journal. Additionally, our marketing strategies
have helped our clients gain both national and local media coverage for their
projects in order to build public support and leverage additional funding. We are
based in Saratoga Springs, NY, with regional offices in Richmond, VA; Portland, ME;
Boston, MA; and Brattleboro, VT. To learn more about our experience and projects
in all of our service lines, please visit our website at www.camoinassociates.com.
You can also find us on Twitter @camoinassociate and on Facebook.

THE PROJECT TEAM

Rachel Selsky
Project Principal

Jessica Tagliafierro
Project Analyst

ECONOMIC IMPACT
                                             OF THE MOTION PICTURE PRODUCTION

                                      TA X                                   C R E D I T
                               Louisiana’s Motion Picture Production Tax Credit has been instrumental in the
                               development of a self-supporting motion picture production industry by
                               encouraging job creation and investment within the state of Louisiana.

                               The report includes expenditures certified in 2019 and 2020, of which the actual spending likely occurred
                               in a previous year, and quantifies the economic and fiscal impacts of the motion picture production tax
                               credit program on the state.

TOTAL CERTIFIED                                  ANNUAL ECONOMIC ACTIVITY
   SPENDING                                             GENERATED
$538,472,660
                $429,591,440

                                   2019                  10,064              $358,117,028                  $1,016,539,310
                                                          JOBS                    EARNINGS                           SALES

                                  2020                    9,636              $338,399,538                    $813,187,241
   2019           2020
                                                          JOBS                    EARNINGS                           SALES

                                    TOTAL TAX REVENUE                                 ADDITIONAL EARNINGS
TOTAL CERTIFIED                         GENERATED                                       FOR LOUISIANA’S
    CREDITS                                                                                RESIDENTS

$175,781,104
               $132,804,928

                                                                                   For every one dollar of credits certified,
                                                                                          there was an additional:

                                        2019                     2020                         2019                 2020
                                 $53,034,429                 $46,324,029                      $2.04                 $2.55
                                                                                              in earnings in the state.
   2019           2020

                                                                                                    2021 Camoin Associates, Inc.
                                                                                                     www.camoinassociates.com
Source: Louisiana Economic Development

CONTENTS
Introduction .................................................................................................................................................. 1

Economic Impact Analysis....................................................................................................................... 4

Fiscal Impact Analysis ............................................................................................................................... 5

This page intentionally left blank.
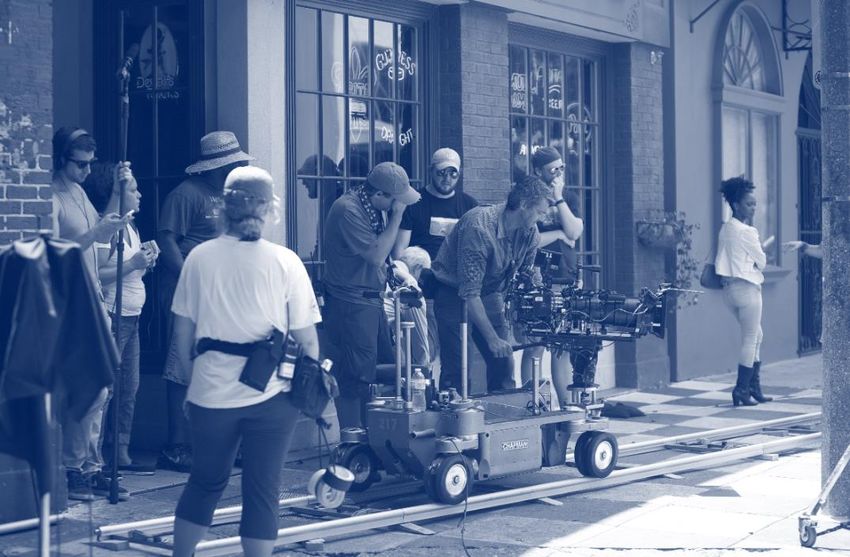
TOC Photo:
1) Change photo to represent RFP/Q
geography or subject matter.
2) Change color: Picture tools ->color -
> recolor, choose dark blue.
3) Size approximatley 2.3” x 5”
4) Keep page after TOC blank.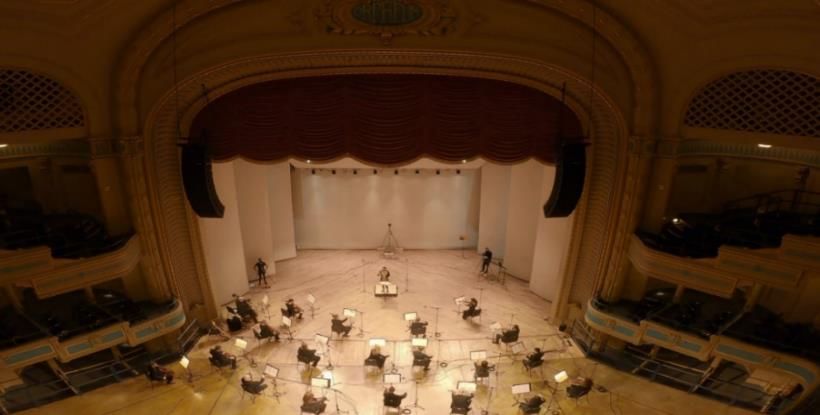
MOTION PICTURE PRODUCTION TAX CREDIT ECONOMIC AND FISCAL IMPACT ANALYSIS

INTRODUCTION
The purpose of this report is to quantify the economic and fiscal impacts generated by the Motion Picture
Production Tax Credit administered by the Office of Entertainment Industry Development (OEID) within the
Louisiana Department of Economic Development (LED).

As required by LA R.S. 47:6007(D)(6), LED provisions a biennial review of the economic and fiscal impacts of these
credits and has retained Camoin 310 to complete this review for the 2019 and 2020 calendar years.

The goal of the Louisiana motion picture production tax credit program is to encourage investment and job creation
within Louisiana. The purpose of this analysis is to calculate the impact of the tax credit program on the state’s
economy.

HISTORY OF THE LOUISIANA MOTION PICTURE PRODUCTION TAX CREDIT
The Louisiana motion picture production tax Figure 1
credit was first implemented in 1992 and
expanded ten years later to further facilitate
the development of a self-supporting motion
picture production industry. As noted in
Camoin 310’s 2019 report, Economic and Fiscal
Impact of Louisiana Entertainment Tax Credits,
recent changes to the program have been
made. Legislative changes made in 2017
enhanced the program by providing
predictability to those applying for credits
regarding how much they will be able to
access each year. Today, the maximum
amount of credits that can be issued by LED in
a fiscal year is capped at $150 million. There is Figure 2
also a $180 million cap on the amount of
credits that can be claimed or redeemed at
the Louisiana Department of Revenue (LDR).
The program provides up to a 40% tax credit,
which includes a 25% base credit, a 10%
increase for Louisiana screenplay productions,
and a 5% increase if the production is outside
of the New Orleans MSA. To be eligible, there
is a $50,000 minimum in-state expenditure
requirement       for  Louisiana     screenplay
productions and a $300,000 minimum in-state
expenditure requirement for all other
productions. Since 2017, total certified
spending within the industry has increased.

                                                                                                                1
MOTION PICTURE PRODUCTION TAX CREDIT ECONOMIC AND FISCAL IMPACT ANALYSIS
ROLE OF THE LOUISIANA MOTION PICTURE PRODUCTION TAX CREDIT
Interviews with eight (8) entertainment professionals were conducted to gather information about the role of the
tax credit program in attracting productions to Louisiana, the perception of Louisiana’s incentive program, and
current trends within the industry. The following is a summary of the major themes from this research.
IMPACT OF THE TAX CREDIT PROGRAM
Over the last few years, Louisiana’s motion picture industry has benefitted from a shift towards more
episodic work and the production of television shows within the state. The result has been long term
commitments that employ people for longer periods and create recurring revenue streams within the state.
Interviewees believe that the motion picture production tax credit program supports an industry that would
otherwise not exist within the state. This has created opportunities for residents to be exposed to the
industry early in their careers and for residents to continue to live and work in Louisiana. Outside of the
direct jobs that the industry creates, the presence of the film industry supports diverse employment
opportunities throughout the state, including in hotels, restaurants, retail, construction, and hardware
stores, among others.
While the incentive program is a critical factor in attracting productions to Louisiana, other competitive
factors that make the state attractive to productions are the accessible size and ease of navigation of the
state, streamlined permitting processes, and finally cost-effective food, gas, and lodging options.
Additionally, the existing industry presence and steady flow of production work have created a local crew
base that is well trained and skilled at their roles.
Local perception of past revisions to the program are largely positive, however, there is a desire for even
more support of local production talent.
COVID-19 DISRUPTIONS AND IMPACT
COVID-19 has caused significant impacts to most
COVID-19
industries – a problem that is not limited to Louisiana or
the motion picture production and exhibition industry. Beginning in March 2020, the COVID-19
While a significant amount of production work was forced pandemic and related prevention
to halt in 2020, there has been a focus on continuing to get measures forced business closures and
work done, and even expand, where possible. Post- paused production activity. The impacts of
production efforts for example, which are relatively well the pandemic continue to be felt and as of
suited to remote work, picked up when productions the writing of this report, it remains
slowed. unknown what the full impact on the
An extended pause in production has resulted in pent-up motion picture production industry will be.
demand. Interest in initiating new projects began to pick
up towards the end of 2020, albeit with a cautious eye on the ongoing pandemic.
As filming has resumed, COVID-19 prevention measures have created additional cost for productions.
Personal protective equipment (PPE), testing, potential delays, and distancing requirements have created
additional financial burdens for all productions.
2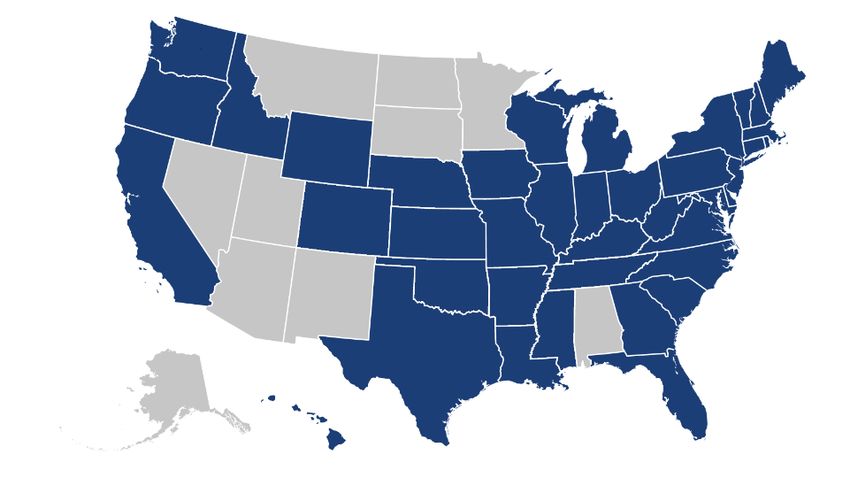
MOTION PICTURE PRODUCTION TAX CREDIT ECONOMIC AND FISCAL IMPACT ANALYSIS

METHODOLOGY
Louisiana Entertainment, a division of Louisiana Economic
                                                                       Modeling Software
Development, administers the motion picture production tax
credit program. In addition, the total certified spending and          Economic Modeling Specialists, Intl. (Emsi)
                                                                       designed the input-output model used in this
payroll amounts are verified by a Certified Public Accountant
                                                                       analysis. The Emsi model allows the analyst to
(CPA) before any credit is issued by LED. The total Louisiana          input the amount of new direct economic
spending and earnings were provided to Camoin 310, by the              activity (spending, earnings, or jobs) occurring
program for projects having credits certified in 2019 and 2020.        within the state of Louisiana and uses the direct
                                                                       inputs to estimate the spillover effects that the
Camoin 310 employed the following methodology to calculate             net new spending, earnings, or jobs have as
the economic impact of the Louisiana motion picture production         these new dollars circulate through the study
tax credit program. This impact analysis report does not take into     area’s economy. This is captured in the indirect
                                                                       impacts and is commonly referred to as the
consideration any decrease in state funding for other programs or
                                                                       “multiplier effect.” See Appendix A for more
public services.                                                       information on economic impact analysis.
 1.   CALCULATE TOTAL DIRECT SPENDING AND EARNINGS:                    What does “Net New” Mean?
      The first step is to identify the total amount of spending
                                                                       When looking at the economic impacts of a
      occurring and earnings generated in Louisiana as a result
                                                                       project, it’s important to look only at the
      of the tax credit program – these figures were used as the
                                                                       economic changes that would not happen in
      direct input into the model. This information was provided       that project’s absence. These effects are the “net
      by Louisiana Entertainment and reviewed by Camoin 310.           new” effects: purchases made only as a result of
      For purposes of this analysis, it is assumed that 100% of this   the project in question.
      spending and earnings are net new to the Louisiana
      economy and, without the credit programs, this spending          Definition of a “Job”
      would not occur.                                                 A “job” is equal to one person employed for
                                                                       some amount of time (part-time, full-time, or
2.    MODEL INDUSTRY ACTIVITY: In order to model the                   temporary) during 2019 or 2020. For example, if
      economic impact of the tax credits, it is important to           a person is employed full-time in 2019 and 2020
      accurately model the industries within which this activity is    that would be considered two jobs. Another
      taking place. This analysis uses the direct spending and         example, if one person is employed part-time
                                                                       for four months, then takes two months off and
      earning identified in Step 1 and distributes it among two
                                                                       is hired again for four months that would be
      major six-digit NAICS industries covering Louisiana’s
                                                                       considered two jobs.
      motion picture production industry. These categories
      represent the dominant industries within Louisiana’s             In addition, this spending did not create new
      greater film production ecosystem and accurately reflect         jobs; however, the jobs reported should be
      the industries where the tax credits will have the strongest     considered “jobs supported by the certified
      impact.                                                          spending.”

3.    MODEL ECONOMIC IMPACTS: Using the total sales and                The information must be calculated in this way
      earnings figures as inputs, we modeled the indirect              due to the manner which the job information is
      impacts—in terms of jobs, earnings, and sales—of the tax         reported by the Quarterly Census of
                                                                       Employment and Wages (QCEW), Bureau of
      credits on the state of Louisiana. Economic multipliers were
                                                                       Labor Statistics (BLS) and Bureau of Economic
      provided through the Emsi software package.
                                                                       Analysis (BEA). The information is provided by
                                                                       the employers to the government in terms of
 4.   MODEL FISCAL IMPACTS: Local and state tax revenues               total jobs, not by total number of total full-time
      resulting from economic activity associated with the tax         equivalents (FTE).
      credits were then estimated based on the results of the
      economic impact analysis.

                                                                                                                            3
MOTION PICTURE PRODUCTION TAX CREDIT ECONOMIC AND FISCAL IMPACT ANALYSIS
ECONOMIC IMPACT ANALYSIS
Table 1 shows total Louisiana spending and earnings in 2019 and 2020 associated with the motion picture
production tax credit program, as reported in the tax credit application and provided by Louisiana Entertainment.
In total, credit-eligible projects accounted for over $538 million in spending in 2019 and nearly $430 million in 2020.
Additionally, these projects generated nearly $168 million in earnings in 2019 and nearly $158 million in earnings in
2020.
Table 1
The total annual spending and earnings figures were used as the direct inputs in the model to generate the total
impacts in terms of new sales, jobs, and earnings.
TOTAL MOTION PICTURE PRODUCTION INDUSTRY IMPACT ANALYSIS
ECONOMIC IMPACT – 2019
As shown below, the Louisiana motion picture production tax credit programs resulted in an additional $478 million
in new indirect and induced sales in 2019, adding a total of over $1.0 billion in new spending. This spending
supported over 10,000 jobs, including over 4,800 direct jobs, as well as over $358 million in earnings.
ECONOMIC IMPACT – 2020
As shown below, the Louisiana motion picture production tax credit programs resulted in an additional $384 million
in new indirect and induced sales in 2020, adding a total of over $813 million in new spending. This spending
supported over 9,600 jobs, including nearly 4,700 direct jobs, as well as over $338 million in earnings.
Table 2
4MOTION PICTURE PRODUCTION TAX CREDIT ECONOMIC AND FISCAL IMPACT ANALYSIS
FISCAL IMPACT ANALYSIS
Beyond the economic impacts calculated above, there are also fiscal impacts of the motion picture production
industry that result from increased economic activity and accrue in the form of additional tax revenue. The following
section calculates the fiscal impact and the return on investment of the motion picture production tax credit
program.
IMPACTS ON STATE AND LOCAL REVENUE
IMPACTS ON STATE REVENUE
Table 3 calculates the state revenue that is generated because of the motion picture production tax credit program’s
economic activity. It is estimated that the portion of worker earnings that generate revenue for the state is
approximately 8.7%. Using total new earnings calculated above and applying 8.7% 1, over $31 million in new state
revenue in 2019 and over $29 million in 2020 were generated.
Table 3
IMPACTS ON LOCAL REVENUE
Table 4 calculates the amount of tax revenue that local agencies received in
2019 and 2020 as a result of the economic activity generated by the motion
picture production tax credit program. Camoin 310 calculated the proportion
of entertainment industry spending associated with credit-eligible projects
(total sales figure from the above table) relative to total sales across all
industries in 2019 and 2020. This percentage was then applied to Louisiana’s
total local tax collections in 2019 and 2020 to determine the portion of tax
collections attributable to the motion picture production tax credit program.
This methodology is based on the assumption that the share of credit-related
industry spending relative to the total state sales activity is approximately
equal to the share of local tax collections attributable to the tax credit
program. In other words, the motion picture production industry activity
Source: Louisiana Economic
makes up a certain percentage of the state’s total economic activity, and
Development
1As determined in the 2019 study, Economic and Fiscal Impact of Louisiana Entertainment Tax Credits conducted by Camoin
310 with Louisiana Entertainment. Camoin 310 worked with the state to determine the portion of workers’ earnings that
generate revenue for Louisiana.
5MOTION PICTURE PRODUCTION TAX CREDIT ECONOMIC AND FISCAL IMPACT ANALYSIS
therefore, the entertainment industry accounts for a similar percentage of the local jurisdictions’ revenue.
In total, the motion picture production tax credit program resulted in $21.9 million in new local tax revenue in 2019
and $16.9 million in 2020.
Table 4
TOTAL IMPACT ON PUBLIC REVENUE
Combining the state revenue and local revenue calculated above, the below table shows the total impact of the
entertainment tax credit programs on public revenue streams.
Table 5
RETURN ON INVESTMENT
The State is essentially investing in the motion picture production industry in Louisiana through the use of the tax
credit program. When considering the return on that investment, there are several ways to look at it, including direct
new state and local tax revenue generated by the industry and additional sales/earnings in the state that are
attributable to the program. The following tables show the impact of the motion picture production tax credit
program on the state’s finances, overall state resident earnings, and industry sales.
ADDITIONAL PUBLIC REVENUE PER DOLLAR OF TAX CREDIT
STATE AND LOCAL TAX REVENUE
As calculated in the previous section, the motion picture production tax credit program generated over $53 million
in additional state and local tax revenue in 2019 and over $46 million in 2020. With nearly $176 million in credits
certified in 2019 and nearly $133 million certified in 2020, this means that the return on investment for the motion
6MOTION PICTURE PRODUCTION TAX CREDIT ECONOMIC AND FISCAL IMPACT ANALYSIS
picture production program is approximately 0.30, or about 30 cents in tax revenue for every dollar of the tax credit,
in 2019, and approximately 0.35 in 2020. This ratio contemplates only the tax revenue generated and must be
understood in terms of the jobs, wages, and economic activity associated with the tax credits. Additionally, this type
of analysis is based on the best available data and readers should expect a slight margin of error in the Return on
Investment (ROI) of approximately 10%+/-.
Table 6
STATE TAX REVENUE
Louisiana’s state government issues the tax credits and bears the cost of doing so. Therefore, a more conservative
calculation of the program’s return on investment excludes local tax revenue collected as a result of the program.
The motion picture production tax credit program generated over $31 million in additional state tax revenue in
2019 and over $29 million in 2020. This means that the return on investment for the motion picture production
program is approximately 0.18, or about 18 cents in tax revenue for every dollar of the tax credit in 2019, and
approximately 0.22 in 2020. Again, this is a conservative calculation based only on state tax revenue generated
and the recognition that the state covers the cost of the credits issued.
Table 7
7MOTION PICTURE PRODUCTION TAX CREDIT ECONOMIC AND FISCAL IMPACT ANALYSIS
DYNAMIC IMPACT OF PROGRAMS ON STATEWIDE EARNINGS AND SALES
As shown in the Economic Impact Analysis, the motion picture production tax credit programs resulted in new
earnings and sales for residents and businesses in Louisiana. The following table calculates how the credits issued
resulted in economic activity in the state. Specifically:
For every one dollar of credits certified, there was an additional $2.04 in earnings in 2019 and $2.55 in
earnings in 2020.
For every one dollar of credits certified, there was an additional $5.78 in sales in 2019 and $6.12 in 2020.
Table 8
8MOTION PICTURE PRODUCTION TAX CREDIT ECONOMIC AND FISCAL IMPACT ANALYSIS
ATTACHMENT A: WHAT IS ECONOMIC IMPACT ANALYSIS?
The purpose of conducting an economic impact study is to ascertain the total cumulative changes in employment,
earnings and output in a given economy due to some initial “change in final demand”. To understand the meaning
of “change in final demand”, consider the installation of a new widget manufacturer in Anytown, USA. The widget
manufacturer sells $1 million worth of its widgets per year exclusively to consumers in Canada. Therefore, the annual
change in final demand in the United States is $1 million because dollars are flowing in from outside the United
States and are therefore “new” dollars in the economy.
This change in final demand translates into the first round of buying and selling that occurs in an economy. For
example, the widget manufacturer must buy its inputs of production (electricity, steel, etc.), must lease or purchase
property and pay its workers. This first round is commonly referred to as the “Direct Effects” of the change in final
demand and is the basis of additional rounds of buying and selling described below.
To continue this example, the widget manufacturer’s vendors (the supplier of electricity and the supplier of steel)
will enjoy additional output (i.e. sales) that will sustain their businesses and cause them to make additional purchases
in the economy. The steel producer will need more pig iron and the electric company will purchase additional power
from generation entities. In this second round, some of those additional purchases will be made in the US economy
and some will “leak out”. What remains will cause a third round (with leakage) and a fourth (and so on) in ever-
diminishing rounds of industry-to-industry purchases. Finally, the widget manufacturer has employees who will
naturally spend their wages. Again, those wages spent will either be for local goods and services or will “leak” out
of the economy. The purchases of local goods and services will then stimulate other local economic activity.
Together, these effects are referred to as the “Indirect Effects” of the change in final demand.
Therefore, the total economic impact resulting from the new widget manufacturer is the initial $1 million of new
money (i.e. Direct Effects) flowing in the US economy, plus the Indirect Effects. The ratio of Total Effects to Direct
Effects is called the “multiplier effect” and is often reported as a dollar-of-impact per dollar-of-change. Therefore, a
multiplier of 2.4 means that for every dollar ($1) of change in final demand, an additional $1.40 of indirect economic
activity occurs for a total of $2.40.
Key information for the reader to retain is that this type of analysis requires rigorous and careful consideration of
the geography selected (i.e. how the “local economy” is defined) and the implications of the geography on the
computation of the change in final demand. If this analysis wanted to consider the impact of the widget
manufacturer on the entire North American continent, it would have to conclude that the change in final demand
is zero and therefore the economic impact is zero. This is because the $1 million of widgets being purchased by
Canadians is not causing total North American demand to increase by $1 million. Presumably, those Canadian
purchasers will have $1 million less to spend on other items and the effects of additional widget production will be
canceled out by a commensurate reduction in the purchases of other goods and services.
Changes in final demand, and therefore Direct Effects, can occur in a number of circumstances. The above example
is easiest to understand: the effect of a manufacturer producing locally but selling globally. If, however, 100% of
domestic demand for a good is being met by foreign suppliers (say, DVD players being imported into the US from
Korea and Japan), locating a manufacturer of DVD players in the US will cause a change in final demand because all
of those dollars currently leaving the US economy will instead remain. A situation can be envisioned whereby a
producer is serving both local and foreign demand, and an impact analysis would have to be careful in calculating
how many “new” dollars the producer would be causing to occur domestically.
9MOTION PICTURE PRODUCTION TAX CREDIT ECONOMIC AND FISCAL IMPACT ANALYSIS
Leading action to
grow your economy
Camoin 310
120 West Avenue, Suite 303
Saratoga Springs, NY 12866
518.899.2608
www.camoinassociates.com
@camoinassociate
10SUBMITTED TO:
Louisiana Entertainment
617 North Third Street, PO Box 94185
Baton Rouge, LA 70802
Economic and Fiscal Impact
LIVE PERFORMANCE PRODUCTION
PROGRAM, 2019-2020
Louisiana Entertainment
MARCH 2021
PREPARED BY:
120 West Avenue, Suite 303
Saratoga Springs, NY 12866
518.899.2608
www.camoinassociates.comABOUT CAMOIN 310 Camoin 310 has provided economic development consulting services to municipalities, economic development agencies, and private enterprises since 1999. Through the services offered, Camoin 310 has served EDOs and local and state governments from Maine to California; corporations and organizations that include Amazon, Lowes Home Improvement, FedEx, Volvo (Nova Bus) and the New York Islanders; as well as private developers proposing projects in excess of $6 billion. Our reputation for detailed, place-specific, and accurate analysis has led to over 1,000 projects in 40 states and garnered attention from national media outlets including Marketplace (NPR), Crain’s New York Business, Forbes magazine, The New York Times, and The Wall Street Journal. Additionally, our marketing strategies have helped our clients gain both national and local media coverage for their projects in order to build public support and leverage additional funding. We are based in Saratoga Springs, NY, with regional offices in Richmond, VA; Portland, ME; Boston, MA; and Brattleboro, VT. To learn more about our experience and projects in all of our service lines, please visit our website at www.camoinassociates.com. You can also find us on Twitter @camoinassociate and on Facebook. THE PROJECT TEAM Rachel Selsky Project Principal Jessica Ulbricht Project Analyst
ECONOMIC IMPACT
                                      OF THE LIVE PERFORMANCE
                                     TA X                                                 C R E D I T
                            Louisiana’s Musical and Theatrical Production Income Tax Credit (live performance)
                            incentivizes investment in Louisiana-based productions. This program helps to
                            attract and retain jobs and generates investment in Louisiana’s economy, and
                            promotes investment in musical and theatrical production infrastructure.

                            The report includes expenditures certified in 2019 and 2020, of which the actual spending likely occurred in previous years and quantifies
                            the economic and fiscal impacts of the live performance tax credit program on the state.

TOTAL CERTIFIED                                     ANNUAL ECONOMIC ACTIVITY
   SPENDING                                                GENERATED
 $16,054,753

                                  2019
              $12,045,995

                                                                     414                      $11,014,078                               $30,276,482
                                                                    JOBS                           EARNINGS                                      SALES

                                 2020                                456
                                                                    JOBS
                                                                                              $12,295,541
                                                                                                   EARNINGS
                                                                                                                                        $22,786,799
                                                                                                                                                 SALES
  2019          2020

                                   TOTAL TAX REVENUE                                                  ADDITIONAL EARNINGS
TOTAL CERTIFIED                        GENERATED                                                        FOR LOUISIANA’S
    CREDITS                                                                                                RESIDENTS
 $3,214,714

               $2,463,736

                                                                                                  For every one dollar of credits certified,
                                                                                                         there was an additional:

                                        2019                              2020                                  2019                        2020
                                 $1,609,844                           $1,542,808                                $3.43                         $4.99
                                                                                                                in earnings in the state.
  2019          2020

                                                                                                                         2021 Camoin Associates, Inc.
                                                                                                                          www.camoinassociates.com
Source: Louisiana Economic Development CONTENTS Introduction .................................................................................................................................................. 1 Economic Impact Analysis....................................................................................................................... 4 Fiscal Impact Analysis ............................................................................................................................... 5
This page intentionally left blank.

                 TOC Photo:

 1)         Change photo to represent RFP/Q
              geography or subject matter.

2)         Change color: Picture tools ->color -
              > recolor, choose dark blue.

      3)       Size approximatley 2.3” x 5”

      4)       Keep page after TOC blank.
ECONOMIC AND FISCAL IMPACT OF LOUISIANA’S LIVE PERFORMANCE PRODUCTION PROGRAM
INTRODUCTION
The purpose of this report is to quantify the economic and fiscal impacts generated by the Musical and Theatrical
Production Income Tax Credit (live performance production program, or live performance) administered by the
Office of Entertainment Industry Development (OEID) within the Louisiana Department of Economic Development
(LED).
As required by LA R.S. 47:6034(G), LED provisions a biennial review of the economic and fiscal impacts of these
credits and has retained Camoin 310 to complete this review for the 2019 and 2020 calendar years.
The goals of the Louisiana Live Performance Tax Credit program are to encourage investment and job creation
within Louisiana. The purpose of this analysis is to calculate the impact of the tax credit program on the state’s
economy.
HISTORY OF THE LIVE PERFORMANCE PRODUCTION PROGRAM
The Musical and Theatrical Production Income Figure 1
Tax Credit was implemented in 2007 to
encourage investment in productions that
originate in the state of Louisiana.
Today, this program offers up to an 18% tax
credit on Louisiana expenditures, in addition
to a 7% tax credit on resident payroll. The tax
credit value increases with total production
expenditures. Since 2017, the total number of
live production jobs attributed to the program
has increased from 439 to 456 in 2020,
although certified spending has decreased
since peaking in 2014. This is likely attributed
to the sunset of the infrastructure portion of
Figure 2
the tax credit program.
1ECONOMIC AND FISCAL IMPACT OF LOUISIANA’S LIVE PERFORMANCE PRODUCTION PROGRAM
ROLE OF THE LOUISIANA INCENTIVE PROGRAMS
Interviews with eight entertainment professionals
were conducted to gather information about the
role of the tax credit program in attracting the
industry to Louisiana, the perception of Louisiana’s
incentive program, and current trends within the
industry including the impact of the COVID-19
pandemic. The following is a summary of the major
themes from this research.
Source: Louisiana Economic Development
IMPACT OF THE TAX CREDIT PROGRAM
The tax credit program brings live performances to Louisiana that wouldn’t otherwise exist in the state.
Production companies target Louisiana as a result of the unique program and interviewees noted that there
is not a comparable incentive elsewhere within the live performance space. Without the incentive program,
interviewees noted that productions would seek out other locations in larger markets.
The incentive continues to drive live performance programming to focus on Louisiana performers and
venues. According to interviewees, fewer live performance programs would be produced in-state without
the incentive.
Within the state, there is a focus on using live performances to celebrate the community. Interviewees noted
that there is a growing trend of focusing on bringing in new voices and diverse perspectives to
performances as a way to celebrate Louisiana’s unique culture.
COVID-19 DISRUPTIONS AND IMPACT
Unsurprisingly, COVID-19 has been a significant challenge
COVID-19
for live performances.
To adapt to new regulations and capacity restrictions, many Beginning in March 2020, the COVID-19
live performances are exploring the use of distance seating pandemic and related prevention
to ensure the safety of both the performers as well as the measures forced business closures and
audience. paused live production activity. The
Interviewees noted that live performance organizations are impacts of the pandemic continue to be
employing a variety of creative tactics to get through the felt and as of the writing of this report, it
pandemic. This includes hybrid seasons with virtual remains unknown what live performances
performances, outdoor shows where possible, and popup will look like in the future.
shows.
2ECONOMIC AND FISCAL IMPACT OF LOUISIANA’S LIVE PERFORMANCE PRODUCTION PROGRAM
METHODOLOGY
Louisiana Entertainment, a division of Louisiana Economic
Modeling Software
Development, administers the live performance production
program. In addition, the total certified spending and payroll Economic Modeling Specialists, Intl. (Emsi)
designed the input-output model used in this
amounts are verified by a Certified Public Accountant (CPA)
analysis. The Emsi model allows the analyst to
before any credit is issued by LED. The total Louisiana spending input the amount of new direct economic
and earnings were provided to Camoin 310, by the program for activity (spending, earnings, or jobs) occurring
projects having credits certified in 2019 and 2020. within the state of Louisiana and uses the direct
inputs to estimate the spillover effects that the
Camoin 310 employed the following methodology to calculate net new spending, earnings, or jobs have as
the economic impact of the Louisiana live performance tax credit these new dollars circulate through the study
program. This impact analysis report does not take into area’s economy. This is captured in the indirect
impacts and is commonly referred to as the
consideration any decrease in state funding for other programs or
“multiplier effect.” See Appendix A for more
public services. information on economic impact analysis.
1. CALCULATE TOTAL DIRECT SPENDING AND EARNINGS: What does “Net New” Mean?
The first step is to identify the total amount of spending
When looking at the economic impacts of a
occurring and earnings generated in Louisiana as a result of
project, it’s important to look only at the
the tax credit program – these figures were used as the
economic changes that would not happen in
direct input into the model. This information was provided that project’s absence. These effects are the
by Louisiana Entertainment and reviewed by Camoin 310. “net new” effects: purchases made only as a
For purposes of this analysis, it is assumed that 100% of this result of the project in question.
spending and earnings are net new to the Louisiana
economy and, without the credit programs, this spending Definition of a “Job”
would not occur. A “job” is equal to one person employed for
some amount of time (part-time, full-time, or
2. MODEL INDUSTRY ACTIVITY: In order to model the temporary) during 2019 or 2020. For example,
economic impact of the tax credits, it is important to if a person is employed full-time in 2019 and
2020 that would be considered two jobs.
accurately model the industries within which this activity is
Another example, if one person is employed
taking place. This analysis uses the direct spending and
part-time for four months, then takes two
earning identified in Step 1 and associates it with four six- months off and is hired again for four months
digit NAICS codes that best capture industry activity. These that would be considered two jobs.
codes represent Louisiana’s live performance industry and
accurately reflect the industries where the tax credits will In addition, this spending did not create new
have the strongest impact. jobs; however, the jobs reported should be
considered “jobs supported by the certified
spending.”
3. MODEL ECONOMIC IMPACTS: Using the total sales and
earnings figures as inputs, we modeled the indirect
The information must be calculated in this way
impacts—in terms of jobs, earnings, and sales—of the tax due to the manner which the job information is
credits on the state of Louisiana. Economic multipliers were reported by the Quarterly Census of
provided through the Emsi software package. Employment and Wages (QCEW), Bureau of
Labor Statistics (BLS) and Bureau of Economic
4. MODEL FISCAL IMPACTS: Local and state tax revenues Analysis (BEA). The information is provided by
resulting from economic activity associated with the tax the employers to the government in terms of
total jobs, not by total number of total full-time
credits were then estimated based on the results of the
equivalents (FTE).
economic impact analysis.
3ECONOMIC AND FISCAL IMPACT OF LOUISIANA’S LIVE PERFORMANCE PRODUCTION PROGRAM
ECONOMIC IMPACT ANALYSIS
Table 1 shows total Louisiana spending and earnings in 2019 and 2020 associated with the live performance tax
credit program, as reported in tax credit applications and provided by Louisiana Entertainment. In total, credit-
eligible projects accounted for over $16 million in spending in 2019 and over $12 million in 2020. These projects
also accounted for over $5 million in earnings in 2019 and over $6 million in 2020.
Table 1
The total annual spending and earnings figures were used as the direct inputs in the model to generate the total
impacts in terms of new sales, jobs, and earnings.
TOTAL LIVE PRODUCTION INDUSTRY IMPACT ANALYSIS
ECONOMIC IMPACT – 2019
As shown below, the Louisiana live performance production program resulted in an additional approximately $14
million in new indirect and induced sales in 2019, adding a total of over $30 million in new spending. This spending
supported 414 jobs, as well as over $11 million in earnings.
ECONOMIC IMPACT – 2020
As shown below, the Louisiana live performance production program resulted in an additional approximately $11
million in new indirect and induced sales in 2020, adding a total of nearly $23 million in new spending. This spending
supported 456 jobs, as well as over $12 million in earnings.
Table 2
4ECONOMIC AND FISCAL IMPACT OF LOUISIANA’S LIVE PERFORMANCE PRODUCTION PROGRAM
FISCAL IMPACT ANALYSIS
Beyond the economic impacts calculated above, there are also fiscal impacts of the live performance industry that
result from increased economic activity and accrue in the form of additional tax revenue. The following section
calculates the fiscal impact and the return on investment of the live performance tax credit program.
IMPACTS ON STATE AND LOCAL REVENUE
IMPACTS ON STATE REVENUE
Table 3 calculates the state revenue that is generated because of the live performance tax credit program’s economic
activity. It is estimated that the portion of worker earnings that generate revenue for the state is approximately 8.7%.
Using the total new earnings calculated above and applying 8.7% 1, over $958,000 in new state revenue in 2019 and
nearly $1.1 million in 2020 were generated.
Table 3
IMPACTS ON LOCAL REVENUE
The table below calculates the amount of tax revenue that local agencies received in 2019 and 2020 as a result of
the economic activity generated by the live performance tax credit program. Camoin 310 calculated the proportion
of live performance industry spending associated with credit-eligible projects (total sales figure from Table 2) relative
to total sales across all industries in 2019 and 2020. This percentage was then applied to Louisiana’s total local tax
collections in 2019 and 2020 to determine the portion of tax collections attributable to the live performance tax
credit program.
This methodology is based on the assumption that the share of credit-related industry spending relative to the total
state sales activity is approximately equal to the share of local tax collections attributable to the tax credit program.
In other words, the live performance industry activity makes up a certain percentage of the state’s total economic
activity, and therefore, the live performance industry accounts for a similar percentage of the local jurisdictions’
revenue.
In total, the live performance tax credit program resulted in approximately $652,000 in new local tax revenue in
2019 and $473,000 in 2020.
1As determined in the 2019 study, Economic and Fiscal Impact of Louisiana Entertainment Tax Credits conducted by Camoin
Associates with Louisiana Entertainment. Camoin 310 worked with the state to determine the portion of workers’ earnings that
generate revenue for Louisiana.
5ECONOMIC AND FISCAL IMPACT OF LOUISIANA’S LIVE PERFORMANCE PRODUCTION PROGRAM
Table 4
TOTAL IMPACT ON PUBLIC REVENUE
Combining the state revenue and local revenue calculated above, the below table shows the total impact of the live
performance tax credit programs on public revenue streams.
Table 5
RETURN ON INVESTMENT
The State is essentially investing in the live
performance industry in Louisiana through the
use of the tax credit program. When considering
the return on that investment, there are a number
of ways to look at it, including direct new state and
local tax revenue generated by the industry and
additional sales/earnings in the state that are
attributable to the program. The following tables
show the impact of the live performance tax credit
program on the state’s finances, overall state
Source: Louisiana Economic Development
resident earnings, and industry sales.
6ECONOMIC AND FISCAL IMPACT OF LOUISIANA’S LIVE PERFORMANCE PRODUCTION PROGRAM
ADDITIONAL PUBLIC REVENUE PER DOLLAR OF TAX CREDIT
STATE AND LOCAL TAX REVENUE
As calculated in the previous section, the live performance tax credit program generated over $1.6 million in
additional state and local tax revenue in 2019 and over $1.5 million in 2020. With over $3.2 million in credits certified
in 2019 and nearly $2.5 million certified in 2020, this means that the return on investment for live performance
programs was approximately 0.50, or about 50 cents in tax revenue for every dollar of the tax credit, in 2019, and
approximately 0.63 in 2020. This ratio contemplates only the tax revenue generated and must be understood in
terms of the jobs, wages, and economic activity associated with the tax credits. Additionally, this type of analysis is
based on the best available data and readers should expect a slight margin of error in the Return on Investment
(ROI) of approximately +/- 10%.
Table 6
STATE TAX REVENUE
Louisiana’s state government issues the tax credits and bears the cost of doing so. Therefore, a more conservative
calculation of the program’s return on investment excludes local tax revenue collected as a result of the program.
The live performance tax credit program generated over $958,000 in additional state tax revenue in 2019 and
nearly $1.1 million in 2020. This means that the return on investment for the live performance tax credit program
is approximately 0.30, or about 30 cents in tax revenue for every dollar of the tax credit in 2019, and
approximately 0.43 in 2020. Again, this is a conservative calculation based only on state tax revenue generated
and the recognition that the state covers the cost of the credits issued.
Table 7
7ECONOMIC AND FISCAL IMPACT OF LOUISIANA’S LIVE PERFORMANCE PRODUCTION PROGRAM
DYNAMIC IMPACT OF PROGRAMS ON STATEWIDE EARNINGS AND SALES
As shown in the Economic Impact Analysis, the live performance tax credit programs resulted in new earnings and
sales for residents and businesses in Louisiana. Table 8 calculates how the credits issued resulted in economic activity
in the state. Specifically:
For every one dollar of credits certified, there was an additional $3.43 in earnings in 2019 and $4.99 in
earnings in 2020.
For every one dollar of credits certified, there was an additional $9.42 in sales in 2019 and $9.25 in 2020.
Table 8
8ECONOMIC AND FISCAL IMPACT OF LOUISIANA’S LIVE PERFORMANCE PRODUCTION PROGRAM
ATTACHMENT A: WHAT IS ECONOMIC IMPACT ANALYSIS?
The purpose of conducting an economic impact study is to ascertain the total cumulative changes in employment,
earnings, and output in a given economy due to some initial “change in final demand”. To understand the meaning
of “change in final demand”, consider the installation of a new widget manufacturer in Anytown, USA. The widget
manufacturer sells $1 million worth of its widgets per year exclusively to consumers in Canada. Therefore, the annual
change in final demand in the United States is $1 million because dollars are flowing in from outside the United
States and are therefore “new” dollars in the economy.
This change in final demand translates into the first round of buying and selling that occurs in an economy. For
example, the widget manufacturer must buy its inputs of production (electricity, steel, etc.), must lease or purchase
property and pay its workers. This first round is commonly referred to as the “Direct Effects” of the change in final
demand and is the basis of additional rounds of buying and selling described below.
To continue this example, the widget manufacturer’s vendors (the supplier of electricity and the supplier of steel)
will enjoy additional output (i.e. sales) that will sustain their businesses and cause them to make additional purchases
in the economy. The steel producer will need more pig iron and the electric company will purchase additional power
from generation entities. In this second round, some of those additional purchases will be made in the US economy
and some will “leak out”. What remains will cause a third round (with leakage) and a fourth (and so on) in ever-
diminishing rounds of industry-to-industry purchases. Finally, the widget manufacturer has employees who will
naturally spend their wages. Again, those wages spent will either be for local goods and services or will “leak” out
of the economy. The purchases of local goods and services will then stimulate other local economic activity.
Together, these effects are referred to as the “Indirect Effects” of the change in final demand.
Therefore, the total economic impact resulting from the new widget manufacturer is the initial $1 million of new
money (i.e. Direct Effects) flowing in the US economy, plus the Indirect Effects. The ratio of Total Effects to Direct
Effects is called the “multiplier effect” and is often reported as a dollar-of-impact per dollar-of-change. Therefore, a
multiplier of 2.4 means that for every dollar ($1) of change in final demand, an additional $1.40 of indirect economic
activity occurs for a total of $2.40.
Key information for the reader to retain is that this type of analysis requires rigorous and careful consideration of
the geography selected (i.e. how the “local economy” is defined) and the implications of the geography on the
computation of the change in final demand. If this analysis wanted to consider the impact of the widget
manufacturer on the entire North American continent, it would have to conclude that the change in final demand
is zero and therefore the economic impact is zero. This is because the $1 million of widgets being purchased by
Canadians is not causing total North American demand to increase by $1 million. Presumably, those Canadian
purchasers will have $1 million less to spend on other items and the effects of additional widget production will be
canceled out by a commensurate reduction in the purchases of other goods and services.
Changes in final demand, and therefore Direct Effects, can occur in a number of circumstances. The above example
is easiest to understand: the effect of a manufacturer producing locally but selling globally. If, however, 100% of
domestic demand for a good is being met by foreign suppliers (say, DVD players being imported into the US from
Korea and Japan), locating a manufacturer of DVD players in the US will cause a change in final demand because all
of those dollars currently leaving the US economy will instead remain. A situation can be envisioned whereby a
producer is serving both local and foreign demand, and an impact analysis would have to be careful in calculating
how many “new” dollars the producer would be causing to occur domestically.
9ECONOMIC AND FISCAL IMPACT OF LOUISIANA’S LIVE PERFORMANCE PRODUCTION PROGRAM
Leading action to
grow your economy
Camoin 310
120 West Avenue, Suite 303
Saratoga Springs, NY 12866
518.899.2608
www.camoinassociates.com
@camoinassociate
10SUBMITTED TO:
Louisiana Entertainment
617 North Third Street, PO Box 94185
Baton Rouge, LA 70802
Economic and Fiscal Impact
SOUND RECORDING INVESTOR TAX
CREDIT, 2019-2020
Louisiana Entertainment
MARCH 2021
PREPARED BY:
120 West Avenue, Suite 303
Saratoga Springs, NY 12866
518.899.2608
www.camoinassociates.comABOUT CAMOIN 310 Camoin 310 has provided economic development consulting services to municipalities, economic development agencies, and private enterprises since 1999. Through the services offered, Camoin 310 has served EDOs and local and state governments from Maine to California; corporations and organizations that include Amazon, Lowes Home Improvement, FedEx, Volvo (Nova Bus) and the New York Islanders; as well as private developers proposing projects in excess of $6 billion. Our reputation for detailed, place-specific, and accurate analysis has led to over 1,000 projects in 40 states and garnered attention from national media outlets including Marketplace (NPR), Crain’s New York Business, Forbes magazine, The New York Times, and The Wall Street Journal. Additionally, our marketing strategies have helped our clients gain both national and local media coverage for their projects in order to build public support and leverage additional funding. We are based in Saratoga Springs, NY, with regional offices in Richmond, VA; Portland, ME; Boston, MA; and Brattleboro, VT. To learn more about our experience and projects in all of our service lines, please visit our website at www.camoinassociates.com. You can also find us on Twitter @camoinassociate and on Facebook. THE PROJECT TEAM Rachel Selsky Project Principal Jessica Ulbricht Project Analyst
ECONOMIC IMPACT
                                   OF THE SOUND RECORDING
                                  TA X                                                 C R E D I T
                         Louisiana’s Sound Recording Investor Tax Credit incentivizes sound recording (the
                         recording of music, poetry, or spoken word performance) made in or produced in
                         Louisiana. This program helps to attract and retain jobs and generates investment
                         in Louisiana’s economy and promotes the state’s overall entertainment industry.

                         The report includes expenditures certified in 2019 and 2020, of which the actual spending likely occurred in a previous year, and quantifies
                         the economic and fiscal impacts of the sound recording tax credit program on the state.

TOTAL CERTIFIED                                  ANNUAL ECONOMIC ACTIVITY
   SPENDING                                             GENERATED
   $412,033

                               2019                                  6                         $154,132                                   $614,787
              $151,034                                           JOBS                            EARNINGS                                      SALES

                              2020                               JOBS
                                                                     3                           $56,492
                                                                                                 EARNINGS
                                                                                                                                          $224,868
                                                                                                                                               SALES
  2019        2020

                                TOTAL TAX REVENUE                                                   ADDITIONAL EARNINGS
TOTAL CERTIFIED                     GENERATED                                                         FOR LOUISIANA’S
    CREDITS                                                                                              RESIDENTS
 $74,166

              $27,186                                                                           For every one dollar of credits certified,
                                                                                                       there was an additional:

                                     2019                               2020                                  2019                        2020
                                  $41,226                               $9,584                                $2.08                         $2.08
                                                                                                              in earnings in the state.
  2019 2020

                                                                                                                      2021 Camoin Associates, Inc.
                                                                                                                       www.camoinassociates.com
Source: Louisiana Economic Development CONTENTS Introduction .................................................................................................................................................. 1 Economic Impact Analysis....................................................................................................................... 4 Fiscal Impact Analysis ............................................................................................................................... 5
This page intentionally left blank.

TOC Photo:

   1)        Change photo to represent RFP/Q
             geography or subject matter.

   2)        Change color: Picture tools ->color ->
             recolor, choose dark blue.

   3)        Size approximatley 2.3” x 5”

   4)        Keep page after TOC blank.
ECONOMIC AND FISCAL IMPACT OF LOUISIANA’S SOUND RECORDING PROGRAM
INTRODUCTION
The purpose of this report is to quantify the economic and fiscal impacts generated by the Sound Recording Investor
Tax Credit (sound recording program) administered by the Office of Entertainment Industry Development (OEID)
within the Louisiana Department of Economic Development (LED).
As required by LA R.S. 47:6023(D)(5), LED provisions a biennial review of the economic and fiscal impacts of these
credits and has retained Camoin 310 to complete this review for the 2019 and 2020 calendar years.
The goals of the Louisiana sound recording tax credit program is to encourage investment and job creation within
Louisiana. The purpose of this analysis is to calculate the impact of the tax credit program on the state’s economy.
OVERVIEW OF THE SOUND RECORDING INVESTOR TAX CREDIT
The sound recording program incentivizes Figure 1
sound recording, defined as a recording of
music, poetry, or spoken-word performance
made in Louisiana and produced in Louisiana
in whole or in part. The program provides an
18% tax credit for eligible production
expenditures, for which $25,000 minimum
expenditures are required (or $10,000 for
Louisiana residents). Eligible expenditures
include studio rental fees and associated
costs, artist and musician salaries, producer
fees, instrument and equipment rentals, and
travel expenses, among others.
Certified spending under this program has
trended slightly upwards since 2017, though Figure 2
remaining relatively flat. The trend in industry
jobs attributed to the program has been
similar, with a small increase occurring in
2019.
1ECONOMIC AND FISCAL IMPACT OF LOUISIANA’S SOUND RECORDING PROGRAM
ROLE OF THE LOUISIANA INCENTIVE PROGRAM
Interviews with eight entertainment professionals were conducted to gather information about the role of the tax
credit program in attracting productions to Louisiana, the perception of Louisiana’s incentive program, and current
trends within the industry including the impact of the COVID-19 pandemic. The following is a summary of the major
themes from this research related to the sound recording program.
IMPACT OF THE TAX CREDIT PROGRAM
According to interviewees, Louisiana’s sound recording industry has been bolstered by the incentive
program. The incentive has helped develop industry opportunities that allow for sound recording
professionals to work in-state.
Sound recording professionals who live in Louisiana are able to bring business to the state that would
otherwise occur out of state. For example, interviewees pointed to the ability to record music in Louisiana
for motion picture productions that are being produced outside of Louisiana.
COVID-19 DISRUPTIONS AND IMPACT
As with other industries, professionals in the sound
COVID-19
recording industry have been creative in their approaches
to adapting to COVID-19 constraints. Recording work was Beginning in March 2020, the COVID-19
well suited to social distancing and remote work, and pandemic and related prevention
virtual content including live albums have become popular measures forced business closures and
within the industry. paused production activity. The impacts of
Interviewees noted that those who pivoted early on in the the pandemic continue to be felt and as of
pandemic were able to expand these lines of business in the writing of this report, it remains
2020. The normal workflow is beginning to pick back up unknown how the impacts will continue to
and it is expected that 2021 will be a strong year given play out in the sound recording industry.
pent-up demand from motion picture productions and
other segments of the entertainment industry.
2ECONOMIC AND FISCAL IMPACT OF LOUISIANA’S SOUND RECORDING PROGRAM
METHODOLOGY
Louisiana Entertainment, a division of Louisiana Economic
Modeling Software
Development, administers the Sound Recording Investor Tax Credit
program. In addition, the total certified spending and payroll Economic Modeling Specialists, Intl. (Emsi)
designed the input-output model used in this
amounts are verified by a Certified Public Accountant (CPA) before
analysis. The Emsi model allows the analyst to
any credit is issued by LED. The total Louisiana spending and input the amount of new direct economic
earnings were provided to Camoin 310, by the program for projects activity (spending, earnings, or jobs) occurring
having credits certified in 2019 and 2020. within the state of Louisiana and uses the direct
inputs to estimate the spillover effects that the
Camoin 310 employed the following methodology to calculate the net new spending, earnings, or jobs have as
economic impact of the Louisiana sound recording tax credit these new dollars circulate through the study
program. This impact analysis report does not take into area’s economy. This is captured in the indirect
impacts and is commonly referred to as the
consideration any decrease in state funding for other programs or
“multiplier effect.” See Appendix A for more
public services. information on economic impact analysis.
1. CALCULATE TOTAL DIRECT SPENDING AND EARNINGS:
What does “Net New” Mean?
The first step is to identify the total amount of spending
occurring and earnings generated in Louisiana as a result When looking at the economic impacts of a
project, it’s important to look only at the
of the tax credit program – these figures were used as the
economic changes that would not happen in
direct input into the model. This information was provided that project’s absence. These effects are the “net
by Louisiana Entertainment and reviewed by Camoin 310. new” effects: purchases made only as a result of
For purposes of this analysis, it is assumed that 100% of the project in question.
this spending and earnings are net new to the Louisiana
economy and, without the credit programs, this spending Definition of a “Job”
would not occur. A “job” is equal to one person employed for
some amount of time (part-time, full-time, or
2. MODEL INDUSTRY ACTIVITY: In order to model the temporary) during 2019 or 2020. For example, if
a person is employed full-time in 2019 and 2020
economic impact of the tax credits, it is important to
that would be considered two jobs. Another
accurately model the industries within which this activity is example, if one person is employed part-time
taking place. This analysis uses the direct spending and for four months, then takes two months off and
earning identified in Step 1 and associates it with the is hired again for four months that would be
considered two jobs.
NAICS industry that is representative of Louisiana’s sound
recording ecosystem. This reflects the industry where the In addition, this spending did not create new
tax credits will have the strongest impact. jobs; however, the jobs reported should be
considered “jobs supported by the certified
3. MODEL ECONOMIC IMPACTS: Using the total sales and spending.”
earnings figures as inputs, we modeled the indirect
The information must be calculated in this way
impacts—in terms of jobs, earnings, and sales—of the tax due to the manner which the job information is
credits on the state of Louisiana. Economic multipliers were reported by the Quarterly Census of
provided through the Emsi software package. Employment and Wages (QCEW), Bureau of
Labor Statistics (BLS) and Bureau of Economic
Analysis (BEA). The information is provided by
4. MODEL FISCAL IMPACTS: Local and state tax revenues the employers to the government in terms of
resulting from economic activity associated with the tax total jobs, not by total number of total full-time
credits were then estimated based on the results of the equivalents (FTE).
economic impact analysis.
3You can also read